EURJPY -400pips dump coming Technical analysis indicates that the 178.00 level represents a significant technical resistance for EUR/JPY, further reinforced by a converging trendline. A bearish rejection from this resistance confluence could precipitate a corrective decline. We anticipate a potential downward movement of at least 400 pips upon a confirmed rejection at this level.
DISCLAIMER: ((trade based on your own decision))
<<press like👍 if you enjoy💚
Trend Lines

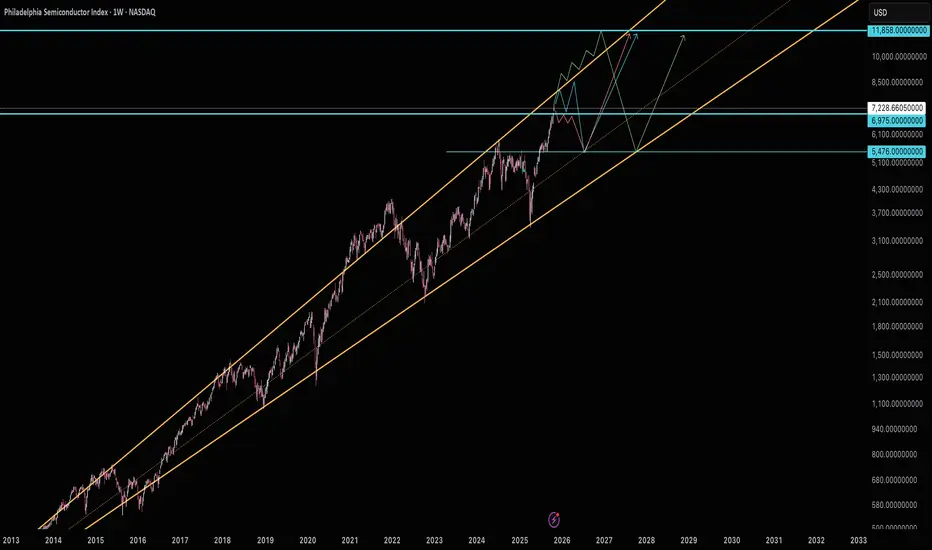
Possible SOX OutcomesSemiconductors are well off their long term trend line and quickly approaching the upper/faster trend. I'm quite positive this is the warning Michael Burry was talking about in his recent twitter post.
I'm speculating the green path is actually more likely than not and if semiconductors take that that path, then we're in for an extremely large drop similar to 2022. The S&P Technology sector index (S5INFT) is currently well above it's fast trend line similar to post covid.
*If* the major resistance at 6975 takes over this could lead to a more reasonable trend and avoid such a large downtrend later.
I'm noticing that below current prices there hasn't been really any support made since 5478 in August, which is why I'm noting that as an important area that *if* there's a pullback that will likely be a smart area to buy.
Ultimately, like Burry is speculating there's a bubble, I'm also concerned about the eventual drop to that lower trend line. Currently because brokers margin account levels hasn't shown any real acceleration (like it did post-covid) I'd be inclined to speculate the bubble is just starting and the more extreme move is going to occur (the green path). Also hits of the lower trend line tend to be spaced out over many years. However it plays out, I'm inclined to save most of my capital for when semiconductors hit that lower trend line.
Ripple on the Verge of a Heavy DropGiven the breakdown of the trend line (green line), the formation of a supply zone (orange zone), and the price pulling back to the supply zone with a reaction at the supply level, our first support area is the blue line zones. This is because, after breaking the trend line, the price tends to oscillate between the trend line and the next level. If the price breaks below the blue level, it will reach the marked areas, indicating that Ripple could potentially drop to around 1.16. BINANCE:XRPUSDT

ETHUSDOnce again 3,800 support holds price up. Waiting to see if we can get a break above H1 resistance and trendline to look for buys.

GOLD → Consolidation. The fundamental backdrop is changing...FX:XAUUSD stabilizes after a week-long decline, failing to consolidate above $4050. The market is taking a pause before new impulses. Focus on 4030 and 3980...
Investors are closing positions before the end of the week and month, the reason being the uncertainty surrounding the deal with China and Powell's less dovish stance on policy: a 25 bp rate cut is already priced in. The probability of a December cut has fallen to 72.8% (from 91.1% a week ago). Powell emphasized that decisions depend on data, which is not available due to the shutdown.
The strong dollar (2-month highs) is putting pressure on gold. Weak data from China (PMI fell to 49.0) is reducing demand from the largest consumer.
The balance is tipping towards weak fundamentals...
Resistance levels: 4030, 4085
Support levels: 3982, 3955, 3915
Technically, bears are keeping the market below 4030 - strong resistance. If buyers enter the market (there are currently no fundamental reasons for this) and the bulls are able to break through 4030 and keep the price above this level, we will have a chance for growth. But under the current circumstances, I expect a correction to support before a possible rise.
Best regards, R. Linda!

ARDX – Double Rising Window Hints Bullish ContinuationARDX – CURRENT PRICE : 6.06
The stock has broken above its long-term downtrend line accompanied by strong volume (look at red arrow). This breakout was confirmed by the formation of a Rising Window (1), signaling the end of the previous bearish phase.
Another Rising Window (2) appeared recently, again on high trading volume, reinforcing bullish sentiment and indicating the likelihood of a continuation in the uptrend. Take note also that the RSI has climbed into bullish territory (above 50), suggesting a shift in momentum towards buyers’ control and further room for upside before reaching overbought conditions.
ENTRY PRICE : 5.80 - 6.10
FIRST TARGET : 7.00
SECOND TARGET : 8.00
SUPPORT : 5.11 (bottom of the Rising Window area)

EthereumEthereum's price was rejected at support at 3700, now in an uptrend heading towards the 0.5 Fibonacci level, favoring continuation of the long movement to the resistance at 4100.

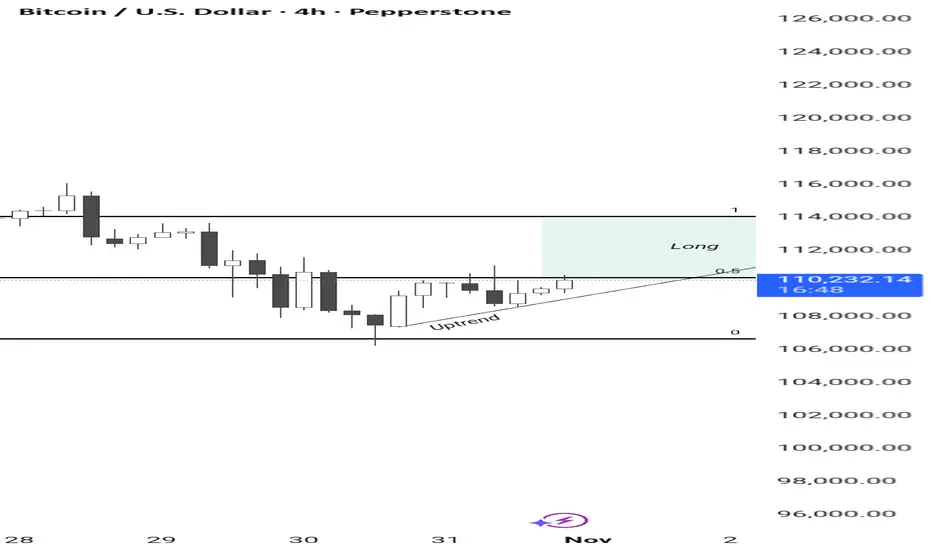
Bitcoin Bitcoin rejected the price at the support level of 107000, now in an uptrend at the 0.5 Fibonacci level, favoring a continuation of the long movement to the resistance at 114000.
critical 70k btc incomingbtc is looking extremely bearish with all indicators on negative divergence i doont see ant momentum and pass 120 we have topped on btc . if we go to 100k and dont hold we are going to btc go to next support around 70k

BTC DominanceBitcoin Dominance gives up 1 year after each halving. You should accumulate altcoin as long as Bitcoin dominance is above 50%.

Cardano - Realistic take4 separate times that RSI Divergence has occurred in oversold territory has hinted and displayed positive upside shortly after.
*Bullish Shark harmonic could be forming.
My current price to add more: ~.45 range.
No current TP at this time.

S&P Nearing Major Resistance (Update)This updates my previous S&P chart back last year showing the S&P still had room to run until any major resistance. We're nearing that major resistance at 7577. Looks like it might hit around January 2026.
The trouble is this trend is heating up and we needed a pullback to 6295. With all the excitement from Nvidia and other major Hyperscalers I'm worried it's going to just go straight to Major resistance. *If it does* we could be looking at a decently large pullback next year (finishing around August) down to that 6295 area and back into the supporting trend line for the next big uptrend to start.
If however we slow down here and get a pullback back to 6295 then I think we're good to make it over the major resistance without that big pullback next year.
Either way once we hit the major resistance at 7577 we'll need to get close to that lower trend line at some point to begin a new bull run.
Good luck and take caution as we approach this resistance!

GBPCHF signs of rising.GBPCHF got strong before market close today and broke the RESISTANCE. We will see when markets reopen if it is a real BreakOut or FakeOut for a continuing the Uptrend

GOLD (XAU/USD): Supply Zone Detected - Selling Now is HIGH RISKGold is retesting a key supply zone, which aligns with a recently violated horizontal support cluster and a rising trend line.
⚠️ HOWEVER —there’s a strong possibility that traders may aggressively sell, expecting a deeper bearish move.
For now, the price nicely respected the 3900 psychological support
that previously was a resistance.
Given the current setup, it’s best to avoid initiating short positions today.
Let’s hold off until the Fed Rate Decision announcement and observe how the market responds.

USD/CHF Coiled for November BreakoutThe Swiss Franc is back on the defensive this week, with USD/CHF up more than 1.2% in the wake of the Fed rate decision. The three-day advance has extended into technical resistance heading into the weekly and monthly close, and the focus now turns to a potential inflection off this key zone.
USD/CHF is trading within the confines of a proposed ascending pitchfork extending off the monthly lows. The break of the weekly opening-range on Fed-day extended into the 75% parallel with price now testing resistance at 8040- a region defied by the 100% extension of the advance off the monthly low and the April swing low. A topside breach / close above this threshold would expose the September / October swing highs at 8072/76. Strength surpassing this hurdle would be needed suggest that a more significant low is in place / a larger trend reversal is underway with subsequent resistance objectives eyed at the 100% extension of the broader September advance at 8120 and the August high / May low at 8172/85 (both levels of interest for possible exhaustion / price inflection IF reached).
Initial support rests with the August low-day close (LDC) at 8007 and is backed by the objective October open at 7964. Losses below this threshold would invalidate the near-term uptrend with a break / close below the July LDC at 7911 ultimately needed to mark resumption of the broader downtrend towards the yearly lows.
Bottom line: USD/CHF continues to coil within the broader September range, and the focus is on a breakout of this multi-week consolidation pattern. From a trading standpoint, a good zone to reduce long-exposure / raise protective stops- losses should be limited to 7964 IF price is heading higher on this stretch with a close above 8076 ultimately needed to fuel the next major leg of the advance.
-MB

All Priced In - Selling to CommenceFundamentals all baked in with price to sales ratio at previous 2021 post-covid highs will push to profit locking and selling pressure.
NASDAQ:GOOGL price target in the ~$230 range.
RSI weekly divergence and upper log line hit confluence with top fundamental ratios.
