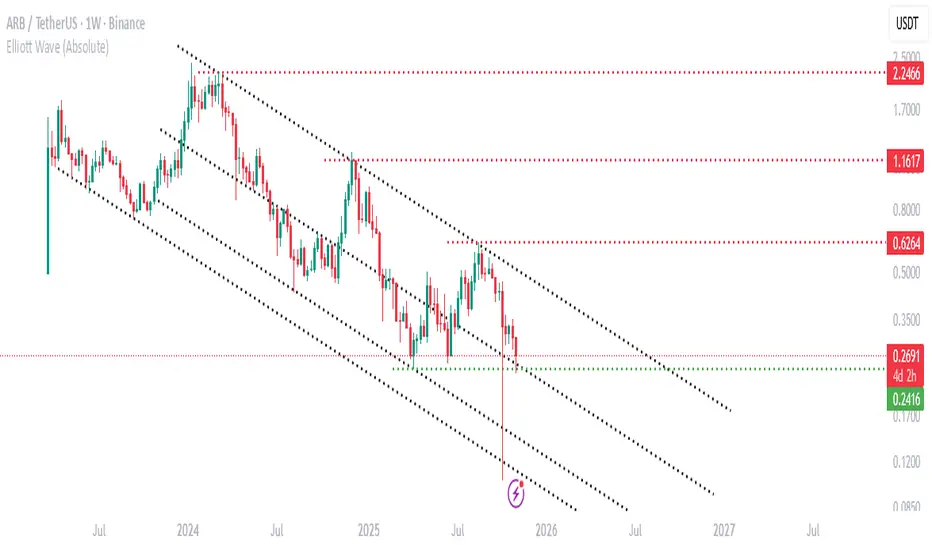
support and resistance in algousdt in ARBUSDTyou can see the suppert and resistance level on the chart
Trend Lines
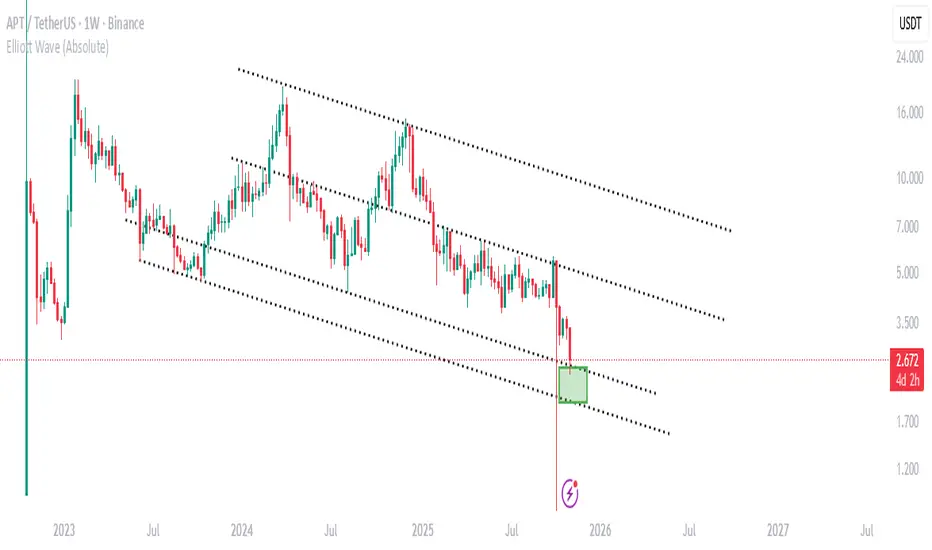
support and resistance in algousdt in aptusdtyou can see the suppert and resistance level on the chart
#ARPAUSDT #1D (ByBit) Chuvashov's fork breakoutARPA did a V-shaped recovery with great increase in volume and about to regain 200MA support.
Golden cross seems around the corner, looks very likely to rally mid-term.
⚡️⚡️ #ARPA/USDT ⚡️⚡️
Exchanges: ByBit USDT
Signal Type: Regular (Long)
Leverage: Isolated (2.0X)
Amount: 4.6%
Entry Targets:
1) 0.02233
Take-Profit Targets:
1) 0.03456
Stop Targets:
1) 0.01743
Published By: @Zblaba
$ARPA BYBIT:ARPAUSDT.P #1D #DeFi arpanetwork.io
Risk/Reward= 1:2.5
Expected Profit= +109.5%
Possible Loss= -43.9%
Estimated Gaintime= 1-2 months

GBP/USD Plunge Pauses at Support Ahead of BoEThe British Pound is showing signs of stabilizing after a six-day decline, with GBP/USD holding just above confluent multi-month downtrend support. While the broader bias remains tilted to the downside, the immediate focus is on a reaction from this zone for guidance into the November opening range.
GBP/USD trading within the confines of a descending pitchfork extending off the October 6 high, with price responding to support today at 1.3000/45- a region defined by the 2024 July high, September low-day close & November high and the 2025 March swing / close highs. The immediate decline may be vulnerable while above this threshold near-term.
Initial resistance is eyed at the October swing low at 1.3097 and is backed by near-term bearish invalidation at the 38.2% retracement of the yearly range and the November open at 1.3144/51. Ultimately, a breach / close above the July low-day close (LDC) at 1.3207 is needed to suggest a more significant low is in place / a larger reversal is underway.
A break below this key pivot zone exposes subsequent support objectives at the 50% retracement at 1.2944, and the 1.618% extension of the September decline at 1.2876- look for a larger reaction there IF reached. Losses below this threshold could fuel another accelerated bout of declines with the next major technical consideration seen at the 2024 yearly open / 61.8% retracement at 1.2731/45.
Bottom line: The British Pound is testing confluent support near the lower bounds of a multi-month downtrend- risk for some kickback here. From a trading standpoint rallies should be limited to the monthly open (1.3251) IF Sterling is heading lower on this stretch with a close below 1.30 needed to fuel the next leg of this decline.
-MB

CVX/USDT 4H AnalysisThe price is forming a round bottom pattern after touching the lower boundary of the descending channel.
Currently showing signs of reversal with increasing volume.
If price breaks above the midline of the channel, a move toward 2.20–2.25 looks likely.
Confirmation: 4H close above 2.00
Targets: 2.20 – 2.25
Support: 1.80
💡 Watching for breakout confirmation and volume continuation before entry.

NVIDIA STOCKS TECHNICAL DETAILS FOR AI STOCKS NVIDIA.
AFTER A RALLY COMES A CORRECTION TO KEEP A HEALTHY TREND.NVIDIA WEEKLY REJECTION LEVEL AT 213$ WILLHAVE THE FIB 0.382 (165.32$) DEMAND FLOOR WATCHED FOR POTENTIAL BUY.
THE NEXT DEMAND FLOOR IS 50% FIBONACCI 150.52$ A STRONG PSYCHOLOGICAL DEMAND FLOOR AND THE WEEKLY SMA 50 PROVIDING BUY BIAS. TO THE NEXT DEMAND FLOOR AT 150.52$ FOR NVIDIA .
FUNDAMENTAL OUTLOOK.
Reasons for Recent Stock Drop:
Concerns over valuation: The stock trades at a high forward P/E (~59x), raising worries about near-term growth sustainability.
Competitive pressures: Emerging competitors (e.g., AMD, Intel) and Chinese startups with cost-effective AI models (like DeepSeek) create market uncertainties.
Regulatory and geopolitical risks: US export restrictions on advanced AI chips may constrain NVIDIA’s international growth.
Profit margin pressure: Expectations of tighter profit margins due to accelerated rollout of new chip architecture (Blackwell).
Broader tech sector pullbacks driven by rising bond yields and inflation fears have also weighed on NVIDIA.
Overall, while NVIDIA's long-term outlook in AI remains positive, short-term market dynamics including valuation concerns and increased competition caused the stock to retreat after reaching highs near $213.
#STOCKS #NVIDIA

GOLD climbing.GOLD is starting to make it's way up in the NY session after news. Looking for new Higher Highs and Higher lows.

EURUSD 1D: bearish bias remains - trend break is confirmedEURUSD confirmed a break of the major daily trendline and failed to reclaim 1.1600. Buyers lost structure, every bullish bounce is absorbed. Market shows a clean shift to downside momentum.
Expect a corrective pullback into 1.1600–1.1700 (Fibo 0.382–0.5). This area remains the primary supply zone and ideal entry for continuation shorts.
Targets:
• 1.1407 — first liquidity zone
• 1.1389 — bearish continuation trigger
• 1.1150 — major demand zone and final target
Expectations vs reality: buyers hope for reversal, price structure signals continuation down. No guessing - trade what market prints.


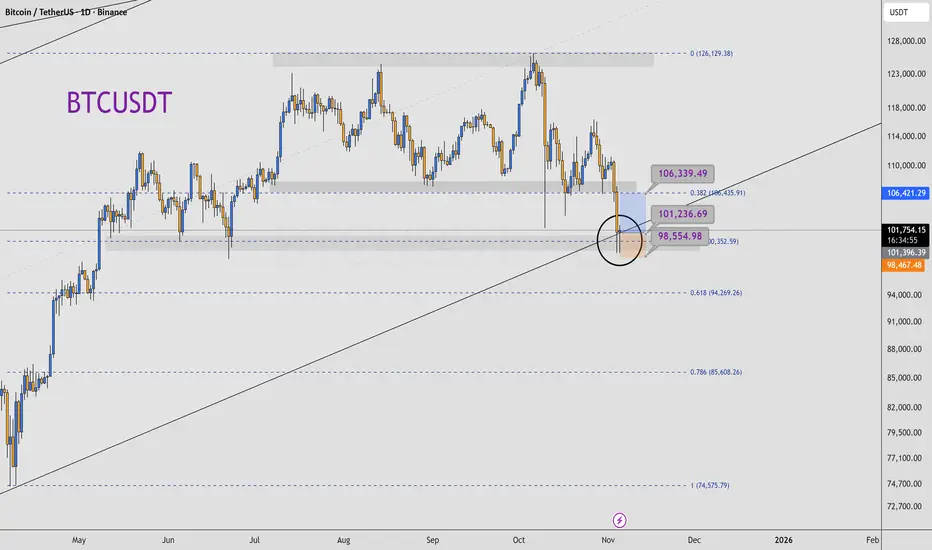
BTCUSDT scalpingBTC/USD – Intraday Scalping Setup
Bitcoin has respected the ascending trendline and the 0.5 Fibonacci retracement level, showing signs of holding short-term bullish structure.
After a sharp drop like the recent one, it’s common to see pullbacks or consolidation phases before the next major move.
For today, I’m looking for a scalping opportunity targeting the 105,000–106,000 area, which previously acted as a key support zone and could now serve as short-term resistance.
⚠️ This is a high-risk trade, as price remains in a corrective phase.
If BTC breaks below the trendline, we could easily see a move toward the 94,300 zone, where the next liquidity area lies.
Summary:
📈 Possible bullish scalping setup while above trendline
🎯 Target: 105,000–106,000
❌ Invalidation: Break below trendline
⚠️ Risk level: High – pullback scenario only
HTZ:From Breakdown to Breakout,Bullish Reversal Gaining TractionHertz Global Holdings, Inc. (NASDAQ: HTZ)
Technical Outlook: Potential Reversal Following Structural Breakout
Date : 5 November 2025
Summary
Hertz Global Holdings (HTZ) has exhibited signs of a potential medium-term trend reversal following a prolonged downtrend since mid-2023. Multiple bullish technical signals — including a breakout from key continuation patterns, RSI divergence, and sustained support retests — point toward a possible shift in market sentiment.
Price Action and Technical Developments
1. Downtrend continuation : Since July 2023, HTZ has been in a persistent downtrend, reinforced by a breakdown below major horizontal support.
2. Symmetrical triangle breakdown (Feb 2024) : The stock failed to hold within a consolidation structure, confirming bearish momentum at that stage.
3. Bullish divergence (Sept 2024) : Despite registering new price lows, the RSI formed higher highs, suggesting weakening downside momentum and potential for reversal.
4. Falling wedge breakout (Nov 2024) : Price action reversed from a classic bullish pattern, followed by a strong rally through the end of November.
5. Symmetrical triangle breakout (Apr 2025) : HTZ broke out of consolidation on elevated volume, coinciding with a break above the long-term descending trendline — a key technical inflection point.
6. Current setup (Nov 2025) : The share price is consolidating within a falling channel. On 4 November 2025, it rebounded from a confluence of supports — including the uptrend line from September 2024 and prior resistance turned support — reinforcing near-term bullish bias.
Trading Idea
Entry Zone: 4.71 - 5.50
Target: 10.50 and 15.00
Support: 4.71
Conclusion
After a long downtrend, HTZ is showing a clear shift in momentum. With multiple bullish patterns confirmed and strong support holding, the stock may be entering a new uptrend phase toward USD 10.50 and USD 15.00.

Solana Wave Analysis – 5 November 2025- Solana reversed from key support level 150.00
- Likely to rise to resistance level 175.20
Solana cryptocurrency recently reversed from the support area between the key support level 150.00 (which stopped the previous sharp downward correction (2) at the start of October), lower daily Bollinger Band and the two support trendlines from June and April.
The upward reversal from the support area stopped the impulse C-wave of the earlier ABC correction (2) from September.
Given the strength of the support level 150.00 and the oversold daily Stochastic indicator, Solana cryptocurrency can be expected to rise to the next resistance level 175.20 (former support from October).

GOLD | Gains Capped by Trade Uncertainty and Fed ExpectationsGOLD – MARKET OUTLOOK | Gains Capped by Trade Uncertainty and Fed Expectations
Gold futures rose slightly but gains remain limited as investors assess the U.S.–China trade deal and potential Fed rate cuts.
Market sentiment stays cautious, with traders awaiting key U.S. data for direction.
Below 4,025: Bearish bias toward 3,982 → 3,960 → 3,921.
Above 4,025: Bullish recovery toward 4,053 → 4,104.
Pivot: 4,025
Support: 3,982 · 3,960 · 3,921
Resistance: 4,053 · 4,080 · 4,104
Gold remains bearish below 4,025, but a confirmed break above 4,053 could shift sentiment to bullish in the near term.
PREVIOUS IDEA:

SNX : SIGNALHello friends
Given the good growth we had and the arrival of buyers, now that the price is correcting, there is a good opportunity to buy in steps with risk and capital management and move towards the specified goals.
*Trade safely with us*

TRUMP : SIGNALHello friends
Given the good growth we had and the entry of buyers, now that the price is correcting and a double bottom pattern has formed, there is a good opportunity to buy with risk and capital management and move towards the specified goals.
*Trade safely with us*

Steven–Bullish scenario activated after breaking the trendlineStevenTrading – XAUUSD
Bullish scenario activated after breaking the trendline
Hello everyone, StevenTrading is back with the latest update on the gold market.
After several consolidation sessions, gold has officially broken the downtrend line, confirming a short-term reversal signal – indicating that buyers are gradually regaining control of the market.
📰 Fundamental Analysis – News Impact
Gold prices surged as the prolonged U.S. government shutdown raised concerns about financial instability and triggered safe-haven demand.
In the European session on Wednesday morning, XAU/USD surpassed the $3,950 mark, supported by risk-averse sentiment and escalating geopolitical tensions.
These macroeconomic factors are further reinforcing the bullish technical pattern that StevenTrading has been monitoring in recent sessions.
📊 Technical Analysis – Trendline Break & Structure Shift
On the chart, gold has clearly broken the downtrend line, signaling a shift from a corrective phase to a new upward trend.
Currently, the price is reacting at the Fibonacci 2.618 level, which is a short-term resistance zone before the market makes a slight correction.
The overall structure shows a bullish continuation pattern, supported by newly formed Order Block (OB) and Fair Value Gap (FVG) zones on the M30 timeframe.
The optimal strategy now is to wait for the price to retrace to the OB/FVG zones to buy in line with the trend, rather than chasing after the breakout.
🎯 Trading Scenario (Action Plan)
🟢 BUY Scenario – Buy when price retests OB & FVG
Logic: After breaking the trendline, the price is likely to return to test the OB/FVG zones before continuing its upward move.
Entry: Buy 3970 – 3972
SL: 3965
TP: 3988 – 3998 – 4022
🔴 SELL Scenario – Short sell at liquidity sweep zone
Logic: A short-term liquidity sweep may occur around the Fibonacci 3.618 level before the price resumes its upward trend.
Entry: Sell 4007 – 4009
SL: 4015
TP: 4002 – 3992 – 3972 – 3958
📌 Steven's Note
The bullish structure has been confirmed, but the market is still in a liquidity hunting phase.
The most effective strategy now is to patiently wait for the price to retrace to the OB or FVG zones for a better entry, rather than rushing to buy at the breakout.

BTCUSDT.P : positionHello friends
Given the decline we had, the price has now made a good floor and is supported, but it is still early for confirmation. We must let the resistance break and form a higher ceiling for us.
Everything is clear and transparent. If you have any questions, ask.
Don't forget risk and capital management.
*Trade safely with us*

USNAS100 | Bearish Bias Holds Below 26,180 Ahead of Key DataUSNAS100 – MARKET OUTLOOK | Testing Pivot Zone, Awaiting Breakout 🇺🇸
The NASDAQ 100 is testing the pivot zone at 26,095–26,180, with momentum still bearish as long as it trades below this range.
🔽 Below 26,180: Bearish bias toward 25,890 → 25,700 → 25,340.
🔼 Above 26,180: Bullish reversal toward 26,500 → 26,850.
Pivot Zone: 26,095–26,180
Support: 25,890 · 25,700 · 25,350
Resistance: 26,320 · 26,500 · 26,850
USNAS100 remains bearish below 26,180, but a confirmed break above this level could signal the start of a new bullish leg.

SPX500 - Biggest Weekly Loss as AI Valuations Face ScrutinySPX500 – MARKET OUTLOOK | Biggest Weekly Loss as AI Valuations Face Scrutiny 🇺🇸
The S&P 500 posted its largest weekly loss in weeks as investors questioned high AI stock valuations and shifted toward safer assets.
The index remains under bearish pressure while trading below 6,770, with momentum favoring further downside.
🔽 Below 6,770: Bearish continuation toward 6,705 → 6,670 → 6,610.
🔼 Above 6,782: Bullish correction toward 6,814 → 6,842.
Pivot Zone: 6,755–6,765
Support: 6,705 · 6,670 · 6,610
Resistance: 6,798 · 6,814 · 6,842
SPX500 remains bearish while below 6,770, but a confirmed 1H close above 6,782 could trigger a short-term recovery toward 6,814–6,842.

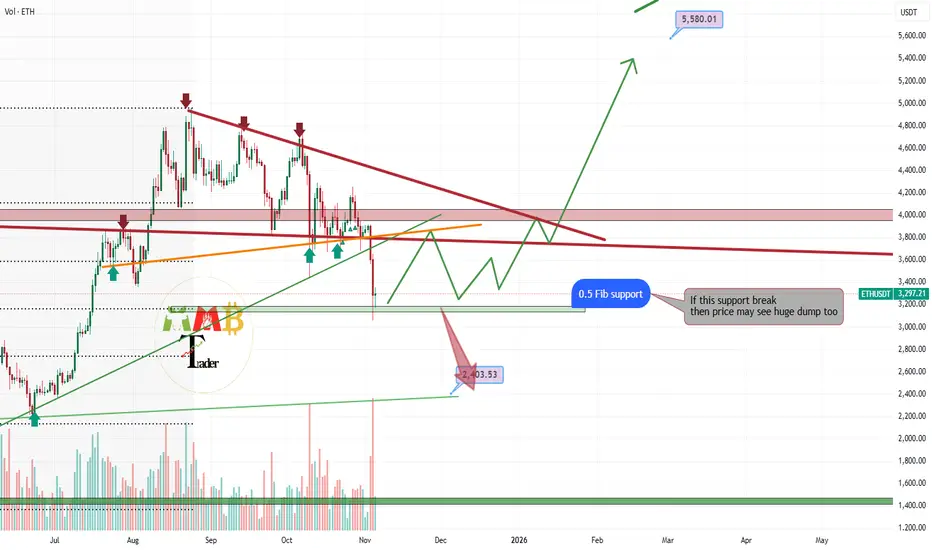
ETHUSDT is testing major Fibonacci support level now As the chart illustrates, ETHUSDT has completed a significant correction and is now testing a crucial technical level: the 50% retracement level of the Fibonacci sequence. This level often acts as a dynamic support zone in a strong trend.
A confirmed bullish rejection at this 0.5 Fibonacci support, evidenced by a strong reversal candlestick pattern, would signal that the correction may be complete. This would establish a high-probability setup for a resumption of the primary bullish trend.
In such a scenario, we would anticipate a strong bullish impulse, with an initial technical target projected toward the $5,500 level. This target is derived from the magnitude of the prior uptrend and represents a key resistance zone on the higher timeframes.
DISCLAIMER: ((trade based on your own decision))
<<press like👍 if you enjoy💚
NZDJPY near major daily support zoneThe chart analysis reveals a significant technical confluence, with price currently testing the first of two major daily support zones. This level represents a high-probability area for a potential bullish reversal based on classical technical principles.
In accordance with this setup, our strategy is to initiate and scale into long positions at the current level. This approach is based on the expectation of a technical bounce from this robust support confluence.
Provided these support levels hold and demonstrate buyer commitment, we anticipate a strong bullish impulse that would propel the price toward our primary technical targets. A successful hold here could indeed be the catalyst for a sustained upward move, exceeding our initial objectives.
DISCLAIMER: ((trade based on your own decision))
<<press like👍 if you enjoy💚

EURJPY the dump started -100pips done and soon -400pips hitOur analytical short position on EURJPY, which was provided as an educational resource, is progressing favorably according to the initial thesis. The trade is currently demonstrating a paper profit of approximately 100 pips.
The prevailing market structure continues to support our bearish outlook. We maintain our projection for a further downward move, with the primary objective remaining a total gain of 400 pips from the initial entry point. The position is well-positioned to capture this anticipated continuation of the bearish momentum.
DISCLAIMER: ((trade based on your own decision))
<<press like👍 if you enjoy💚

SLPUSDT to the moon scenario will soon play and start As consistently highlighted in our previous analyses, the chart for BINANCE:SLPUSDT indicates that the asset is now testing a critical confluence of support levels. This zone represents a significant daily and monthly low, historically acting as a major foundation for price.
A strong rebound from this pivotal area could initiate a substantial bullish impulse. The initial technical target for such a move is the $0.003 level, which aligns with the last key resistance zone visible on the higher timeframes. A rally to this level would constitute an approximate +200% appreciation from the current price.
Furthermore, a decisive breakout and sustained close above the $0.003 resistance would be a significant technical development. This would invalidate the major resistance structure and likely catalyze a further continuation of the bullish trend, opening the path for more extensive gains.
DISCLAIMER: ((trade based on your own decision))
<<press like👍 if you enjoy💚
