Critical Retest: Can the Uptrend HoldMarket Overview
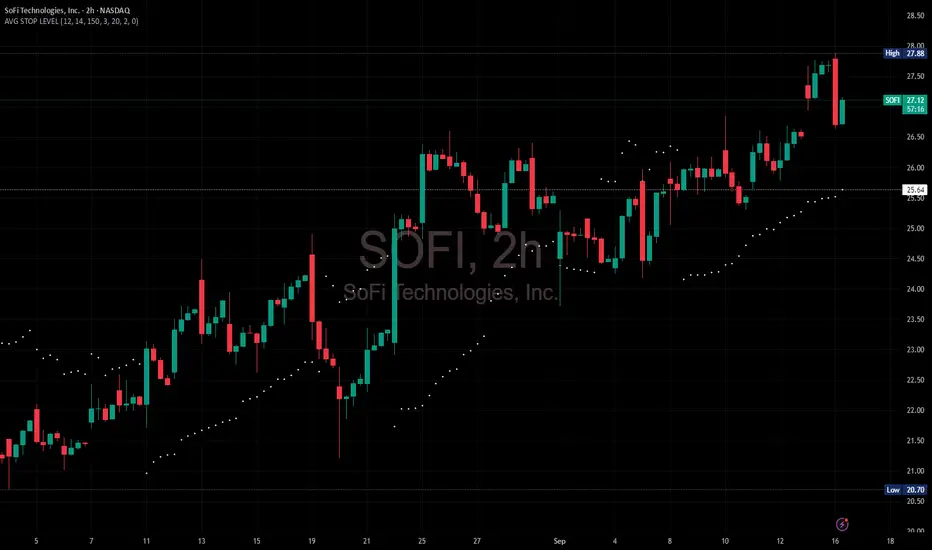
The broader price structure clearly remains in an uptrend. However, a short-term bearish formation recently developed but was quickly invalidated as the market reversed into bullish momentum again on Friday.
Before the market closed, price retraced to retest the breakout level. If it can hold above this area and establish a higher structure, the uptrend is likely to continue until the trend shows signs of exhaustion. Conversely, if the retest fails and price breaks back below the ascending trendline, the market may enter a sideways consolidation phase, potentially forming a corrective pattern before the next decisive move.
Trendlineanalysis

Gold – patience versus greedThe current rise in gold to the 3640–3650 range resembles a protracted consolidation rather than a confident trend. The price remains within the upward channel, but there is a risk of correction accumulating near the current values. Key levels to watch are 3629 and 3618: a break and consolidation below will open the way to 3575, where important support lies. Within the range, the market is behaving nervously – false breaks are becoming commonplace, which increases uncertainty for those who are rushing into positions.
Fundamentally, pressure on gold is being driven by expectations ahead of the Fed meeting and weak dollar statistics: investors remain in “wait-and-see mode.” While the dollar is correcting in a downtrend, gold is receiving support, but without new catalysts, an upward breakout is unlikely. Rather, the market is looking for a balance of forces to determine who will lead - buyers or sellers.
The tactical plan boils down to not playing guessing games. In the event of a decline below 3618, confirmation of the bearish scenario with a target of 3575 will appear. If buyers keep the price above 3640, another attempt to storm the highs is likely. At such moments, it is important not to try to outsmart the market, but to wait until it shows the direction itself.
Sometimes the best trade is simply not to rush.

US30: Rebound to resistance & continue to break down
📝 1. Market Context
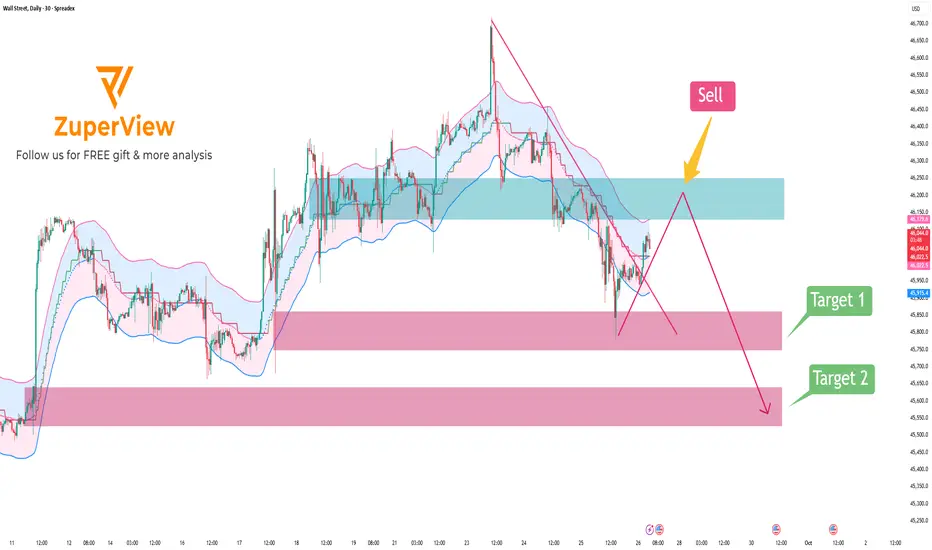
The SPREADEX:DJI dropped sharply from the recent high around 46,700 down to near 45,700, showing that sellers are currently in control in the short term. After this sharp decline, price is experiencing a mild recovery but still remains within a clearly defined downtrend channel and below key resistance.
🟥 2. Resistance Zone
The major resistance is located around 46,250 – 46,130 (highlighted in blue on the chart):
• This zone overlaps with the EMA and the upper band of the Keltner Channel.
• It was previously a sideways consolidation area that has now turned into resistance.
• It also intersects with the descending trendline, making a bearish rejection likely.
🟩 3. Support Zone
The nearest support lies at 45,858 – 45,748 (first pink zone).
If price breaks below this level, it is likely to continue falling toward the lower support zone at 45,520 – 45,640 (second pink zone).
🚨 4. Bearish Scenario
• Main scenario: Wait for a price pullback into the 46,250 – 46,130 area and watch for bearish signals → then SELL.
• Target: First target at 45,860 – 45,750 → if broken, expect further decline toward 45,520 – 45,640.
• Invalidation: A daily close above 46,250 would invalidate this bearish setup.
Please like and comment to support our traders. Your feedback motivates us to produce more analysis in the future 🙏✨
Moving to the Day's resistanceDaily (D1)
The overall trend is clearly bullish. There has been an upside breakout on the daily timeframe, which could potentially mark the end of wave 3. Price is now consolidating in what looks like a sideways correction, likely forming wave 4.
H1
Price has rebounded from the daily support (lower range of the sideways zone). As long as the short-term uptrend on H1 holds, price should be able to test the upper boundary of the range without much difficulty.
m15
Not the best setup for buying at the moment, since price is already close to the daily range resistance. A valid buy could be considered only if a breakout occurs followed by a retracement with a favorable risk–reward setup.
For selling, it’s better to wait until a clear downtrend structure forms rather than attempting to counter-trade prematurely.
Summary
Price is moving within a range until either a breakout or a clearer correction structure develops. Possible approaches are:
Trade the range (buy near the lower boundary, sell near the upper boundary).
Or wait for a breakout and confirmation of continuation before entering.

Shriram Finance at Crossroads: Breakout or Breakdown..?
* CMP: ₹633
* Resistance: ₹640 (important barrier)
* Support: ₹630 (trendline + price support)
* Trend: Short-term uptrend
---
🔼 Bullish Scenario
* If price breaks and sustains above ₹640, it may extend the uptrend.
* Upside targets:
* 🎯 ₹648
* 🎯 ₹655
🔽 Bearish Scenario
* If price breaks below the trendline and loses ₹630 support, downside pressure likely.
* Downside targets:
* 🎯 ₹624
* 🎯 ₹620
📌 Conclusion
* As long as ₹630 holds, buyers have control.
* A breakout above ₹640 will strengthen the bullish case.
* A breakdown below ₹630 shifts sentiment bearish, opening room for deeper correction.

EURUSD to return bullish as it gets closer to 1.17000EURUSD is revising the bullish trendline level and is expected to continue its bullish move from there onwards.
DXY also remain bearish despite the heavy correction.
Please watch the video and let me know your thoughts.

Gold is showing BULLISH structure, BEARISH is short-term 📊Trend Analysis
🔤After the strong rally from 3640 → 3700, price created multiple BOS, showing bullish structure.
🔤However, after tapping the supply zone 3690 – 3700, a bearish CHoCH appeared, signaling that sellers are gaining short-term control.
🔤Currently, price is testing the 3650 – 3655 demand zone and bouncing, showing short-term buy pressure.
🔤But the supply zones above (3670 – 3680) and (3685 – 3695) remain unmitigated, likely to act as strong resistance for a continuation down.
💡Trade Plan
🔽Scenario 1 – Short from supply
Entry: 3670 – 3680 (Supply + FVG)
Condition: Wait for bearish confirmation (CHoCH/BOS on M5–M15).
Reason: Market bias is bearish; supply zones above are strong short entries.
🔼Scenario 2 – Buy from deep demand
Entry: 3635 – 3640 (Demand + FVG)
Condition: Bullish BOS on lower timeframe.
Reason: Key demand zone where buyers could defend strongly.
🔽Scenario 3 – Break & Retest Short
If price breaks 3635 with strong bearish candle → wait for retest 3635 – 3640 to short.
Reason: Weak buyers, liquidity sweep toward lower zones.
➡️ Short-term bias is leaning bearish, but the 3635 – 3640 demand zone will be the key decision point—either price bounces for a bullish correction or breaks lower for further downside.

GBPUSD1H Short Call
GBPUSD
Support Break (which earlier was stong resistance now was acting as support on confirmation
Short trade Is valid)
Manage your risk and rewards
📊 Key Data Just Released: US UN-Employement Claims
FUNDAMENTALS:
Unemployment Claims: 231K (better than forecast 241K, and much better than 264K prior) → labor market stronger.
Philly Fed Manufacturing: 23.2 (blowout vs 1.7 forecast, -0.3 prior) → economic activity hotter.
👉 This means:
Labor market is not weak, economy looks stronger than expected.
So the 25 bps cut last night will be seen as normal easing, not aggressive.
Aggressive cut scenario is off the table for now, unless Fed signals future cuts.

GOLD COME BACK BULLISH TREND AROUND 3660 - 3690 📊 Previous Trend
Price showed strong bullish momentum, forming a BOS around 3660 – 3690, confirming bullish structure.
📊 Reversal Signals
After tapping the 3690 – 3700 zone, a strong rejection candle appeared with heavy selling pressure → clear sign of price rejection at highs.
A bearish FVG formed at 3670 – 3675, suggesting further downside correction.
Price is currently retesting this FVG and showing bearish reaction.

Demand Zone Rejection vs. Trendline Breakout📚 Trading Education:
Demand Zone Rejection vs. Trendline Breakout Entries
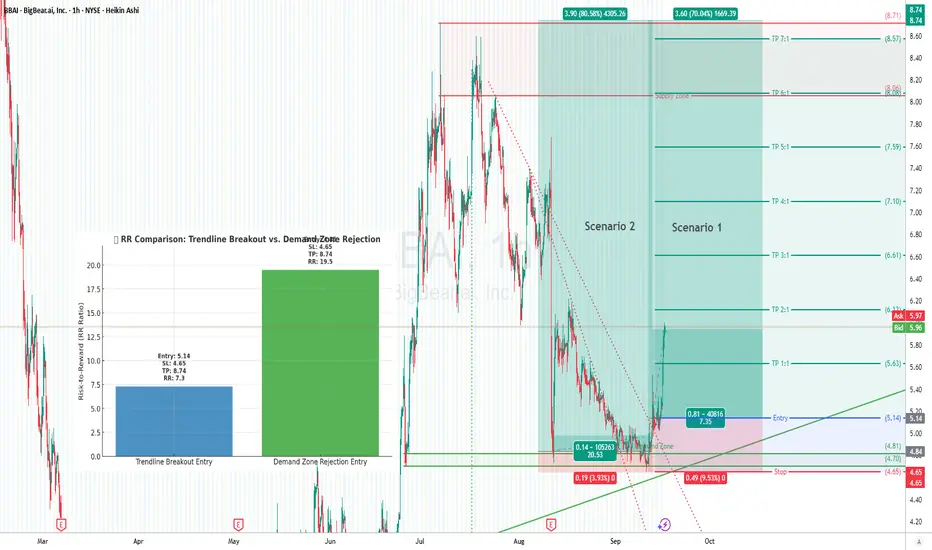
In trading, where you enter makes a massive difference in your Risk-to-Reward (RR) ratio. Two common approaches:
🔹 Scenario 1: Entry at the Trendline Breakout
Wait for confirmation → price breaks the downtrend line.
Entry: $5.14
Stop Loss: $4.65 (below demand)
Risk: 0.49
Target: $8.74
Reward: 3.60
RR = ~1:7.3
✅ Higher probability (confirmation from breakout).
❌ Smaller RR because you’re entering later.
🔹 Scenario 2: Entry at the Demand Zone Rejection
Enter aggressively on the first demand zone bounce.
Entry: $4.85
Stop Loss: $4.65
Risk: 0.20
Target: $3.90 upside → $8.74
Reward: 3.90
RR = ~1:19.5
✅ Insane RR potential.
❌ Higher risk of fakeouts (price might pierce deeper before breakout).
The Takeaway
Breakout Entry = safer, confirmed, good RR (~1:7).
Demand Rejection Entry = aggressive, riskier, but monster RR (~1:19).
👉 The best traders scale in: small position at demand, add on breakout. That way you capture the high RR edge while also waiting for confirmation.
⚖️ Risk Management Rule
Always risk just 1–3% of account equity.
Huge RR setups don’t mean overleveraging — stick to risk discipline.
"Opportunities come infrequently. When it rains gold, put out the bucket, not the thimble." – Warren Buffett
Mastering the Edge: How Risk and Leverage Shape WinnersIn my last post, we discovered how expectancy works like a compass — giving us direction and helping us see the road ahead of our trading account. But a compass alone won’t move you forward. To actually get anywhere, you need an engine.
And that engine is risk management.
Many traders spend years looking for the “perfect” trading system, only to ruin it by stepping too hard on the gas. They don’t blow up because their strategy was flawed — they blow up because their risk was.
Risk per Trade: The Accelerator and the Brake
Think of risk per trade as the pressure you put on the accelerator. Risk too little, and your system barely moves. Risk too much, and you spin out of control.
When you risk a fixed fraction of your account, every trade slightly changes the size of the next one. This creates compounding — the same principle that builds fortunes when handled with care, but wipes accounts when abused.
The key takeaway is simple: risk is the throttle of your system. Push it wisely.
Drawdowns: The Valleys You Can’t Avoid
Every journey has valleys and peaks, and trading is no different. A drawdown is simply the distance between your highest equity peak and the valley that follows.
It’s not something you can avoid. Every trader, no matter how skilled, will walk through valleys. What matters is how deep they go — and whether you can climb back out. The bigger your risk per trade, the deeper those valleys will be.
Leverage: The Amplifier
Leverage doesn’t change your system; it amplifies it. It’s like turning up the volume on your speakers. A little more volume makes the music clearer. Too much, and the sound distorts, eventually blowing out the speakers.
In trading, leverage multiplies your effective risk. That means it can quickly push you beyond the “sweet spot” where your system grows steadily, into a dangerous zone where volatility eats away at your gains.
The point is not to avoid leverage altogether, but to respect it. Used wisely, it enhances your edge. Used carelessly, it magnifies every weakness until it breaks you.
Risk of Ruin: The Hidden Monster
Even with a profitable edge, there’s always a monster lurking in the shadows: risk of ruin.
In simple terms, risk of ruin is the probability that you’ll blow up your account before your trading edge has enough time to show itself. It’s not about whether your system works — it’s about whether you survive long enough to let it work.
Here’s the practical catch: leverage amplifies both your gains and your losses. And because losses are inevitable, leverage makes your drawdowns deeper. The real question every trader should ask is: will this amplified drawdown knock me out of the game too soon?
That’s why using leverage wisely is non-negotiable. Even a solid system can collapse if pushed beyond its limits. The trade-off is clear: grow steadily but safely, or chase faster growth and risk snapping the system in half.
Now, for those who like to peek under the hood, there is actually a scientific way to estimate the “sweet spot” for risk and leverage. Traders and mathematicians call it the Kelly Criterion. In this post we don’t go into formulas, but if you want to see the numbers, the simulations, and even play with your own scenarios, you’ll find a complete Python notebook in this GitHub repo (github.com).
Bringing It All Together
A trading system with an edge is like a powerful engine. But without managing the fuel (risk), the throttle (leverage), and the terrain (drawdowns), even the best engine can explode before reaching its destination.
This is why risk management isn’t just a technical detail — it’s survival. And here’s the truth: every profitable trader in the world, whether they know it or not, follows these principles. Some arrive at it through mathematics and statistics, others apply it intuitively. What outsiders often call “the touch” or “the magic” of a great trader is nothing mystical at all — It’s nothing more than the consistent application of probabilistic thinking, whether done consciously or unconsciously.
Strip away the charts, the buzzwords, and the noise, and you’ll always find the same foundation underneath: probability, expectancy, and risk control. Apply them consciously with tools and simulations, or apply them instinctively — either way, they are the invisible framework that separates survival from ruin, and consistency from chaos.
And if you want to see this foundation in motion, not as abstract ideas but as living numbers and scenarios, the GitHub notebook is there for you. It’s a way to pull back the curtain and watch how expectancy, Kelly criterion, leverage, and drawdowns truly shape the future of your trading account.
Gold Futures Day Trade Long EntryDont have enough time to go too into details on this one.
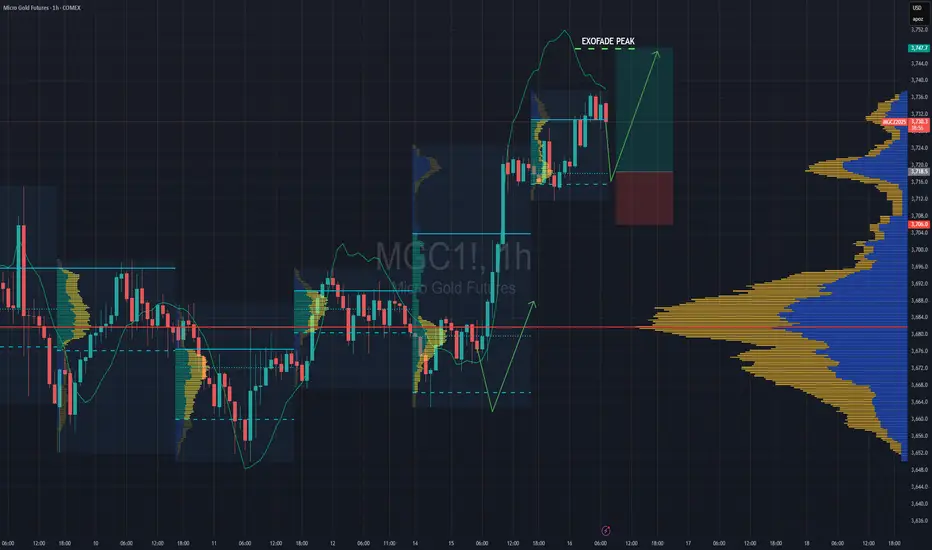
-Trade entry is based on Session Volume profile
- LVN on Visible range profile
- Entry at VAL - will likely get triggered during NY session today
- Weekly & Daily VWAP levels
Enjoy !!
EUR/NZD – Trendline Broken, Bears Warming UpAfter touching the psychological 2.00 handle once more at the end of August, EUR/NZD started to fall. Last week, the pair finally broke below the rising trendline that had been intact since June — a technical signal that momentum is shifting.
Following the recent low at 1.9627, the pair is now in a normal rebound. But rebounds after a trendline break are often just pauses before continuation. Once this corrective move is complete, I expect fresh downside pressure to return.
My trading plan:
• Look to sell rallies into resistance.
• Expect at least a 500-pip decline, targeting the 1.9200 support zone.
• The bearish scenario remains valid as long as price stays below 1.9950.

NZDUSD Demand Zone SetupThis is a high probability trade if prices comes down as it broke a significant trendline with a change in structure

Price Reacting at Supply ZoneMarket is bearish and came back up to supply zone so we will wait for break of structure and to go short

XAUUSD – Can Gold Extend Towards New All-Time Highs?XAUUSD – Can Gold Extend Towards New All-Time Highs?
Good day Traders,
During today’s Asian session, gold once again demonstrated solid buying interest. A confirmed break above 3658 would mark a significant resistance level, reinforcing the case for further continuation of the bullish trend.
Technical Outlook
The Fibonacci 2.618 extension has already produced a reaction, though in my assessment, liquidity in this zone has not been fully exhausted. This raises the prospect of another upward move to complete the liquidity sweep before any meaningful correction unfolds.
Given that today is Friday, a corrective pullback remains possible, as the market may look to rebalance flows and close the weekly candle at a comparatively lower level.
On the downside, a sustained break below the 3613 support would provide clearer confirmation of bearish momentum developing.
Trading Considerations
Selling Zone: Around 3688 (Fibonacci 2.618). A protective stop of approximately 6 dollars is advisable.
Buying Zone: Around 3558, with a suggested stop of roughly 8 dollars. This area offers potential for a more extended upward move in line with the broader trend.
Alternative Scenario: Should price close decisively beneath 3613, immediate short exposure would be justified as downward momentum takes hold.
This is my current outlook on gold for today. Traders are encouraged to align this perspective with their own analysis and apply disciplined risk management.

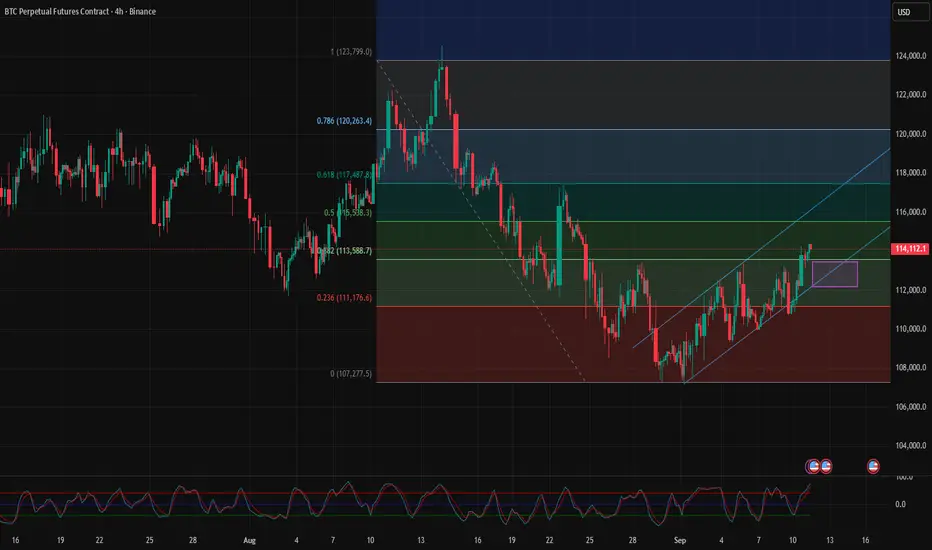
Bitcoin – Trend Update Ahead of PPIBitcoin – Trend Update Ahead of PPI
Hello Traders,
The current picture for Bitcoin is unfolding broadly in line with expectations, with the uptrend continuing to build momentum. Price movements are backed by solid volume, and the overall structure is developing as anticipated.
Key Levels
The price has cleared the 113k area, confirming that the bullish trend remains intact. This strengthens the probability of completing the final leg of the inverse head-and-shoulders pattern.
The next area to monitor is around 116k, where a modest reaction or short-term pullback could occur before the trend resumes towards the 121k region.
Close attention should be paid to the 117k level, as this represents the potential completion of the inverse head-and-shoulders structure. At this point, price may consolidate before establishing a fresh primary trend.
Trading View
For the moment, it remains important to follow the prevailing uptrend. Any shift in market structure will call for re-assessment, with updated strategies to be applied only once clear confirmation emerges.
This is my latest outlook on Bitcoin ahead of the PPI release. I trust this perspective will assist in shaping your trading approach.

Don't miss the final BTC Rocket of this cycle !!!When it dips, get ready to jump in! BTC is about to moon this cycle 🚀 See you at $124k!
No more retesting $104k — even breaking below $107k looks tough now. Get ready to ride the final wave of this cycle!!! 💰
If you don’t have any position yet, now's a good time to enter your first one. BTC just broke through the legendary EMA200.
As for me, I’ve been buying and selling along the way, locking in profits during this uptrend.
Spot portfolio’s running, options are live, and the futures with x20 leverage — I’m running it, but trying not to get too reckless 😛
For those already holding — stay strong and enjoy being rich.
#BePatientStayCalm #LifeHackTrader
XAUUSD – Latest Trend UpdateXAUUSD – Latest Trend Update
Good day Traders,
Gold has so far unfolded in line with yesterday’s projection: following a corrective pullback towards 3660, price has resumed its decline and is currently maintaining a bearish tone. Should this structure be confirmed on the higher timeframes such as H1 and H4, it may indicate that a broader corrective phase on the daily chart (D1) is underway.
Key Levels of Interest
3620: Established as an important support yesterday, this level is now regarded as the key marker for confirming continued downside momentum.
3630: Coincides with the lower boundary of the ascending channel, where a reaction could still develop before direction becomes clearer.
Medium-Term Outlook
A decline towards 3550 is anticipated, from which a rebound could follow – this represents the preferred medium-term scenario.
A deeper retracement to 3510 is also possible, where liquidity from previous candle wicks may be absorbed before the longer-term uptrend resumes on the daily timeframe.
This expectation of a corrective move is supported by the fact that price has already reached the Fibonacci Extension 2.618, often a sign of exhaustion in the prior leg.
Trading Approach
Monitor the 3630 – 3620 – 3610 zones for potential long opportunities in line with the broader bullish structure.
Short positions should only be considered if price delivers a decisive close beneath 3620, thereby confirming renewed downside pressure.
This is my current outlook for gold today. Please use it as a guide alongside your own analysis and risk management.

XAUUSD – Outlook Ahead of PPI ReleaseXAUUSD – Outlook Ahead of PPI Release
Good day Traders,
Gold recently advanced towards the Fibonacci 2.618 extension before meeting resistance and reacting lower. Price has also broken through the most recent minor low within the upward structure, which, in my view, represents a violation of the prevailing bullish trend. A further leg would still be required to establish a durable reversal structure, yet the case for a bearish bias is already forming.
Fundamental Context
Later today, the US PPI data will be released. Expectations are for 0.3%, down from 0.9% previously. Should the forecast materialise, gold could extend higher in the short term. However, I believe the figure may not prove as weak as projected, and therefore it is prudent to monitor the market’s response to the data before committing to fresh positions.
Technical Levels of Interest
3660: A potential retest of this zone could provide another reaction and may represent the most attractive level to initiate short exposure.
3318: If gold confirms a lower structure in line with Dow theory and decisively breaks beneath prior support, the market could extend towards this deeper downside target.
Trading Approach
The preferred strategy for today is to seek selling opportunities:
Ideal entry: around 3660, should price retest and reject the level.
Strong confirmation: a decisive candle close beneath old support would validate further downside and provide a clear short entry.
Short-term traders may also consider scalping within the corrective range created during yesterday’s US session, as the market redistributes price action.
This is my perspective on gold for the day. Traders should use it as a guide and align it with their own analysis and risk management.

Bitcoin – Current Trend UpdateBitcoin – Current Trend Update
Good day Traders,
Bitcoin continues to respect the structure of an inverse head-and-shoulders formation, which remains intact at this stage. Following a test of the 113.5k region, price once again reacted lower – this marks the third rejection from this level, highlighting its importance as a pivotal zone. For the bullish momentum to extend and complete the final wave of the formation, this resistance must eventually be overcome.
Scenarios to Monitor
Bullish Scenario: The upward bias remains valid while price holds above 109k. In this context, long positions remain the preferred approach.
Bearish Scenario: Should price sustain a break beneath 109k, the bullish case would be invalidated and a bearish outlook activated. Confirmation will be required before considering such positions.
Short-Term Dynamics
On the intraday timeframes, BTC is trading within a sideways channel. For short-term participants, range-based strategies such as buying near support and selling into resistance may remain effective until a decisive breakout occurs.
Market Context
At present, broader market attention is focused more heavily on gold rather than Bitcoin. As a result, BTC may continue to consolidate within a narrower range, requiring traders to temper expectations for immediate volatility.
This represents my current outlook for Bitcoin. Traders are encouraged to use this as a reference and compare it with their own perspectives.

GBPCAD Trendline Sell IdeaWith the RSI at 64.84, an overbought level, and the current price at the upper trendline. Hence, based on these conditions, I anticipate a sell on the GBPCAD currency pair.

Bitcoin – Short-Term Trend OutlookBitcoin – Short-Term Trend Outlook
Good day Traders,
Bitcoin continues to demonstrate a constructive short-term uptrend, whilst remaining within a corrective structure on the medium-term timeframe.
Chart Structure
A double-bottom pattern has now completed and confirmed, providing a base for the current move.
From a broader perspective, price action may be shaping a potential inverse head-and-shoulders formation, with the present wave contributing to its development. The pattern would be validated should price advance back towards the 117k region.
Elliott Wave Perspective
From an Elliott Wave standpoint, the current structure suggests that wave C remains incomplete, indicating scope for further upward movement.
MACD & Volume Analysis
MACD signals, supported by trading volume holding above the average line, highlight continued buying pressure, reinforcing the bullish outlook.
Trading Considerations
Upside remains favoured.
The 111k level is highlighted as an attractive intraday buying zone. The probability of success increases if price rotates further into the rising trendline, aligning with the broader bullish structure.
Final Thoughts
Overall, the technical landscape continues to support a bullish bias for BTC in the short term. Close attention should be paid to reactions around the 111k level and along the rising trendline to refine entry timing. This analysis reflects my current view of the market, and traders are encouraged to compare with their own perspectives.
