Eurchf potential trend line bounceEurchf has approached a strong Hourly ascending trend line....coupled with the confluence of a demand zone, a strong bullish reaction may occur on the pair...
Like and subscribe.
Trendlinebounce

Long EurcadAm going long on this pair at a confluence of a trend line and a demand zone.
Looking for a modest 3.28R....
Pls like and subscribe.

7203:TASIRespecting Trendline Support
Bullish Trend with series of HH and HL
Possible Breakout of Symmetrical Triangle
Enjoy the ride with trailing stop loss

Long EURNZDEurnzd is at a very strong trend line and also at a confluence of a demand zone.
Am going long here for about 3.95R....Like and Subscribe....thank you.

EURUSD ! May show growth in the short term, long trade ideaEURUSD continues to fall due to DXY increase. EURUSD is supported by a strong support line and seems to bullish form. Several times in the past, this trend has shown support and up. If EURUSD can hold in the area of 0.96300~0.96000, it is expected that the up will continue.
Don't forget TREND IS BEARISH.

USOIL ! Is this the end of the oil down ? long trade idea.Oil prices have fallen in last few weeks, but the bullish trend continues for a long term. If USOIL get shows a support at the level of 74.20 and bullish forming, I open long trade.
Why oil is still bullish ?
1. World oil production rose 790 kb/d in August to 101.3 mb/d, with a strong recovery in Libya and smaller gains from Saudi Arabia and the UAE offset by losses in Nigeria, Kazakhstan and Russia. From August through December, growth is forecast to slow, edging up by just 280 kb/d to 101.6 mb/d. In 2022, global production is forecast to rise by 4.8 mb/d, to 100.1 mb/d, and by 1.7 mb/d in 2023 to 101.8 mb/d.
2. Geo-political events
The geopolitics of oil and gas can be viewed as resulting from the balance between supply and demand, which affects the power dynamics between energy exporters and importers, energy security, and the military strength of major powers

EURNZD POSSIBILITY FOR A LONG. TRENDLINE BOUNCEWe have a retest of Trendline. Looking for LONG posibilities to 1.7100

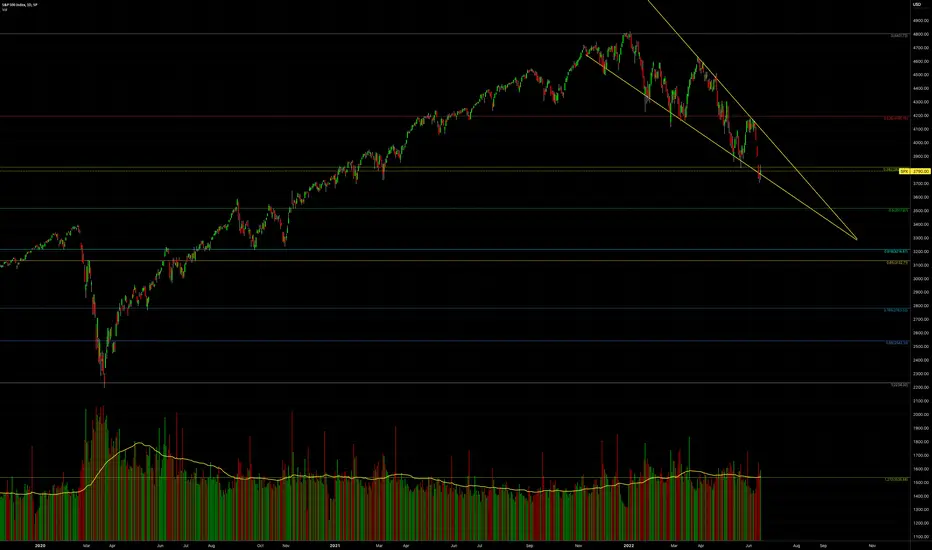
SPX500 ready for for new lows?Evening traders. Ive been watching the spx500 for quite sometime now. If you look and my chart the price has bounced off the trend line quite a few times. I was expecting to see price move in between both trendlines, squeeze and push either upwards or downwards.
As per my strategy my sell signals have triggered which are all highlighted in red. RED cloud formed. crossover. lagging span broke the cloud and price closed below cloud. However as you can see the highlighted yellow area the market has been volatile and could take an unsuspected upwards move. It could be a trap to trigger positions, push back to the lower trendline or even hit the cloud again and then hit lows at 3639 - 3548.
I am following my strategy though and I will be placing a trade in the next few days.
As always trade safe
cheers

BITCOIN TRADE IDEA - LONGWe are looking at a possible LONG with Bounces of Trendlines. H4 Candle Pattern will be good at this point or any reversal patterns you enjoy. Long Holds as long as Low Point A is not taken out.

EURNZD POSSIBLE SWING SHORTWe have a Bounce at a Long Term Trendline. Looking to short the pair on Confirmation. Current Up Trendline Break and Retest

Gbpjpy longs...Confluence 4H support of demand level and trend line.....am going in for 3.01R.....Like and Subscribe..

Nzdusd shorts...A small cute head and shoulders appeared on the 15min at a 4H resistance confluence..... Am diving in for the shorts on brk and retest.......5.26R.....like and subscribe

NYT: Fighting the Fed?!New York Times Co
Short Term - We look to Buy at 29.68 (stop at 27.17)
Although the bears are in control, the stalling negative momentum indicates a turnaround is possible. Trend line support is located at 29.60. Support could prove difficult to breakdown. We therefore, prefer to fade into the dip with a tight stop in anticipation of a move back higher. Although the anticipated move higher is corrective, it does offer ample risk/reward today.
Our profit targets will be 35.79 and 39.00
Resistance: 35.90 / 47.50 / 56.00
Support: 29.30 / 22.00 / 16.00
Please be advised that the information presented on TradingView is provided to Vantage (‘Vantage Global Limited’, ‘we’) by a third-party provider (‘Signal Centre’) . Please be reminded that you are solely responsible for the trading decisions on your account. There is a very high degree of risk involved in trading. Any information and/or content is intended entirely for research, educational and informational purposes only and does not constitute investment or consultation advice or investment strategy. The information is not tailored to the investment needs of any specific person and therefore does not involve a consideration of any of the investment objectives, financial situation or needs of any viewer that may receive it. Kindly also note that past performance is not a reliable indicator of future results. Actual results may differ materially from those anticipated in forward-looking or past performance statements. We assume no liability as to the accuracy or completeness of any of the information and/or content provided herein and the Company cannot be held responsible for any omission, mistake nor for any loss or damage including without limitation to any loss of profit which may arise from reliance on any information supplied by Signal Centre.

HDFCLIFE is testing the trendline HDFCLIFE is testing the trendline u can go LONG (BUY) and do swing trade...and stoploss at ₹547 target at ₹617

BIRLASOFT is testing trendlineBIRLASOFT (INDIA) - BSOFT is tested the trendline and formed a triangle...triangle is breaked up yesterday (23.06.2022) and hammer candle is formed we can go LONG (BUY)...stoploss at ₹342 and target at upper trendline

PLTR:Very close to trend line!Palantir Technology
Short Term - We look to Buy at 9.19 (stop at 7.55)
Although the bears are in control, the stalling negative momentum indicates a turnaround is possible. Trend line support is located at 9.00. Support could prove difficult to breakdown. Dip buying offers good risk/reward. Further upside is expected.
Our profit targets will be 12.96 and 14.00
Resistance: 13.00 / 16.00 / 24.00
Support: 9.00 / 6.60 / 4.00
Please be advised that the information presented on TradingView is provided to Vantage (‘Vantage Global Limited’, ‘we’) by a third-party provider (‘Signal Centre’). Please be reminded that you are solely responsible for the trading decisions on your account. There is a very high degree of risk involved in trading. Any information and/or content is intended entirely for research, educational and informational purposes only and does not constitute investment or consultation advice or investment strategy. The information is not tailored to the investment needs of any specific person and therefore does not involve a consideration of any of the investment objectives, financial situation or needs of any viewer that may receive it. Kindly also note that past performance is not a reliable indicator of future results. Actual results may differ materially from those anticipated in forward-looking or past performance statements. We assume no liability as to the accuracy or completeness of any of the information and/or content provided herein and the Company cannot be held responsible for any omission, mistake nor for any loss or damage including without limitation to any loss of profit which may arise from reliance on any information supplied by Signal Centre.

EURUSD SHORT OVERVIEWWe are looking at a conflunce of Events at area marked A:
1. EMA channel still holding Trend
2.Trendline Bounce
3. Support Turned to Resistance
4. Whole Number
5. And possible Dumping/Stop hunts earlier in the week when price moved fast to that zone stopping al those who took Short position early.

SPX (S&P500) - Trendline Support Test - Daily - PotentialSPX ( S&P500 ) is currently testing Trendline Support price above $3737.20.
SPX price could potentially bounce up from trendline support to the price targets above: $3894.86, $4000, $4100.
FOMC Statements & Press Conference policy changes could cause extra volatility this week and month for risk assets.
This would mark the 6th major time the SPX price has tested the lower trendline support line.
However, if trendline support Fails, price could eventually fall down to $3700, $3600, $3500 below.
Utilize stop loss, profit target, position sizing, and risk management.
All content is Not financial advice. Trade at your own risk.
Bitcoin (BTC/USD) Trendline Support Bounced - Potential SwingBitcoin (BTC/USD) price has bounced up from $20000, forming a Trendline Support Line.
Intraday price pullbacks back down can occur this week and month.
Watching to see if a new 1-hour or 4-hour Uptrend forms for Long Swing Trading or not.
Bullish Targets would be: $24000, $26000, $28000.
However, if an intraday uptrend fails to form, there could be a re-test of support levels below.
Bearish targets would be: $22000, $21000, $20000.
Utilize stop loss, profit target, position sizing, and risk management.
All content is Not financial advice. Trade at your own risk.

GBPJPY-BUYGBPJPY seems to be forming an ascending triangle & is near he support trend line that has been respected over the passed few weeks. from a technical standpoint, I'm expecting it to reject the TL before it shoots up again. what do you guys think?

FINOPB Looks like is going to break the resistance this timeLooks like have good upside
broken trendline nd took a support on trendline
RSI bullish
Close about 270 can take it to 288 in short term and even further
Stay tuned

USDJPY: Bulls never left!!USDJPY
Intraday - We look to Buy at 136.03 (stop at 135.42)
Although we remain bullish overall, a correction is possible with plenty of room to move lower without impacting the trend higher. There is scope for mild selling at the open but losses should be limited. Prices expected to stall near trend line support. Dip buying offers good risk/reward. Further upside is expected although we prefer to buy into dips close to the 136.00 level.
Our profit targets will be 137.48 and 138.00
Resistance: 137.50 / 139.40 / 145.00
Support: 136.00 / 132.00 / 126.70
Please be advised that the information presented on TradingView is provided to Vantage (‘Vantage Global Limited’, ‘we’) by a third-party provider (‘Signal Centre’) . Please be reminded that you are solely responsible for the trading decisions on your account. There is a very high degree of risk involved in trading. Any information and/or content is intended entirely for research, educational and informational purposes only and does not constitute investment or consultation advice or investment strategy. The information is not tailored to the investment needs of any specific person and therefore does not involve a consideration of any of the investment objectives, financial situation or needs of any viewer that may receive it. Kindly also note that past performance is not a reliable indicator of future results. Actual results may differ materially from those anticipated in forward-looking or past performance statements. We assume no liability as to the accuracy or completeness of any of the information and/or content provided herein and the Company cannot be held responsible for any omission, mistake nor for any loss or damage including without limitation to any loss of profit which may arise from reliance on any information supplied by Signal Centre.

HOW TO USE TRENDLINE FOR ENTRYIn this video i showed you how to use Trendline for entry in the easiest and simple way.
What do you think about this?
I would like to hear your view, drop your comment.
