GOLD → Retest 3620 - 3600 (imbalance zones) on the uptrendFX:XAUUSD is consolidating ahead of important news. The market is currently testing support, but the bullish pattern remains intact despite the intraday correction.
Gold is trading near $3650 in anticipation of US inflation data (CPI), which will determine the further trend. So far, the metal is consolidating below a record high of $3675.
High CPI data: will strengthen the dollar and weaken gold (bets on Fed easing will decline).
Low data: will push gold to new highs (the likelihood of aggressive rate cuts will be confirmed).
At the moment, the probability of a rate cut on September 17 is 92% (25 bps), with an 8% chance of 50 bps.
Technically, the chart is forming a consolidation against the backdrop of a bullish trend, the market is testing support, and if the bulls hold their ground in the key zone, traders may return to buying.
Resistance levels: 3638, 3649, 3657
Support levels: 3620, 3607, 3600
There is a battle for the 3620 zone. Consolidation above this zone will confirm bullish strength; otherwise, we can expect a deeper correction to the 3607-3600 zone to retest the imbalance area before further growth.
Best regards, R. Linda!
Trend Line Break

NZDUSD → Correction before bull run to 0.600FX:NZDUSD , after breaking the downtrend, is forming a consolidation, the goal of which is the potential for continued growth...
The dollar is forming a small countertrend correction, to which the market is reacting, but overall sentiment on currencies is relatively bullish amid expectations of interest rate cuts...
NZDUSD is forming a trading range (consolidation) after breaking through the resistance of the downtrend. 0.5915 - 0.596. Before the growth, MM may form a liquidity capture at 0.5915 - 0.5f.
Support levels: 0.5915, 0.5884
Resistance levels: 0.5960, 0.5996
Interest rate cuts, especially aggressive ones, could trigger a fall in the dollar, which in turn would support forex currency baskets. Against this backdrop, NZDUSD could trigger medium-term growth from the specified support zone.
Best regards, R. Linda!

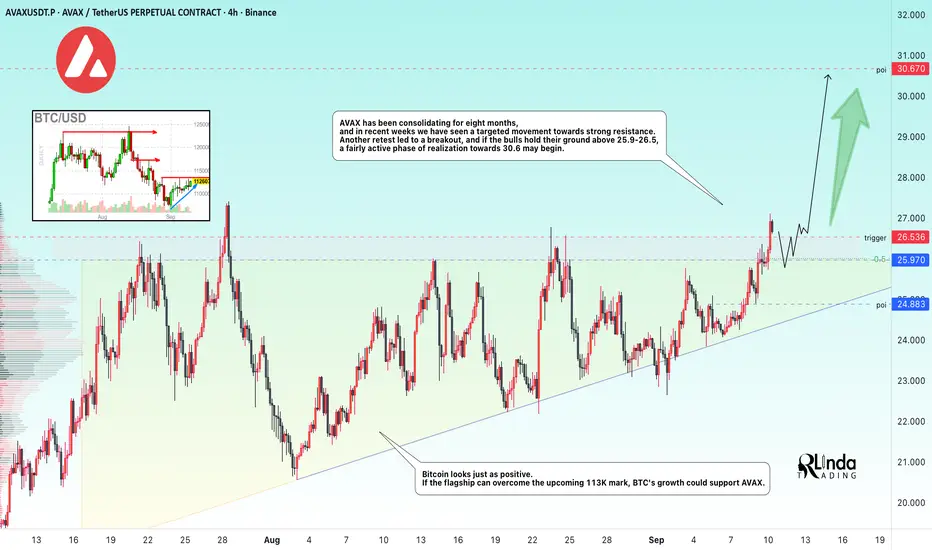
AVAXUSDT → Distribution of 8-month accumulationBINANCE:AVAXUSDT is testing the resistance of an 8-month consolidation. The market is showing positive signs that may indicate a possible rally...
Bitcoin looks positive. If the flagship can overcome the upcoming 113K mark, BTC's growth could support altcoins, including Avalanche.
AVAX has been consolidating for 8 months, and in the last few weeks, we have seen a directed movement towards strong resistance. Another retest led to a breakout, and if the bulls hold their defense above 25.9 - 26.5, a fairly active phase of realization towards 30.6 may begin.
Resistance levels: 26.550
Support levels: 25.97, 24.88
I do not rule out the possibility of a retest of the local support and liquidity zone, but a return to the zone of interest (above 25.97 - 26.55) and consolidation above the specified border could provoke a distribution towards 30.0 - 45.0.
Best regards, R. Linda!
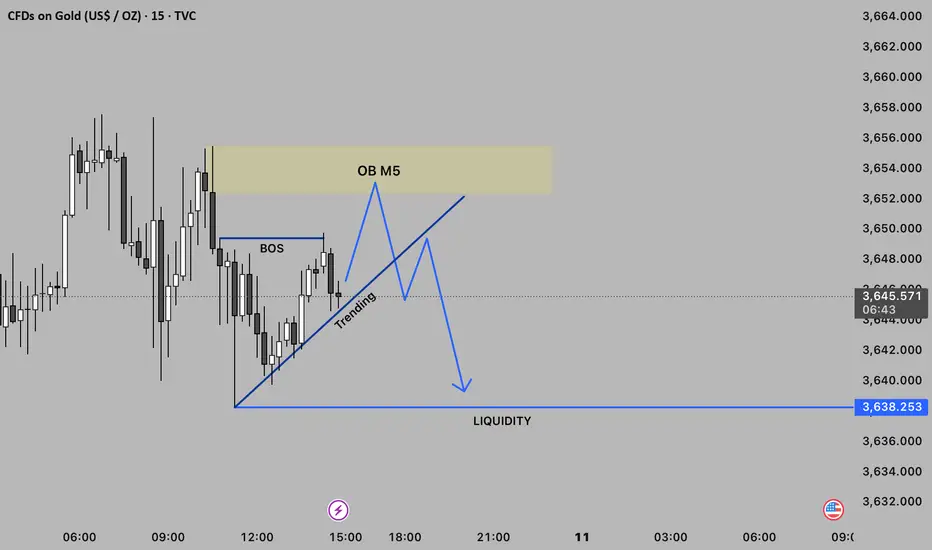
GOLD 5-Minute Smart Money Analysis (Bearish Setup)🔸 OB M5 (Order Block) – A supply zone around 3,652–3,654. This is where institutional sellers may re-enter. Price is expected to retrace here before dropping again.
💧 Liquidity Level marked at 3,638.253 – below recent lows. This is where many stop-loss orders are likely placed. Smart money often targets these zones to fuel bigger moves.
⚙️ Trade Setup Idea
🔄 Wait for price to retrace into OB M5 (yellow zone)
🔻 Look for bearish confirmation (e.g., bearish engulfing or market structure shift)
🎯 Target: Liquidity level at 3,638.253
🛑 Stop Loss: Just above the OB (low-risk entry)
✅ Current Bias: Bearish
As long as price stays below the OB zone, we favor shorts. Break above OB invalidates this setup
ENAUSDT → Attempting a trend change. Focus on 0.700BINANCE:ENAUSDT is forming an attempt to change the trend. The price breaks the descending resistance and forms a new trading range. The focus on the 0.7 support and the bulls' reaction...
Bitcoin looks quite positive after breaking the downside resistance, but there is a strong 112K zone ahead and news on Thursday / Friday. If the general backdrop maintains its bullishness, BTC's rise will support strong altcoins and the market could turn green, including the coin discussed in this publication...
ENAUSDT breaks through the downtrend resistance. Price is consolidating above the boundary and forming a trading range. The focus is on the 0.7 - 0.683 area. If the bulls keep the price above this area, it will confirm the fact of trend change, which could trigger a rally to 0.7745 - 0.853
Support levels: 0.7, 0.683, 0.668
Resistance levels: 0.736, 0.7745
Technically, there is a possible struggle between market participants for the area 0.7 - 0.668. In this case, I will not consider the return to the channel as a false breakout of the trend, as a strong upward impulse was formed earlier, which generally broke the local market structure. However, based on the technical situation, I will consider entering the position after clear signs of price holding above the key support zone.
Regards R. Linda!

(XAUUSD) 30-Min Chart – Liquidity Grab & Bullish SetupGold is currently trading around $3,594, after breaking out of a descending trendline (🔻➡️📈). This breakout suggests a potential shift in momentum, but price is still below a strong resistance zone around $3,595–$3,600 🧱, where sellers may still be active.
🔸 A liquidity sweep toward the $3,572.334 level (marked as "Main Sweep") is highly possible. This could be a classic move to grab stop-losses from early buyers before a bullish reversal.
🔸 There is also a Fair Value Gap (FVG) between $3,576 – $3,586, which may act as a magnet for price and a potential demand zone 📉📥.
Two bullish scenarios are likely:
1️⃣ A retest of the FVG or sweep of $3,572, followed by a bounce back up toward resistance.
2️⃣ A direct breakout above the resistance zone, confirming bullish strength and targeting higher highs 📈🚀.
📌 Summary:
Watch for a possible fakeout or liquidity sweep into the FVG/Main Sweep zone. If price holds and shows bullish intent, gold could rally toward or above the $3,600+ level. Patience and confirmation are key! 🔑📊

HYPEUSDT → Upward consolidation. One step away from a rally BINANCE:HYPEUSDT.P continues to consolidate while maintaining an ascending triangle structure. Any bullish driver, even a weak one, could trigger a breakout of resistance and distribution with an ATH update...
Against the backdrop of weak Bitcoin and falling altcoins, HYPE looks positive. The market is holding an upward support line and a bullish trend, and the update of the local maximum as a manifestation of bullish strength is a positive sign. The price is changing the local market structure to bullish and is ready to continue growing after a correction. Focus on the 46.15 and 45.5 - 45.08 areas. A false breakdown and closing above the level will confirm the readiness to continue growing.
Resistance levels: 47.78, 49.54
Support levels: 46.15, 45.08, 44.45
As part of the correction, the price may test the specified areas of liquidity and interest, which may provoke a change in the market imbalance in favor of buyers. If, after a false breakdown of key areas, the bulls keep the price above, then in the short and medium term, we can expect continued growth.
Sincerely, R. Linda!

TRUMP/USDT PRE INCREASE VIEWTRUMP shows on the low time frame a pre increase depending on data, there will be a follow-up to see if this coin is able to get confirmed.

XAUUSD – Week 08/09 to 12/09, CPI & PPI in FocusXAUUSD – Week 08/09 to 12/09, CPI & PPI in Focus
Good day Traders,
Gold posted a notable advance last week, recording new highs on a near-daily basis. While this type of price action is not unprecedented, it has introduced an element of caution to the market. Investor sentiment remains firmly skewed towards the long side, reaffirming gold’s position as a key safe-haven asset.
Fundamental Outlook
Attention this week will centre on the release of US CPI and PPI data. These figures will be critical in assessing the financial health of the US economy and could directly shape the Federal Reserve’s decision on a potential rate cut in September.
Technical Outlook
Price has already surpassed the Fibonacci 1.618 extension, with the next upside projection aligning near the 2.618 level at 3687.
Prior to reaching this objective, a modest retracement into nearby FVG (Fair Value Gap) zones is possible.
On a longer-term horizon, the 3467 – 3475 region is highlighted as a constructive area for accumulation, supported by the confluence of FVG, Dibo and Volume Profile.
Trading Scenarios
Upside Bias: Long positions remain the preferred approach. The 3467–3475 area offers a technically favourable entry zone for those with a longer-term outlook.
Downside Case: Short exposure should only be considered upon evidence of a reversal structure, with confirmation via a break below 3510, or rejection from the 2.618 Fibonacci extension.
Final Thoughts
For the week ahead, gold continues to be best approached from the long side. Nevertheless, traders should closely monitor price reactions at the identified technical levels and adjust accordingly. With key macroeconomic releases imminent, maintaining disciplined risk management remains essential.

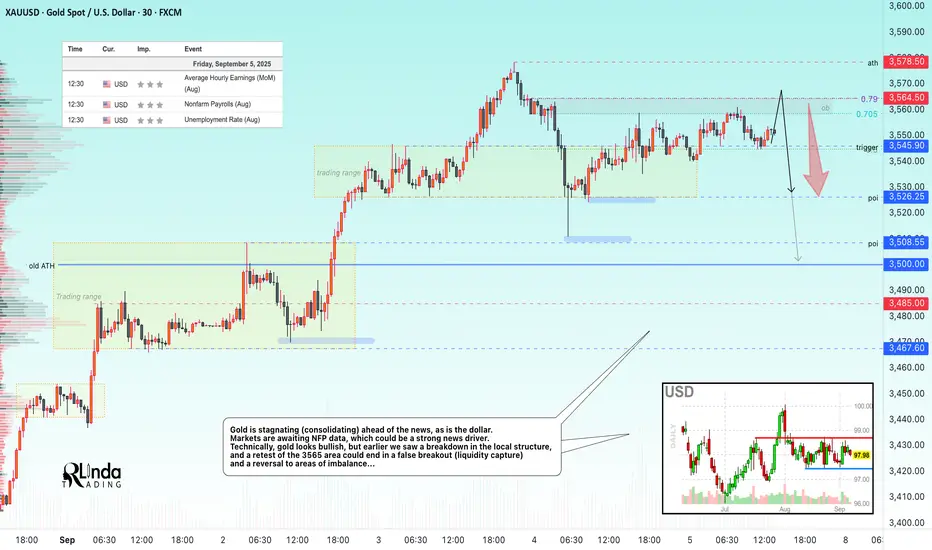
GOLD → ATH retest before NFP. High risk level...FX:XAUUSD remains in a bullish trend, but short-term dynamics depend on NFP. A break above $3578 will open the way to new highs, but profit-taking at record levels could increase volatility.
Gold remains strong ahead of US NFP data, which may confirm the Fed's policy easing. Weak data (forecast: +75K new jobs) will reinforce expectations of a rate cut and support gold. However, the risk of a correction is quite high, and any nuances could trigger liquidation. Weak employment data, namely rising unemployment and low ADP figures, are strengthening bets on a Fed rate cut, which overall only increases interest in the metal.
Resistance levels: 3564.5, 3578.5
Support levels: 3545.9, 3526, 3508
NFP data will determine the short-term trend. A weak report will lead to growth to $3600+, while a strong report will lead to a correction to 3450-3400. Technically, I expect a correction after the local bullish structure breaks down. It is not worth trading on the news; it is better to wait 20-40 minutes after the release to make decisions based on fundamental data.
Best regards, R. Linda!
EURGBP → The battle for zone 0.867. What are the prospects?FX:EURGBP is attempting to remain above 1/2 of the key trading range as part of a retest after breaking through strong resistance. The local trend is bullish, and the price has a chance to reach 0.8743.
EUR is consolidating in a wedge pattern, with the price moving away from support and attacking resistance. Against the backdrop of the expected Fed rate cut, EUR may break through the line and begin an active phase of growth, which will support EURGBP. The currency pair's price has moved beyond the lower half of the trading range and is attempting to consolidate above the bullish interest zone. If the bulls hold their defense above 0.866-0.867, the price will have a chance to test the poi
Support levels: 0.867, 0.865, 0.8635
Resistance levels: 0.871, 0.874
Against the backdrop of the news, the price may test the order block in the 0.865 zone. A false breakdown and consolidation of the price above 0.867 will confirm the bulls' intentions, allowing the price to move towards the specified target.
Best regards, R. Linda!

GOLD → The uncertainty factor before the news. Down / up?FX:XAUUSD after updating another high to 3578 went into the phase of profit taking before two busy news days. The trend is aggressively bullish, but the risks of correction are quite high due to the uncertainty factor....
The price pulled back from record highs amid profit taking and reduced panic in the bond market. The dollar stabilized, but remains under pressure due to expectations of Fed rate cuts this year. The key event will be the publication of US employment data (NFP) on Friday.
A correction after a sharp rise is a natural reaction, but the expectation of Fed policy easing is supporting the metal's price.
Geopolitics: Trade risks (Trump's tariffs) mitigate gold's fall.
Gold's correction so far looks like a pause before further movement. The main driver is NFP data, which will determine Fed rate sentiment and USD direction. But, today all eyes are on ADP Nonfarm, Initial jobless claims, and ISM data. Unexpected data may intensify the sell-off....
Resistance levels: 3546, 3559, 3563
Support levels: 3526, 3508
It is difficult to determine the news reaction in advance, we will have to orient ourselves after the fact. Technically, I expect a deeper correction for a healthy market. I expect a retest of the 3560 zone and further decline to local liquidity zones.
Regards R. Linda!

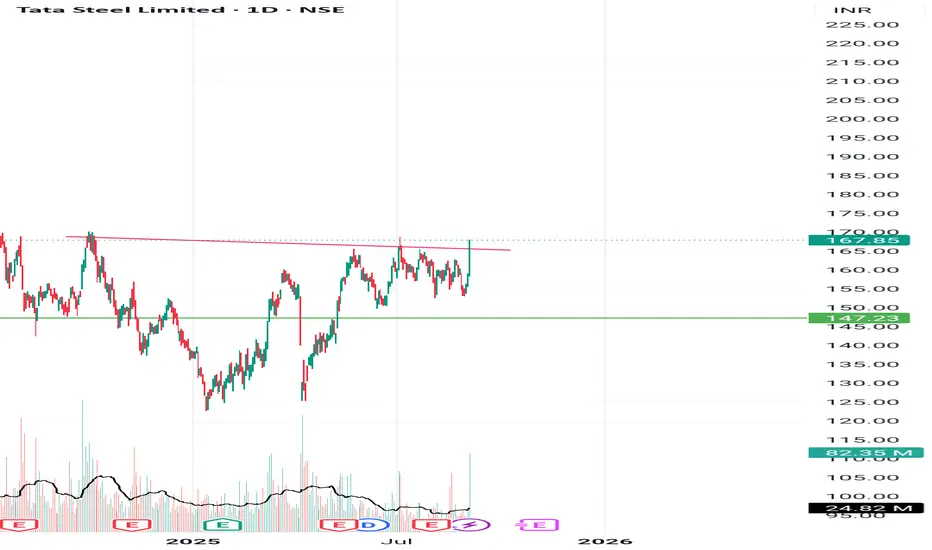
Clear breakout with good volume Breaked a clear trendline cum cup and handle pattern with decent volume indicates to go up. Do your own analysis and take up your trade
***Educational purposes only***
GOLD → Consolidation in the ATH zone. Risk zone...FX:XAUUSD hit a new all-time high of around $3,550 as investors worldwide rushed to safe-haven assets. As prices rise, the risk of profit-taking increases, especially with news coming up...
The key driver is the crisis in the bond market: long-term government bond yields are rising sharply in the UK and Japan. This is boosting demand for gold as a safe haven. We should also not forget about expectations of Fed easing: weak employment data could increase bets on a rate cut in September.
However, strong US employment data (starting with JOLTS today) could support the USD and limit gold's growth.
Correction: Record levels could trigger profit-taking, especially given that the price has come a long way since the last pullback, rising nearly 6% (7 days of growth).
Key factor: US labor market data (JOLTS today, NFP on Friday). Weak figures will strengthen gold, strong ones may cause a correction.
Resistance levels: 3546, 3550, 3575
Support levels: 3526, 3508, 3500
Technically, a retest of resistance at 3342-2246 could lead to a breakout and further growth. However, since the price has stopped updating its highs locally, I do not rule out the possibility of a retest of support at 3529-3526 before further growth. However, a weak reaction to support could lead to the formation of a pre-breakdown base, and a breakdown of support could trigger a decline to 3500.
Best regards, R. Linda!

GBPNZD → Retest 2.276 before resuming the bullish trend FX:GBPNZD is testing a key support level as part of a correction after breaking through consolidation resistance. The trend is bullish, and liquidity capture could resume the upward movement.
GBPNZD is testing a strong support level within the uptrend during the correction phase. Against the backdrop of the long-term decline of the NZD, the currency pair has every chance of continuing to grow.
On the daily timeframe, we have a fairly strong upward structure, with the previously broken consolidation resistance and the 0.5f area playing a key role. This tandem hides a liquidity area that could become a driver for the market. A false breakdown of 2.276 could trigger a resumption of growth.
Support levels: 2.276, 2.2682
Resistance levels: 2.2983, 2.3215
The bullish trend may support the main trend. The current correction is a healthy movement within an uptrend that may continue after a pullback and consolidation.
Best regards, R. Linda!

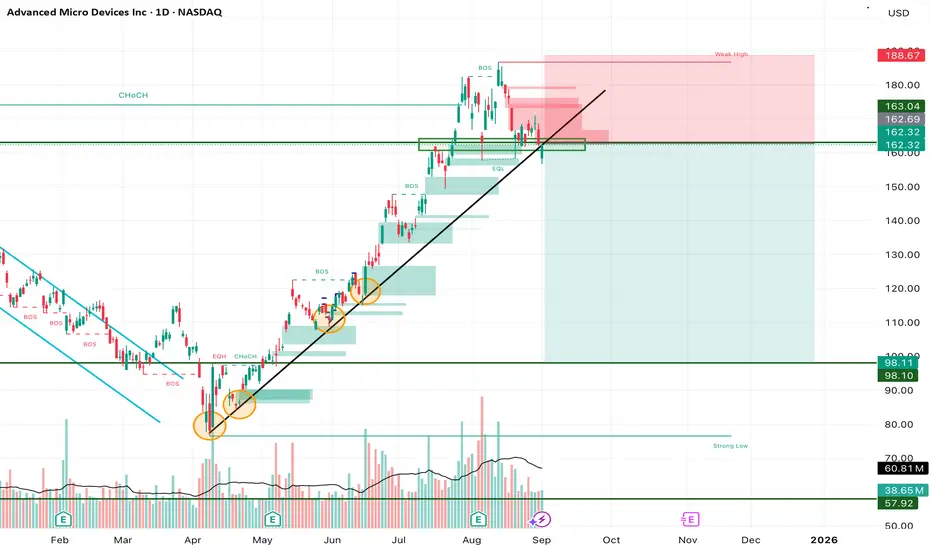
AMD Trendline Break – Short-Term Weakness, Long-Term AI Power PlAMD has broken below its long-standing ascending trendline, which has been respected multiple times since April. This is the first real sign of weakness after months of steady upside. The $162–165 zone, once strong support, is now acting as resistance. Unless bulls can reclaim this area quickly, AMD risks sliding lower toward $150 or even deeper levels.
Technical View:
• Trendline: Broken on daily chart → bearish short-term shift.
• Resistance: $162–165 (former support), $186–187 (weak high).
• Support Levels: $150 psychological, then $135–140 range.
• Indicators: RSI softening, MACD negative, short-term MAs leaning bearish.
Fundamental Backdrop:
Despite this technical weakness, AMD’s long-term story remains strong. HSBC recently upgraded AMD with a $200 price target, citing its MI350 AI chips that rival Nvidia’s Blackwell GPUs. The MI400, due in 2026, could expand GPU sales to $20B by 2028. Melius Research also raised its target to $175, highlighting AMD’s AI trajectory. Fundamentally, AMD is building momentum as a serious competitor in the AI chip race.
Trade Setup (Swing Idea):
• Entry Zone: $162–165 rejection area.
• Stop Loss: Above $188 (weak high).
• Take Profit 1: $150 (psychological level).
• Take Profit 2: $135–140 demand zone.
• Long-Term Accumulation: Any dip below $150 could be a strategic buy for investors with a $175–200 upside target in the AI cycle.
My View:
Short-term, the break of trendline favors bears — I’m watching for a retest of $162–165 to confirm resistance. Medium-term, I see pullback opportunities. Long-term, AMD’s AI roadmap gives conviction that dips should be accumulated rather than feared.
(Not Financial Advice) NASDAQ:AMD
GOLD → False breakout at 3500. What next? 3400 or 3600?FX:XAUUSD updates its ATH on the spot market to 3508.5 and forms a false breakout, provoking liquidation and profit-taking. The imbalance in the market is changing, and a deeper correction is possible...
Gold updated its historical maximum above $3500, but faced a correction amid a short-term strengthening of the dollar. The market's attention is focused on the US ISM Manufacturing PMI data, which may determine further dynamics.
Key drivers: The probability of a rate cut in September is estimated at 90%, which supports gold. Pressure on the USD continues due to concerns about the independence of the Fed (pressure from Trump) and geopolitics. The escalation of the Russia-Ukraine conflict (new strikes by the Armed Forces of Ukraine on Russian territory) is increasing demand for defensive assets.
Ahead of the ISM Manufacturing PMI: Forecast — growth to 49 (but remains in the contraction zone). If the data turns out to be weaker, it will strengthen dollar sales and push gold to new records.
Resistance levels: 3485, 3500
Support levels: 3467.6, 3441, 3423
Technically, gold may enter a longer consolidation or correction. If the bears keep the price below 3490-3485, then in the short term, we can expect a decline to the specified support zones. I do not rule out the possibility of a retest of 3500-3505, but at the moment I do not see the potential for the market to continue growing (in the short term!).
Best regards, R. Linda!

WLFIUSDT → Liquidation of hamsters before the rally to 0.3300BINANCE:WLFIUSDT.P is Trump's project. This relatively new coin is demonstrating aggressive and manipulative trading, but there are key areas on the chart that can be used as a guide...
We all know about the manipulative games of Trump's projects ;) and this can be used in trading... The WLFI coin has growth potential, but we need to wait for confirmation. Technically, this is a rather aggressive and manipulative game. A sharp drop and liquidation of all “hamsters” to the 0.25 - 0.20 zone. However, the price has stopped updating lows, volatility is decreasing (consolidation). If the price returns to the range, there will be potential for growth. At the moment, the price is not allowed to fall, consolidation is forming, with resistance at the 0.2521 trigger. The market is testing this trigger... At the same time, Bitcoin is strengthening and may support altcoins...
Resistance levels: 0.2521
Support levels: 0.2250, 0.2042
Technically, if the local structure does not break down and the price continues to storm 0.2520 - 0.255, this could lead to a return of the price to the trading range, which would open up the possibility of growth to 0.33.
The structure will break if the price breaks through the support level of 0.225 - 0.22.
Best regards, R. Linda!

COFFEE could turn around big timePrice on COFFEE looks very interesting at the moment, this latest move broke the narrative of a downtrend.
The most recent interaction with the downtrend is particularly interesting, because it's already showing early signs of consolidation, decreased bearish momentum. What may follow: retest of trendline, low-volume candles suggesting exhaustion, all aligning for potential upwards.
My target would be toward 350$ where we have a clear zone. If this move plays out, it will make a beautiful switch of a narrative that’s we've been seeing for COFFEE. This is what makes the setup so compelling. It’s a "story being shown".
Though a scenario for more downside is possible. Still, I am taking the side for more upside because such decrease is not sustainable long without a correction.
Disclosure: I am part of Trade Nation's Influencer program and receive a monthly fee for using their TradingView charts in my analysis.

GOLD → One step away from 3500. Consolidation. What next?FX:XAUUSD has been rallying towards 3500 since the opening of the session, and the market has every chance of testing this level. Consolidation or correction may form before the next breakout...
Gold resumed its growth at the beginning of the week, reaching five-month highs around $3480 amid declining risk appetite and expectations of Fed policy easing. Trading activity remains low due to holidays in the US and Canada.
Key drivers : Weak Asian markets and uncertainty surrounding Trump's trade policy are supporting interest in gold. The probability of a rate cut in September is estimated at 90% after last week's PCE data.
Overall, the market maintains its momentum towards record levels ($3500), but low liquidity may increase volatility.
Technically , gold is strongly bullish. The price is striving to test the ATH - 3500. Before that, consolidation or a retest of the 3469-3460 zone may form. The dollar is weak at the moment and continues to trend downward, which generally supports gold.
Resistance levels: 3484.8, 3500
Support levels: 3469.5, 3460
Undoubtedly, after consolidation or correction, gold may reach its target. However, continued growth beyond 3500 may be questionable due to a lack of energy, as the market has spent it to reach 3500. Accordingly, a false breakout of the ATH could trigger a strong profit-taking phase, which in turn could lead to a sell-off and correction.
Best regards, R. Linda!

Gold Update – With US Banks Closed, Beware of a Possible TrapGold Update – With US Banks Closed, Beware of a Possible Trap
Hello traders,
With US banks closed today, market liquidity linked to the dollar may be thinner than usual, creating less predictable moves for gold. The rally during the Asian session has tempted many traders to look for a “sell the top” opportunity with hopes of sizeable profits.
In my view, the market could set up a trap for short-sellers, meaning price may either push higher during the US session or remain sideways at current levels before revealing clearer direction.
At this stage, it may be better to wait for a cleaner wave structure before committing. The priority should still be trading in line with the broader uptrend.
Buy entry zone: around 3340–3345, with a stop-loss of roughly 10 dollars.
For short positions: patience is key – wait for clear channel confirmation on the M15–H1 timeframes before considering entries.
That’s my current view on gold for today’s US session. Use it as reference and manage risk carefully.

GOLD → Retest 3400 before the news. Will there be a rally?FX:XAUUSD is pulling back slightly after hitting a new high of 3423. The trend is bullish, and on the D1 chart we see a breakout of a symmetrical triangle, which generally hints at bullish potential.
Gold is correcting after rising to $3423 in anticipation of US PCE inflation data.
Key factors: Doubts about the Fed's independence are limiting the USD's strengthening. Soft Fed rhetoric: Board member Waller supported a rate cut in September and further easing. The probability of a September rate cut is estimated at 87%.
Today's news: Core PCE inflation data (forecast: 2.6% y/y).
If below forecast → increased expectations for policy easing → support for gold
If above forecast → dollar strength → gold correction
Short-term gold dynamics depend on inflation data and its impact on Fed rate expectations
Support levels: 3405, 3394, 3386.5
Resistance levels: 3415, 3423, 3433
As part of the correction, the price may test liquidity zones and enter a consolidation phase ahead of the news. However, the market is one step away from distribution (exit from a symmetrical triangle). If the bulls keep the price above 3400 as part of the correction, we will have a good chance to catch the rally...
Best regards, R. Linda!

XAUUSD – Medium-Term Trading ScenarioXAUUSD – Medium-Term Trading Scenario
Hello traders,
Gold is moving into the final stage of its flag formation. Medium-term traders are now waiting for a clear breakout confirmation, as that will determine the next medium- to long-term move. Once confirmed, the plan is to trade immediately in the breakout direction.
In the meantime, short-term and intraday traders continue to work inside the flag, taking scalping opportunities while price remains range-bound.
From my perspective, the probability of an upside breakout and continuation of the broader bullish trend is high after such a long period of consolidation. To optimise entries, buying near the lower boundary of the trendline makes sense, with stop-losses placed just below in case of a breakdown. A particularly important zone is the Fibonacci retracement 0.5 at 3354, which combines dynamic and static support with a key Fibonacci level. This is a strong area to build medium- to long-term long positions.
An earlier entry can also be considered around 3372, where the previous candle confirmed strong bullish momentum. In this case, stops should be kept tight, just under the nearest support.
The bullish case only fails if price breaks and closes firmly below the lower trendline, which would confirm a reversal.
That’s my view on gold for the coming sessions – stay patient, manage risk, and wait for the structure to confirm. What’s your outlook? Let’s discuss in the comments.
