XAUUSD Price Action Update – Waves in PlayXAUUSD Price Action Update – Waves in Play
Hello traders,
As I shared yesterday in the long-term outlook for gold, the first scenario is playing out almost perfectly. Price reaction levels have been spot on, making trading much easier – and that’s exactly why detailed planning is so important when building a scenario.
Key reaction zones have already delivered profits: the buy at 3375 and the sell at 3409 both worked well. More importantly, my long-side projection is still valid, with targets at least around 3430 and potentially as high as 3450.
Following that scenario, the plan remains to look for buy entries on pullbacks, since no market goes straight up or straight down. Every move needs secondary phases of liquidity grabs and corrections.
With the current structure, buying here feels a bit “mid-range”, but with larger profit potential the risk can be justified. A buy entry around 3405 looks reasonable, while corrective short setups can be considered near 3430.
Holding onto long positions at current levels remains very logical – and remember, cultivating the right trading mindset is just as important as finding good entries.
Drop your thoughts in the comments, let’s discuss this setup together.
Trend Line Break

GOLD → Bullish trend. Pullback before growthFX:XAUUSD continues to gradually storm the 3375-3405 area, paving its way to strong resistance at 3410. The fundamental background is relatively positive, with a bullish trend.
Gold has retreated slightly from its two-week peak ($3400), but retains its growth potential against the backdrop of two key factors: Pressure on Fed Chair Lisa Cook is undermining confidence in the dollar and strengthening demand for defensive assets. New tariffs on China and India are reviving fears about global growth, which is beneficial for safe havens.
But there are also restraining factors: A strong dollar could limit gold's growth. It is also worth paying attention to Friday's US inflation data (PCE), which will determine the further trend. Soft data will reinforce expectations of a Fed rate cut and push gold higher.
Resistance levels: 3386.5, 3393.5
Support levels: 3373.7, 3369.6
Movements up to 3410 may be zigzagging due to the fairly heavy zone of 3375 - 3410 (this can be seen in the volume profile). Focus on local but strong support: 3373 - 3369, the market may test this area before storming resistance 3386 - 3393 for growth to 3405 - 3410.
Best regards, R. Linda!

NZDJPY → A false breakout of resistance will trigger a declineFX:NZDJPY entered a correction phase after a sharp decline. The main trend is downward, with a countertrend movement aimed at consolidating potential before further decline.
A countertrend correction is forming against the backdrop of the main downward trend. The current movement may be aimed at hunting for liquidity before continuing its movement. Focus on the resistance zone at 86.67
The currency pair is trading below key resistance within the global downtrend. As part of the correction, the price may test 86.67 - 87.10 before continuing the main trend.
Resistance levels: 86.67, 86.97, 97.11
Support levels: 85.97, 85.6
If a false breakout of the key zone of interest forms during the correction without the possibility of continuing growth, we will receive confirmation that the market is ready to move down. Consolidation below the level may trigger a downward impulse.
Best regards, R. Linda!

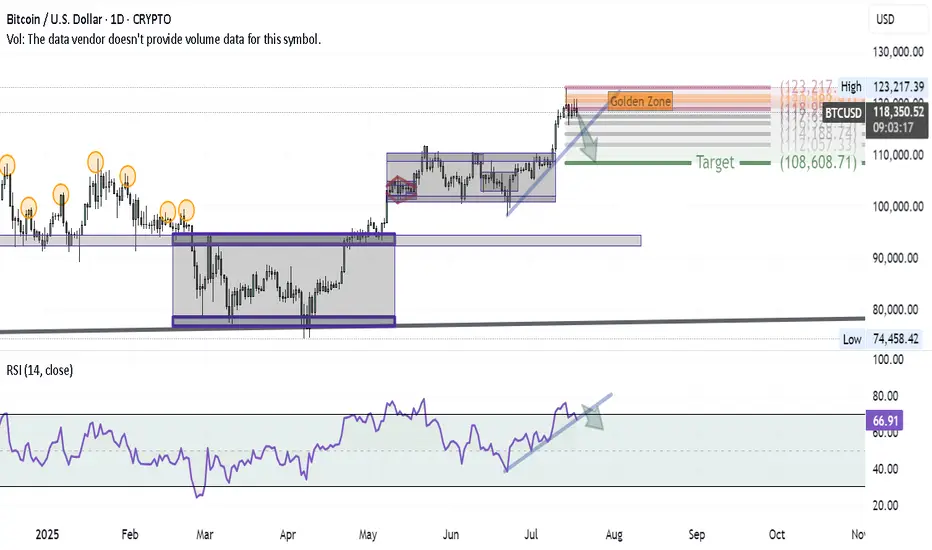
Bitcoin Correction Unfolding — First Wave in MotionAfter successfully hitting the BITCOIN target and anticipating a major correction in my previous ideas, here’s how the first wave of that correction is shaping up on the daily chart:
1- At the recent high, a Shooting Star candle formed — a classic reversal signal.
2- Using Volunacci analysis, the price retraced exactly to the Golden Zone, validating the first leg of the pullback.
3- The next step? A breakdown of the blue trendline would likely send us toward the Volunacci target at $108,600.
4- For confirmation, we're watching the RSI trendline — if it breaks down as well, it would strongly support the bearish continuation.
The setup is clean and developing as expected — it's all about following price and letting the chart guide the story.
GBPAUD → The correction is nearing completion...FX:GBPAUD is set to end the correction formed within the global bullish trend. A false breakdown of the liquidity zone is forming...
GBPAUD on D1 is testing a strong support zone, which gives traders hope for a possible recovery. Locally, the chart shows signs of the correction ending...
After correcting to 1/2 of the range, GBPAUD is forming a false breakdown of the order block and breaking the bearish structure, confirming the end of the correction. Consolidation above 2.076 could trigger a recovery within the bullish trend.
Resistance levels: 2.086, 2.0978
Support levels: 2.076, 2.0715
Despite breaking through the resistance of the local correction, the market must confirm the bullish sentiment. Consolidation of the price above 2.076 will confirm this nuance, and consolidation above the key support may influence further growth.
Best regards, R. Linda!

XAUUSD – Medium-Term Trading OutlookXAUUSD – Medium-Term Trading Outlook
Hello traders,
Gold is now entering the final stage of its flag formation. Medium-term traders are watching closely for a clear breakout confirmation, as this will define the next medium- to long-term move. Once price confirms the break, the plan is to enter immediately in the direction of that breakout.
In the meantime, short-term and intraday traders can continue trading within the flag, taking advantage of scalping opportunities inside the range.
From my perspective, the probability of an upside breakout and continuation of the broader bullish trend is fairly high after such a long consolidation. To optimise entries, it makes sense to buy near the lower boundary of the trendline, with stop-losses placed immediately if the pattern breaks down. The key level to watch is the Fibonacci retracement 0.5 at 3354 – an area that acts as both dynamic and static support, as well as a critical Fibonacci level. This is a strong zone for long-term buy setups.
Additionally, an earlier entry can be considered around 3372, where the previous candle showed strong buying momentum. Traders entering here should keep stops tight, just below the nearest support.
This bullish outlook would only be invalidated if price breaks below the lower trendline and closes firmly underneath it, confirming a reversal.
Wishing you success with this trading plan. If you share a similar outlook, feel free to drop your thoughts in the comments and let’s discuss further.

Bitcoin – Long-Term Outlook with Elliott Wave StructureBitcoin – Long-Term Outlook with Elliott Wave Structure
Hello traders,
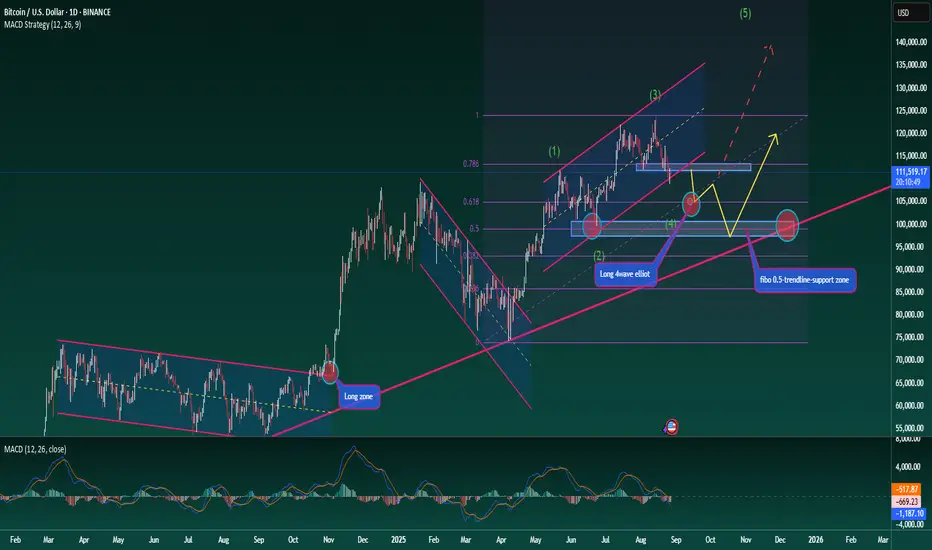
Taking a step back for a medium- to long-term perspective on BTC. The broader trend remains bullish, yet for any rally to be sustainable, corrective phases are essential. Right now, BTC is in a corrective move, which aligns with wave 4 of the Elliott Wave structure.
To measure the depth of this correction before wave 5 develops, we can look at the Fibonacci retracement levels. Two zones stand out as significant: 0.618 and 0.5.
At 0.618, support is strong but not yet decisive. If price reacts here and wave 5 unfolds, the Elliott count stays intact and relatively clean.
At 0.5, this is often the ideal retracement level on Fibonacci. The chart also shows this as a major structural support. If it breaks, deeper downside could follow, as the ascending trendline also suggests.
Long-Term Trading Plan
Entry 1: Around the 0.618 retracement at 105k
Entry 2: Around the 0.5 retracement at 99k
This setup forms the basis for a medium-term strategy, but if the second zone (99k) holds strongly, it could well serve as the foundation for a longer-term bullish cycle.
Stay patient, keep risk management at the forefront, and let the structure play out.
What’s your take on BTC’s long-term wave structure? Drop your thoughts in the comments and let’s discuss.
Gold – US Session UpdateGold – US Session Update
Hello traders,
Gold is moving in line with the scenario, currently tracking wave 2 in Elliott, even though overall market volume remains light. What matters now is a clean break above 3386 resistance – that would provide enough momentum for gold to extend higher, with the next target around 3411, before continuing into wave 3.
At present, the setup is already running with around 200 pips profit. Traders can continue to hold positions, but taking partial profit (closing half) may help ease the psychology and allow more comfort in holding for extended targets.
For those who missed the earlier entry, the 3380 zone still offers a possible entry point. Although it’s slightly late, the target remains far enough to justify action.
Stick with this scenario if it aligns with your outlook – and always remember to manage risk carefully.
Wishing you success with your gold trades.

GOLD → Consolidation to continue growth towards 3400FX:XAUUSD is updating its local maximum but is facing pressure in the 3375-3400 zone. The market is bullish, but the dollar is consolidating. Traders are waiting for signals and stronger drivers...
Gold resumes growth, approaching the $3400 level, amid a weakening dollar and falling US government bond yields.
Key drivers: Trump's new threats of tariffs on Chinese goods and his attack on the Fed (removal of Lisa Cook) are undermining confidence in US assets (pressure on the dollar).
Soft Fed rhetoric: Expectations of a September rate cut have strengthened after Powell's speech.
Key risks: The dollar's recovery amid trade threats, US economic data may adjust rate expectations, and the escalation of the trade war supports demand for safe assets
The short-term dynamics of gold will depend on the balance between the Fed's soft monetary policy and trade tensions.
Resistance levels: 3379, 3400
Support levels: 3369, 3362, 3358
As part of the correction, the market may test local support zones located within the current trading range, after which gold may return to attack 3375-3379 to continue its growth towards 3400.
Best regards, R. Linda!

BNBUSDT → Strong altcoin. Correction before growth.BINANCE:BNBUSDT.P , after forming an ATH, entered a correction, which may stop at 10-15%, after which the market may enter a recovery phase. The coin looks quite strong, especially against the backdrop of a bullish trend...
BNB looks quite stronger than Bitcoin. While the flagship is forming a deep correction, the altcoin is testing local support within the bullish trend.
BNB has quite positive dynamics. There is a strong bullish trend, the ATH has been updated, but a correction is forming, which is 8% of the permissible 30% (there is still room to move). The liquidity zone of 820-815 may serve as an area of interest. By the time the mirror level and strong area of interest are retested, Bitcoin may move into a recovery phase, which in turn will trigger growth in BNB.
Support levels: 820, 816, 796
Resistance levels: 861, 884, 901
At the moment, the entire cryptocurrency market is in a downtrend. As part of this cycle, BNB may test support at 820-816. A false breakdown of support and consolidation above this level may indicate that bulls are interested in further growth. This could trigger a recovery within the main trend.
Best regards, R. Linda!

Gold Scenario – Following the Medium-Term UptrendGold Scenario – Following the Medium-Term Uptrend
Hello traders,
Gold continues to move in line with expectations. Price reacted at the Fibonacci 1.618 resistance, effectively completing a liquidity test. The 3368 zone now offers a reasonable area to consider long positions.
With the previous ABC Elliott cycle complete, gold appears to be forming a new wave structure. Price is likely in wave 3 of the uptrend, pulling back slightly at the H4 descending trendline, before finishing with wave 5 breakout, which would also confirm the flag pattern forming on H4.
Trading plan: Look to buy around 3368, with a strict stop placed below the previous swing low.
Profit target: 3410 is a reasonable first take-profit. After that, expect a wave 4 correction, where short setups can be considered.
The MACD remains supportive, holding above its average and confirming bullish momentum. At this stage, it’s all about finding the right entry and trading with discipline.
This is my personal outlook for gold in the short to medium term. Use it as reference, and feel free to share your perspective in the comments so we can discuss further.

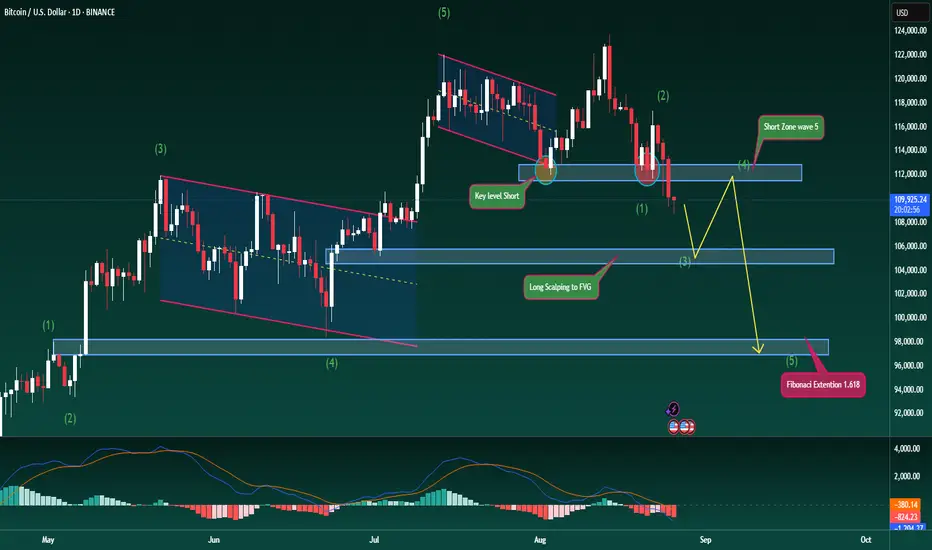
Bitcoin Reversal in Focus –Elliott Wave Signals Further DownsideBitcoin Reversal in Focus – Elliott Wave Signals Further Downside
Hello traders,
BTC has now broken firmly below a key support zone, confirming stronger short-side pressure and signalling the potential start of a medium-term reversal.
The 112k level, which twice acted as firm support, has finally given way. With that break, the market is now looking lower, with Fibonacci Extension pointing towards 97k–98k as the next major downside objective.
From an Elliott Wave perspective, price is in wave 3 of the decline and has not yet reached the corrective bounce expected for wave 4. The 105k region may provide temporary support, leading to a short-lived recovery, before a final wave 5 drop completes the structure towards 97k, or possibly 95k. That zone could present the next meaningful opportunity for medium-term longs.
Momentum indicators support this outlook – the MACD shows both volume and averages pressing lower, reinforcing the bearish bias.
I’ve highlighted the critical levels on the chart. Use them as guidance, but keep risk management tight and stay disciplined with your trading decisions.
What’s your perspective on BTC here? Do you see 97k coming into play soon? Share your thoughts in the comments.
Bitcoin – Bulls Hold the Edge After 110k BounceBitcoin – Trading Plan Update
Hello traders,
BTC has followed the scenario well, reacting strongly at 110.4k and bouncing higher. This level effectively cleared short-side liquidity, while the H4 candle failed to close below the 111.8k support. As such, long entries around 110k remain valid, with upside targets towards 115.5k.
The bias stays on the long side as long as price does not confirm a decisive bearish break. Long positions remain in play until price moves firmly below 110k.
For those who closed longs or missed the earlier move, watch for a retest of the FVG zone near 111.5k. If price reacts higher, fresh longs can be taken around 113k.
Short opportunities may also arise at resistance levels near 115.5k and 117.2k.
My BTC strategy continues to align with current market action. However, this is my personal view based on my trading approach. Always remain disciplined, manage risk, and follow your own plan.
What’s your outlook on BTC at this stage? Share your perspective in the comments below.

Gold – Weekly Opening UpdateGold – Weekly Opening Update
Hello traders,
Gold is holding steady after last week’s strong rally. As outlined in my earlier analysis, the metal has completed an ABC Elliott Wave structure, with wave C driving higher and achieving the projected target.
As the new week begins, the market has opened quietly, with price consolidating around 3368. This suggests accumulation, with traders waiting for a clear signal before taking action.
Gold has formed a minor resistance at 3359. If price breaks below this level, it could act as a short-term sell confirmation, with entries possible near 3366.
Alternatively, if price holds or breaks last week’s resistance high, the outlook shifts towards longer-term buying opportunities.
Even if a short plays out after 3359, the next significant buy zone sits near 3345, aligned with the ascending trendline.
Price remains within the flag pattern, meaning trading is still revolving around major liquidity zones. On the D1 chart, the broader structure continues to favour the upside bias. Any short trades should be treated as scalping opportunities only, to maintain the highest accuracy.
This is my personal outlook for Monday’s session. Stay disciplined, trade with structure, and manage risk effectively.
What’s your perspective on gold at the start of this week? Share your thoughts in the comments so we can learn together.

GOLD → Correction before continuing distribution to 3400FX:XAUUSD entered a correction phase at the start of the session after Friday's rally, triggered by positive fundamentals...
Gold is falling after Friday's rise, triggered by Powell's unexpectedly dovish comments in Jackson Hole. He confirmed the Fed's readiness to cut rates in September amid risks to employment and economic growth. The probability of a September rate cut has risen to 88%.
Gold is correcting after a sharp jump, but the downside potential is limited. Market attention is focused on PCE inflation data this week
Technically, the decline in gold prices may be temporary as the market continues to reassess the prospects for the Fed's dovish policy. The key factor will be Friday's PCE data, which will confirm or adjust expectations for an aggressive rate cut.
Support levels: 3358, 3350, 3340
Resistance levels: 3375, 3405
The 3358-3350 area acts as a strong support zone, and it is also worth paying attention to the previously broken downward consolidation resistance. The market may test the support zone before rising, and a false breakdown and consolidation above the support level could have a bullish impact on the market...
Best regards, R. Linda!

BITCOIN → Market potential change. Chance for growth to 125K...BINANCE:BTCUSDT , after a false breakdown of support, which we had been preparing for in my last idea, with the support of dovish hints from Powell, soared from 112K to 117K. What's next???
After Powell's speech and the shift in the fundamental background to positive, BTC broke the local bearish structure, forming a rally to 117K. The market exhausted its potential and, against the backdrop of the approaching weekend and a decline in liquidity, entered a correction phase. However, the relatively positive fundamental background should be taken into account when making further decisions. Lower interest rates could support the market...
Technically, after retesting the 112K zone and forming a false breakdown, Bitcoin changed market sentiment. The capture of liquidity and the breakdown of the local downward structure changes the technical situation in favor of buyers. Potential areas of interest could be 117.8, 120.27, and 125K
Resistance levels: 117K, 117.86K, 120.27K
Support levels: 114.6K, 111.9K
If, during the correction, the bulls manage to keep the price above the upper limit of the local trading range, i.e. above the downward channel and above the 114.600 zone, then interest in buying may increase. The market has the potential to test the resistance of the global trading range...
Best regards, R. Linda!

Bitcoin – Medium-Term AnalysisBitcoin – Medium-Term Analysis
Hello traders,
BTC made a strong breakout recently, reacting precisely at the 117k level as anticipated. At the moment, price is undergoing a correction, clearing liquidity from last Friday’s bullish candle. The firm rejection at 117k suggests we should reassess the medium-term structure.
The main scenario still favours the upside. The 113.4k zone is an attractive level for long entries, as buyers previously dominated this area and short-side liquidity remains in play. From a market psychology perspective, this could trigger short covering and push price towards 115.7k. A confirmed break above 117k would strengthen the medium- to long-term bullish outlook, opening the way for further long positions.
Alternatively, if price reacts lower from 115.7k, it may offer a medium-term short opportunity. Should support at 111.7k give way, BTC could extend down to 110k, a level that has seen multiple strong rejections in the past and could provide a solid base for renewed long positions.
This outlook is guided by support/resistance dynamics and major liquidity zones. Always trade with discipline and keep risk management as your priority.
What’s your perspective on BTC right now? Share your thoughts in the comments so we can refine our strategies together.

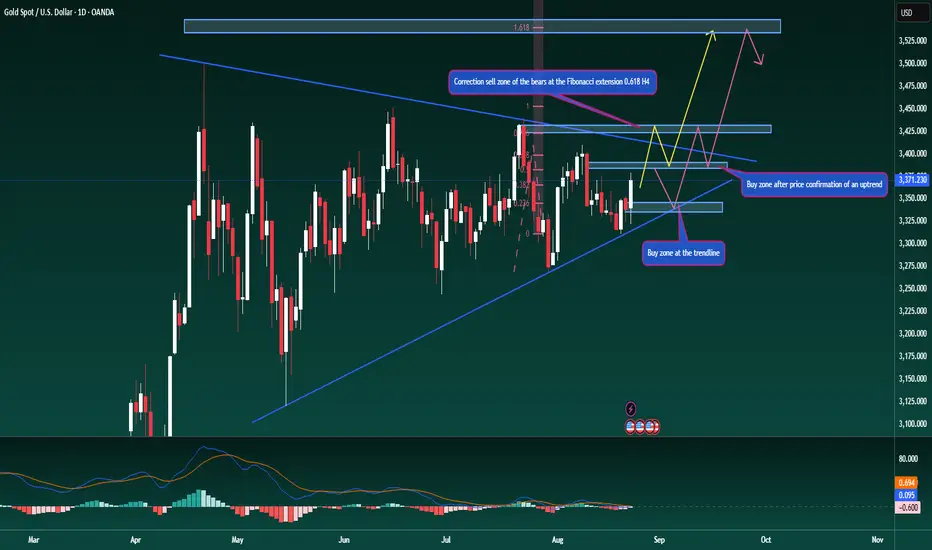
Gold at a turning point – breakout or pullbackGold Daily Chart – Final Week of August
Hello traders, let’s take a look at the gold outlook for the coming week.
Gold has continued to rally strongly after touching the ascending trendline on the D1 chart, in line with the outlook shared earlier. This bounce also makes the triangle pattern more valid. For the week ahead, trading is expected to remain within the 3330–3410 range, giving about 80 dollars of movement.
While the longer-term expectation is for gold to move towards fresh ATH levels, this will first require a confirmed breakout from the triangle. Once that happens, a minor pullback could occur before the next leg higher (as illustrated on my chart).
On the H4 chart, Friday’s rally has allowed us to plot a Fibonacci Extension, highlighting 3390 and 3430 as potential upside levels. These areas may act as short-term selling opportunities, driven by profit-taking from buyers.
On the daily timeframe, a successful breakout from the triangle could push gold towards 3540, marking a new ATH – this is the long-term scenario. On the other hand, if price pulls back, the ascending trendline near 3341 remains a logical level to consider fresh long positions.
Also note that this is the last week of August. On Friday, a liquidity grab is possible as large players rebalance and settle positions before month-end, so extra caution is advised.
This is my personal outlook for XAUUSD in the week ahead. I hope it provides value in shaping your trading plans.
What’s your view on gold right now? Share your thoughts in the comments so we can learn from each other.
GBPAUD Bearish Trend ContinuationDears,
This is my HTF 2RR trade idea for next week. I believe the chart is self-explanatory.
The price rejected a strong resistance after sweeping liquidity, and then the short-term uptrend has been broken, signaling a long-term downtrend continuation going forward.

Bitcoin Trendline Breakdown: The Pullback Trap Before Further DoBitcoin has officially broken its ascending trendline on the daily chart — a strong technical signal that the bullish momentum is weakening. Yesterday’s sharp pump was nothing more than a classic pullback to retest the broken trendline, and price is now showing signs of rejecting it.
From a price action perspective, this setup often acts as a trap for late buyers, with the market typically retracing the entire pullback move.
🔑 Key Points:
• Daily ascending trendline has been broken.
• Yesterday’s rally = pullback retest of the broken structure.
• Market likely to erase yesterday’s gains and resume downward momentum.
📊 Key Levels to Watch:
• Support 1: $112,000
• Support 2: $108,000
• Invalidation: A daily close back above yesterday’s high (~$117,000).
🎯 Trading Strategy:
• Wait for confirmation on lower timeframes (1H/4H) such as a CHoCH (Change of Character) or BOS (Break of Structure).
• Short entries become favorable if price fails to reclaim $117k.
• Initial targets: $112k → $108k.
• Keep stops above the recent swing high to control risk.
⚡ Summary:
The break + retest of the ascending trendline is a bearish sign. As long as BTC trades below the retest zone, the path of least resistance is down. Traders should stay patient, wait for proper entry signals, and avoid being trapped by the pullback.
⸻

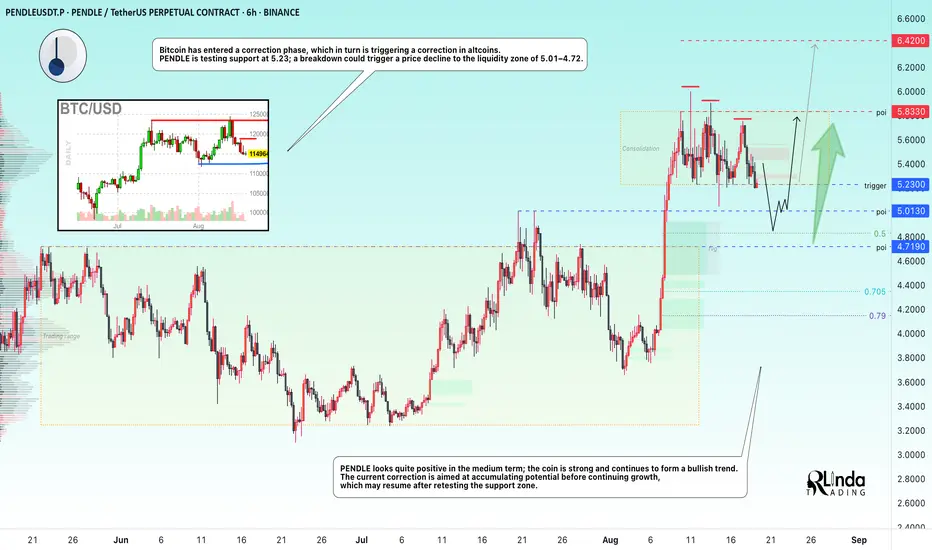
PENDLEUSDT → Retest of the 5.0 liquidity zone before rising to 7BINANCE:PENDLEUSDT is still consolidating, but is preparing to enter a correction phase, which could be triggered by a breakdown the 5.23 support level. Correction is a vital stage for further growth.
Bitcoin has entered a correction phase, which in turn is triggering a correction in altcoins. PENDLE is testing support at 5.23, and a break of this support level, which is already being tested for the sixth time, could trigger a price decline to the liquidity zone of 5.01 - 4.72
PENDLE looks quite positive in the medium term, the coin is strong and continues to form a bullish trend. The current correction is aimed at accumulating potential before continuing growth, which may resume after retesting the support zone.
Resistance levels: 5.833, 6.42
Support levels: 5.23, 5.013, 4.719
On the weekly chart, PENDLE is consolidating above the strong support level of 5.013. As part of the correction, the market may confirm this support and continue its growth towards the ATH from the mirror level.
Best regards, R. Linda!
Bitcoin Outlook – Breakout from the Downtrend ChannelBitcoin Outlook – Breakout from the Downtrend Channel
Hello traders,
BTC has broken out of its descending channel with a strong impulsive candle, in line with the corrective rally scenario. At present, price is reacting around 117k, confirming a clear structural shift. For the medium term, the dominant trend should now be viewed as bullish. Pullbacks towards 114.5k – 113k may provide attractive opportunities to add long positions.
From an Elliott Wave perspective, BTC appears to be in the final ABC sequence. The current leg is wave B, and traders should look to position long as wave C develops.
Upside targets: 120k – 121k, where a mild correction is likely as liquidity is cleared.
This is my personal perspective on Bitcoin. Stay disciplined, monitor price closely, and manage risk carefully.
What’s your outlook on BTC at this stage? Share your thoughts in the comments so we can refine our trading together.
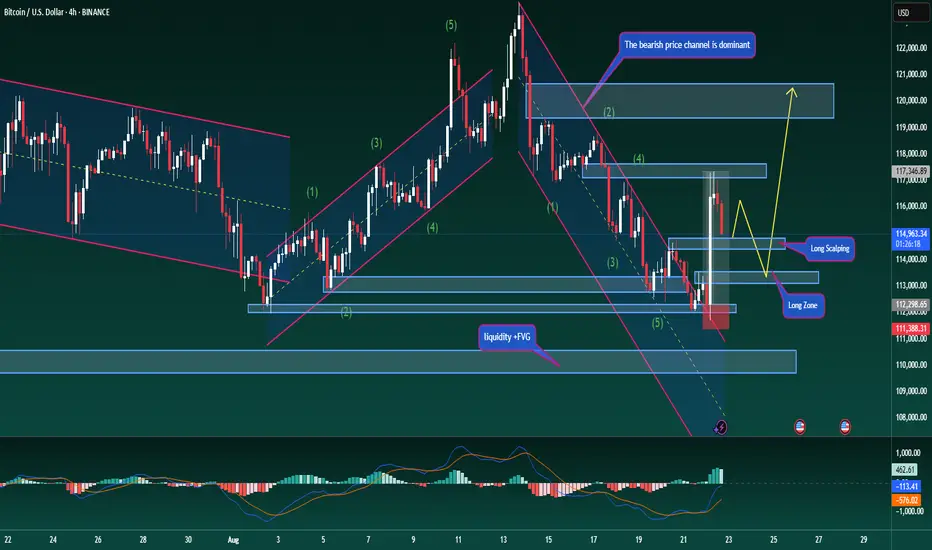
Bitcoin – Medium-Term Outlook for Long/Short TradersBitcoin – Medium-Term Outlook for Long/Short Traders
Hello traders,
BTC continues to respect the descending channel structure. Recently, price bounced strongly from the solid support around 112k, and it is now only about 2k away from the swing long target zone.
If BTC can break above the 114.8k resistance, a short-term reversal could unfold, with potential to extend towards 117.5k before resuming the broader downtrend. This scenario may also act as a trap for those holding longer-term short positions.
The structure is showing early signs of change: price is trading above the descending channel trendline, while MACD indicates rising volume and its moving averages are curving upward. These signals point to a possible corrective rally in the near term.
Strategy: Consider long entries near current levels, with the option to scale in if price breaks 114.8k.
Medium-term short positions from around 115k remain valid, targeting the 110k zone, which could also serve as a new accumulation area.
This is my personal view of the BTC market. Stay disciplined and manage risk accordingly.
What’s your outlook on Bitcoin here? Share your perspective in the comments below.
