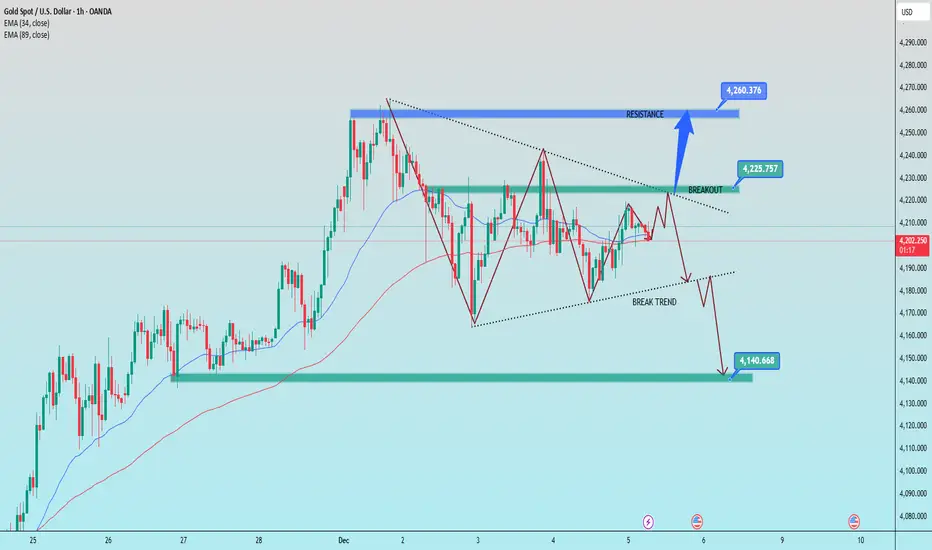
Gold price developments at the end of the week of December 51️⃣ Trend Line
Descent trend line (above – dashed line)
Price has been touched and rejected several times → becomes strong dynamic resistance.
The 4,225–4,230 price zone is a key area:
→ Valid breakout = opens upward momentum towards 4,260.
→ Failed breakout = price returns down following the previous trend.
Ascending trend line (below – dashed line)
This is dynamic support that maintains the short-term upward structure.
If price breaks through this trend line, a downtrend will activate.
2️⃣ Support Area – Key Resistance
4,225 – 4,230:
Confluence of the descending trend line + the previous supply zone → a designated area for buyers.
4,260 – 4,265:
Strongest resistance. When price touches this area, a downward reaction is likely.
Support
4,190 – 4,195:
The first area to be tested if the trend line is broken.
4,140 – 4,135 (lower green zone):
Very strong support – the main target if the downtrend is confirmed.
📌 Trading Signals
BUY GOLD: 4,140 – 4,138
Stop Loss: 4,130
Take Profit: 100 – 300 – 500 pips
SELL GOLD: 4,260 – 4,262
Stop Loss: 4,270
Take Profit: 100 – 300 – 500 pips
Trend Line Break
GOLD → Retest of consolidation support on uptrend FX:XAUUSD is trading in a sideways range around $4,200, awaiting new labor market data to determine the Fed's policy trajectory after December's rate cut.
Weak US data (a 32K decline in ADP employment and a slight increase in ISM services to 52.6) did not change market expectations. The probability of a 25 bp Fed rate cut on December 11 is around 90%. Attention has shifted to the trajectory of policy easing in early 2026. Key factors will be data on unemployment claims and sentiment on Wall Street.
The fundamental background is relatively positive, and the dollar has entered a correction phase due to expectations of lower rates, which may support the gold price...
Resistance levels: 4238, 4262
Support levels: 4185, 4175
Gold is testing the support levels of the key trading range. If the bulls keep the price above 4185 and form a bullish reversal pattern, then in the short and medium term, we can expect growth to intermediate highs.
Best regards, R. Linda!

Brian|watch reaction at POC–VAL –VAH according to Volume ProfileXAUUSD – Brian | watch reaction at POC – VAL – VAH according to Volume Profile
1. Market snapshot
Gold is entering a redistribution phase in the high price range, with fluctuations mainly revolving around large volume clusters on the Volume Profile. In this context, Brian's current priority scenario is to watch for a Sell when the price approaches the POC / VAL / VAH areas – where the market previously traded heavily.
2. Volume Profile – Notable price areas
POC – VAH area 4.217 is the price area where buyers/sellers previously "struggled" strongly, suitable for looking for sell signals if there is a rejection reaction.
VAL & the support area below around 4.134 is where short-term buying force may appear, suitable for a technical rebound buy scenario.
3. Trading plan (this week)
Scenario 1 – Sell according to Volume Profile (priority)
Sell: 4.217
SL: 4.125
TP: 4.200 – 4.182 – 4.150
Idea: wait for the price to rebound to the POC/VAH area around 4.217, observe the H1/M30 candle reaction. If a clear rejection signal appears (long upper tail, reversal candle...), the sell order can be activated according to the plan.
Scenario 2 – Short buy at VAL/support area
Buy: 4.134
SL: 4.125
TP: 4.155 – 4.180 – 4.200
Idea: if the price adjusts deeply near the VAL area and holds above 4.125, a technical rebound may occur. This is a short buy, not going too far against the trend, prioritizing partial profit-taking when the price returns to the upper POC area.
4. News to watch – Unemployment Claims
Today there are US Unemployment Claims figures, which are quite sensitive data for gold because:
The market will assess the strength/weakness of the US labor market.
Worse-than-expected figures → increase the likelihood of Fed easing → positive for gold.
Better-than-expected figures → support USD, may cause gold to face adjustment pressure.
Therefore, it is advisable to limit new orders close to the news release time, wait for the post-news candle to stabilize, and then reassess the structure.
5. Risk management (user-friendly for phone users)
Sell is the priority scenario but do not overlook SL 4.125, to avoid the case of a strong breakout above the current volume cluster.
With the Buy 4.134 scenario, it is advisable to split TP, move SL to breakeven when the price hits TP1 to reduce the pressure of having to "watch the chart" continuously on the phone.
If D1/H4 closes below the 4.125 area with large volume, Brian will consider it a signal to reduce short-term buying expectations and wait for a clearer new structure.

Gold plans in Asian and European trading sessions1️⃣ Trend Lines
• Descending Trend Line (Key Dynamic Resistance)
Price has touched this trend line several times but has not broken through, confirming that selling pressure remains dominant.
This is a crucial area: if a breakout does not occur, the price could potentially reverse sharply lower.
• Long-Term Ascending Trend Line
This is the main bullish structure in the market.
A larger decline will likely break through this trend line before the price reacts.
2️⃣ Resistance (Red Zone Above)
This is the intersection of:
✓ Descending Trend Line
✓ Nearest Local Peak (High)
This is the best sell zone under current market conditions.
Only if the price is able to close the candle with a strong breakout can a bullish reversal be confirmed.
3️⃣ Support (Green zone below)
This zone has been a recurring price reaction area, serving as important short-term support.
If the price breaks through this support zone, the downtrend will likely continue towards the long-term uptrend line.
📈 BUY GOLD: 4167 – 4165
Stop Loss: 4155
Take Profit: 100 – 300 – 500 pips
📉 SELL GOLD: 4264 – 4266
Stop Loss: 4276
Take Profit: 100 – 300 – 500 pips

EURUSD → Consolidation above downtrend resistance FX:EURUSD is attempting to reverse the trend amid expectations of interest rate cuts in the US. Important resistance at 1.165...
The dollar is breaking the support of the bullish trend amid expectations of interest rate cuts and news related to Powell. A decline in the index will support the euro exchange rate.
EURUSD is breaking the resistance of the downtrend, followed by bulls trying to keep the currency pair above 1.160, a psychological level. Against the backdrop of the dollar's decline, there is a chance of a breakout above 1.165 and growth
Resistance levels: 1.165 - 1.1656
Support levels: 1.159, 1.155
Before breaking through resistance, the market may consolidate or retest support. However, a breakout of 1.165 - 1.1656 and a close above this zone could trigger a distribution towards 1.173 - 1.182
Best regards, R. Linda!

GOLD → Correction to support amid a bullish trend FX:XAUUSD retreated from the $4,245 level reached on Monday. A countertrend correction is forming ahead of the news. But buyers are not sleeping...
Weak US economic data has heightened expectations of an imminent Fed rate cut. The PMI index in the US manufacturing sector continued to contract. The market estimates the probability of the Fed easing policy next week at 87%.
However, rising US Treasury yields and fears that the Fed may send cautious signals after its December decision are limiting gold's growth.
Market attention is shifting to ADP employment data and the US services business activity index (ISM Services PMI), which will be released on Wednesday. They will provide new signals about the health of the US economy.
The correction in gold appears to be under control amid continuing macroeconomic uncertainty. The 4200, 4193-4173 level remains an important area of struggle between bulls and bears.
Resistance levels: 4211, 4245
Support levels: 4193, 4173
A false breakdown and the bulls holding the market above the above support zone could trigger growth within the trend.
Best regards, R. Linda!

Gold price trend ahead of ADP news release on December 31️⃣ Trendline
▪ Rising Trendline (red / upward slope)
Price is moving within a bullish structure, continuously forming Higher Lows.
→ This acts as the main dynamic support guiding the uptrend.
Price is likely to retest this trendline around 4,145 before continuing upward.
▪ Falling Trendline (black / downward slope)
This is the major dynamic resistance, also overlapping with the extended Fibonacci zone.
→ The next potential touchpoint lies near the strong resistance area 4,300–4,340.
2️⃣ Key Support – Resistance Zones
▪ SUPPORT: 4,145 – 4,150
Confluence with EMA + trendline.
This is a high-probability zone where buyers are expected to defend the price.
▪ RESISTANCE: 4,335 – 4,340
Overlaps with the descending trendline.
Matches the 2.618 Fibonacci extension.
This is the main target of the current bullish structure.
→ A reaction or correction is expected when price reaches this area.
Trading Plan
BUY GOLD: 4145 – 4148
Stop Loss: 4135
Take Profit: 100 – 300 – 500 pips
SELL GOLD: 4260 – 4263
Stop Loss: 4270
Take Profit: 100 – 300 – 500 pips

XAUUSD–Volume Profile buy scenario around 4,200, target 4,265+XAUUSD–Volume Profile buy scenario around 4,200, target 4,265+
Brian – Prioritize buying with the trend, use VAL to position entry
Market snapshot
At the end of the US session yesterday, gold had a strong increase and then stabilized, currently moving sideways around 4,216 on H1.
The structure is still an uptrend, the current decline is mainly a technical correction within the value area.
On the chart, the 4,264–4,265 area is marked as important resistance, where if broken, the medium-term uptrend could be unleashed more strongly.
Volume Profile & key price areas
The VAL (Value Area Low) of the Volume Profile is currently around 4,200 – this is an area where the market has previously accepted a large volume of trades, suitable for trend-following buys.
A deeper support area is around 4,164 (Supportsides on the chart), where buyers have previously intervened very clearly.
Above: 4,265 – confirmed resistance, if broken will strengthen the scenario of gold heading to higher price areas, matching the "super cycle 5,000 USD" story in the long term.
Trading plan for next week (according to H1 & Volume Profile)
Priority scenario – Buy at VAL with the trend
Buying area: around 4,200 (VAL of Volume Profile).
Can flexibly range 4,198–4,203 depending on spread and market conditions.
Idea: wait for the price to pull back to the VAL area, observe H1 candle reactions (long lower tail, rejection candles...) before entering the order.
Immediate targets:
TP1: area 4,240–4,245
TP2: 4,265 – important resistance marked as "important resistance, confirming medium term increase".
If the price closes clearly above 4,265 and successfully retests, consider holding part of the position or finding additional entry points, according to the scenario of expanding to higher areas in the new cycle.
Defensive scenario – Deep support
If the 4,200 area does not hold, the 4,164 area will be the next support to watch.
Closing H1/D1 below 4,164 will be a signal to reduce short-term expectations and wait for a new structure instead of trying to "buy every dip".
Fundamental context – Reasons gold is still supported
Gold is heading for its best growth year since 1979, with an increase of over 60% in 2025 – this is the context of a true bull market, not just a recovery wave.
YTD performance of XAU outperforms BTC, showing that large capital flows prioritize stability and gold's safe haven role.
Current supporting factors: US bond yields cooling, USD weakening.
Geopolitical tensions escalating, Russia–US negotiations have not brought clear breakthroughs.
The market prices in nearly a 90% chance of the Fed cutting rates at the next meeting, making non-yielding assets like gold more attractive.
Follow Brian to share the Gold scenario together

EURJPY consolidating.EURJPY has been moving in a Range. Waiting for confirmation for a drop Back Down before or while getting into the London session.

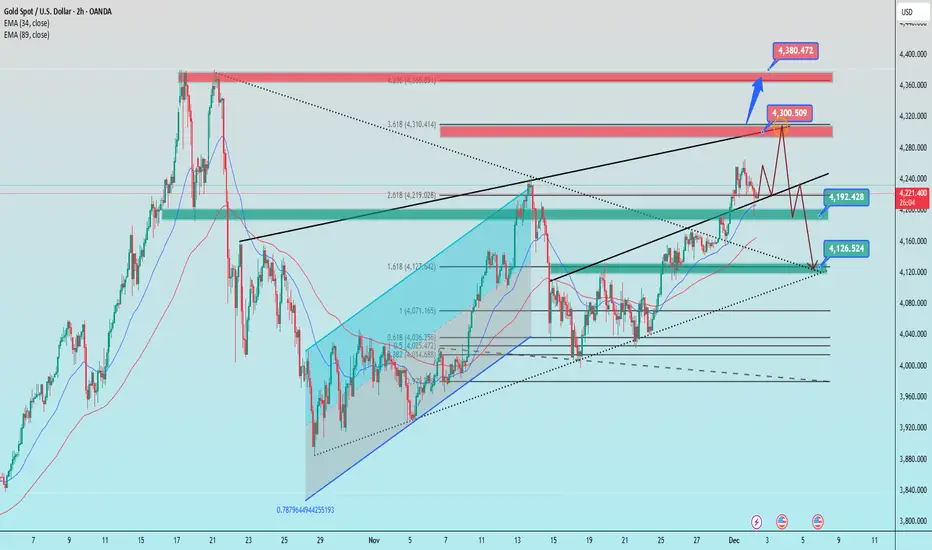
Scenario after the speech of the FED chairman on December 21️⃣ Trendline
Ascending trendline (lower black line)
This is the main dynamic support of the current trend.
Price is retesting the trendline after a strong bounce → holding above it keeps the bullish structure intact.
Descending trendline (upper black line)
A strong dynamic resistance from the higher timeframe, aligning with the 2.618 Fibonacci extension.
Price reacted and weakened when touching it → indicating selling pressure emerging.
2️⃣ Key Support & Resistance Zones
Resistance
4,300 – 4,315: Confluence of
✔ 3.618 Fibonacci extension
✔ Descending trendline
✔ Previous supply zone
→ This is the strongest reversal area.
Upside target if broken:
→ 4,375 – 4,380 (Fibo 4.236 + higher-timeframe supply zone).
Support
4,192 – 4,200:
✔ Demand zone
✔ Confluence with EMA + retest of ascending trendline
→ This is the short-term support.
4,125 – 4,130:
✔ Confluence with major ascending trendline
✔ 1.618 Fibonacci extension
→ This is the strong support – target if breakdown occurs.
3️⃣ Fibonacci Structure
The previous bullish wave completed a classic Fib extension pattern:
✔ 1.618 → 4,127
✔ 2.618 → 4,219
✔ 3.618 → 4,310
→ This reflects a fully extended wave, increasing the probability of a correction.
4️⃣ Price Scenarios
Scenario 1 (primary – correction expected)
Price rejects strongly at 4,300 →
🔻 Drops to 4,192 → if broken → moves toward 4,125 (major bounce zone).
Scenario 2 (bullish breakout)
If an H4 candle closes above 4,310, the move may extend toward 4,375 – 4,380.
Trade Ideas
BUY GOLD : 4193 – 4191
Stoploss: 4183
Take Profit: 100 – 300 – 500 pips
SELL GOLD : 4300 – 4303
Stoploss: 4313
Take Profit: 100 – 300 – 500 pips
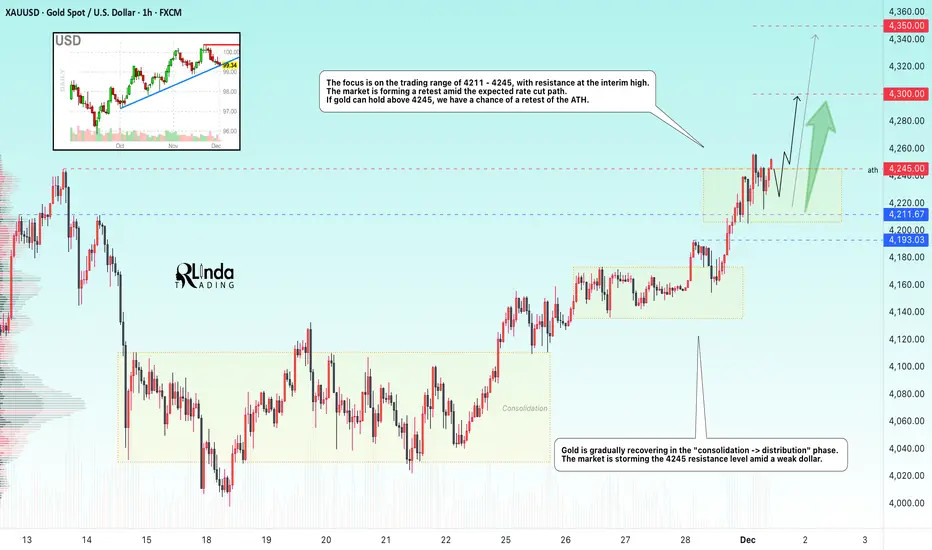
GOLD → The bullish trend continues. Retest of 4250FX:XAUUSD is trading at six-week highs near $4,250, supported by a weaker dollar and expectations of a Fed rate cut. The market is storming key resistance...
The probability of a December rate cut is 87%. The dollar is posting its worst week in four months after failing to consolidate above 100.0. A break in local trend support could trigger a decline in the index, which would support gold.
Today's focus is on the ISM Manufacturing PMI (forecast: 48.6). Weakness in the data could increase pressure on the dollar and support gold.
Gold maintains its upward trend, supported by loose monetary policy. Key data this week could boost momentum ahead of the Fed meeting.
Resistance levels: 4245, 4300
Support levels: 4211, 4193
A retest of 4245 could end with a pullback within the current consolidation at 4211 - 4245. Two scenarios: If the bulls hold the price above 4245, a rally to 4300 is expected. Otherwise, the market could retest 4215 - 4211 with the aim of a long squeeze before rallying. The trend is bullish, and the fundamental background is relatively positive.
Sincerely, R. Linda!
BTCUSD can crash to 24k if ABC correction occurs BTC experiencing the effect of Dead cross at 110000 USD ,which can drag upto 74500 and a support can take place due to price convergence and RSI divergence setup.
If price bounce backed from 74500 around ,then it can reach 0.386/0.618 around 106000 and 108000 USD.
A third try to breach 74500 can break the support and can take leap towards 24k making it drag down of 82% which BTC achieved back in 2017- 2018 .
Disclaimer: this is purely based on previous trends study and speculations according to price moments .i recommend to make your own study before investing or consult your financial advisor .

GBPUSD → Attempt to change the trendFX:GBPUSD is attempting a trend reversal. The likelihood of an interest rate cut is quite high, which could support the pound's rise.
The dollar is attacking the uptrend support level, failing to consolidate above 100.0. Ahead of the interest rate meeting, another rate cut could weaken the dollar, which in turn would support the pound sterling.
The currency pair is breaking downtrend resistance, and bulls are attempting to hold the price above 1.3191. A prolonged squeeze could shift the imbalance toward buyers, which in turn could trigger a rally.
Support levels: 1.3191, 1.3124
Resistance levels: 1.337, 1.353
The price has entered the trading range of 1.3191 - 1.3370. Consolidation is forming above key support, but the market may test this area of interest before continuing its rise at the European session's opening. A false breakdown and price holding above 1.3191 could support further growth.
Best regards, R. Linda!

How did gold move in the first week of December? CONCISE & COMPREHENSIVE TECHNICAL ANALYSIS
1. Trend Lines
Ascending trend line (lower black line)
This is the main dynamic support of the current uptrend structure.
The price has bounced off this trend line several times → the short-term trend remains bullish as long as this line is not broken.
Major descending trend line (upper black line)
This is strong dynamic resistance on larger time frames, and the price recently touched this area.
This is an area where selling pressure frequently arises.
2. Support – Resistance
Resistance
4,243–4,245 (red zone):
This is the confluence of the previous peak and the descending trend line → selling pressure appears right in this area.
4,315–4,320 (next major resistance):
If this area is broken, the price will likely head towards 4,375–4,380.
Support
4.147–4.150 (green zone confluence):
Confluence of moving averages, the nearest swing low, and Fibonacci levels → important support that maintains the bullish structure.
4.105–4.120 (lower trendline):
If the price breaks through this area → the short-term trend has the potential to turn bearish.
3. Fibonacci
Fibonacci 0.618 = 4.194
→ Area with a high probability of a rebound if the price corrects.
Fibonacci 0.5 = 4.135
→ Confluence with strong support + trendline → potential buy zone if a deeper pullback occurs.
4. Price Scenarios
Scenario 1 – Continue Upward (Priority)
If the price remains above 4,200–4,215, there is potential for a retest:
➡️ 4,230 → 4,315 → 4,375
Scenario 2 – Downward Correction
If the price breaks through 4,190 and breaks through the green zone of 4,144–4,150, then:
➡️ Risk of a downward movement towards the 4,105–4,120 trend line
📌 Trading Plan
BUY GOLD: 4,148 – 4,250
Stop Loss: 4,138
Take Profit: 100–300–500 pips
SELL GOLD: 4,313 – 4,315
Stop Loss: 4,325
Take Profit: 100–300–500 pip
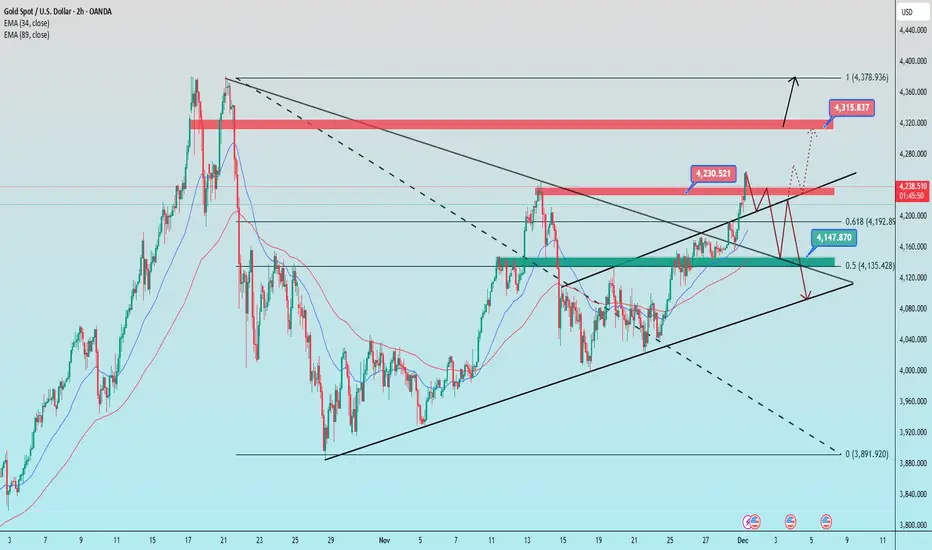
Will gold prices rise again in the new week?1️⃣ Trendline
Long-term descending trendline (upper black line)
Price has strongly broken above the long-standing descending trendline.
→ This signals a transition from a bearish phase to a medium-term bullish trend.
Short-term ascending trendline (small channel)
Price is moving inside a short-term ascending channel, consistently forming higher lows.
The recent breakout came with strong momentum → bullish strength is currently dominant.
2️⃣ Support – Resistance
Key Support Levels
4,111 – 4,108:
A confluence zone of the ascending channel’s bottom, EMA, and the 0.618 Fibonacci level → strong support if price pulls back.
4,145 – 4,150:
This is the breakout zone and will act as a retest support if price revisits it.
Key Resistance Levels
4,238 – 4,245 (Fibo 1.618 + previous structure high)
→ First major resistance zone. Price may consolidate or shake before breaking through.
4,375 – 4,380 (Fibo 2.618 + major upper zone, ATH area)
→ Large upside target if price breaks and holds above 4,245.
3️⃣ Fibonacci
The current upward swing is targeting the 1.618 Fibonacci extension at 4,238 – 4,245.
If this zone is broken and price closes above:
→ Next extension target is 2.618 Fibonacci near 4,375 – 4,380.
4️⃣ Trend Outlook
Trend: Short-term bullish → shifting to medium-term bullish after breaking the major descending trendline.
Key level to hold:
Above 4,145–4,150 = bullish continuation.
Upside targets:
4,238 – 4,245
4,372 – 4,380 (if bullish momentum continues)
Trading Plan
BUY GOLD: 4111 – 4108
Stop Loss: 4098
Take Profit: 200 – 400 – 700 pips
SELL GOLD: 4278 – 4281
Stop Loss: 4291
Take Profit: 200 – 400 – 700 pips

XAUUSD – Weekly Scenario: Target Expands to 4,580 RegionXAUUSD – Weekly Scenario: Target Expands to 4,580 Region
Brian – Only prioritize buying if the price remains above 3,996
1. Market Overview – Breaks Triangle, Confirms Uptrend
On the D1 frame, gold has clearly broken out of the accumulation triangle that lasted for weeks.
The sixth candle closed above the descending trendline – which has been the main resistance for a long time – indicating:
Buying power has returned to control the market.
There is a high probability that this is a confirmation of the medium-term uptrend.
Above, the 4,246 region is considered the next “trend confirmation point”:
If the price breaks and holds above 4,246, the path to higher regions, especially 4,360–4,380 and 4,560–4,580, will open according to the Fibonacci expansion roadmap on the chart.
In summary: moving into next week, the current structure supports the bullish scenario, viewing corrections mainly as opportunities to buy.
2. Technical Structure – From Breakout to Fibonacci Levels
The breakout from the triangle occurred after a series of higher lows, bouncing from the lower ascending trendline → leaning towards accumulation, not distribution.
Below the current price are important demand/support regions:
The trendline area around 4,110 – an area to watch for entry plans.
Deeper are the 4,040 and 3,920 regions if a strong correction occurs.
Above, the technical “roadmap” is quite clear:
Point 1: 4,246 – near resistance + retest of the old supply area.
Point 2: 4,360–4,380 – old ATH/peak area, coinciding with the 1.0 Fibonacci region on the chart.
Point 3: 4,560–4,580 – 1.618 Fibonacci region, also the expansion target for the medium-term bullish scenario.
As long as D1 maintains the higher high – higher low pattern and does not break 3,996, the priority remains to view gold in the “buy the dip” frame.
3. Price Zones & Trading Ideas for Next Week
This is not personalized advice, but how Brian is mapping the chart for himself:
Main Scenario – Buy on Trendline/Support
Watch area: around the ascending trendline area of 4,110.
If early in the week there is a correction to this area with a nice candle reaction on H4/D1 (long lower tail, bullish engulfing…), that is the area I prioritize for finding a Buy entry point.
Target roadmap:
Target 1: 4,246 – resistance & trend confirmation area.
If break & retest 4,246 successfully from above, the next bullish wave could expand to 4,360–4,380.
Extended Target: 4,560–4,580 according to 1.618 Fibonacci as shown in the image.
Secondary Scenario – Use Fibonacci Area When Price Exceeds 4,246
When gold exceeds and holds above 4,246, then the 4,360–4,380–4,580 areas will be:
Areas to partially take profit / move SL to protect profits.
At the same time, short pullbacks from this area, if still respecting the uptrend structure, can continue to be opportunities to buy more with the final target of 4,580.
Invalidation Level:
Closing D1 below 3,996 will ruin the current uptrend structure.
At that point, I will stop the medium-term buy strategy, stand aside to observe and wait for a new structure, instead of holding onto the old view.
4. Fundamental Perspective – Why is Gold Still Supported?
On the macro side, gold is being affected by the interplay of:
Tariffs & trade tensions → increasing demand for defense, hedging policy risks.
War and geopolitical conflicts → maintaining gold’s classic “safe haven” role.
End of interest rate cycle: after a long period of interest rates being “pumped” high, the market is increasingly focused on the question “when” rather than “if” they will decrease. This makes non-yielding assets like gold more attractive in the eyes of long-term capital.
Overall, the current fundamental picture is limiting the deep decline of gold: each strong drop often soon sees bottom-fishing buying power, as long as the technical structure is not broken.
5. Strategy & Risk Management
In the coming week, Brian’s bias is quite clear:
→ Prioritize buying on corrections, as long as the price remains above 3,996.
The trendline area around 4,110 is the first place I pay attention to for the buy scenario; if the market is “more generous” and pulls deeper to 4,040–4,000 but still maintains the uptrend structure, that is an even more attractive price for a medium-term position.
Most importantly:
The order volume must be suitable for the account.
Have a plan to move SL/take profit when the price approaches each point 4,246 → 4,360 → 4,580, instead of trying to “hold the peak.”

Bank holiday what will gold price be on 28 november 2025?1️⃣ Trendline
Ascending Trendline (red channel)
Price is moving inside a short-term ascending channel, forming higher highs and higher lows.
Recently touched the upper boundary → a technical pullback toward the lower boundary is likely.
Descending Trendline (red dotted)
This is a dynamic resistance from the higher timeframe.
Price has just broken above it; a retest is normal → creating a strong confluence area.
2️⃣ Key Support & Resistance
Resistance
4,240 – 4,245 (Fibo 1.618 + major supply zone)
→ This is the upside target if price continues to hold within the ascending channel.
Support 1 (nearest)
4,165 – 4,170 (trendline + MA + previous consolidation zone)
→ This zone is crucial for maintaining the bullish structure.
Support 2 (stronger)
4,095 – 4,112 (Fibo 0.5 – 0.618 + broad demand zone)
→ If Support 1 breaks, price may retrace deeply into this area.
3️⃣ Fibonacci Levels
Fibo 1.0 at 4,162 → currently the main retest point.
Fibo 0.618 at 4,111 → strong confluence with the major demand zone.
Fibo 1.618 at 4,245–4,255 → matches the top resistance → primary bullish target if the trendline holds.
4️⃣ Scenarios
Bullish Scenario (preferred)
If price holds above 4,165 – 4,170
→ it continues following the ascending channel → target 4,240 – 4,245.
Bearish Scenario
Break of the trendline + candle close below 4,165
→ confirms a correction phase → price likely moves down to 4,109 – 4,105.
Trade Ideas
BUY GOLD:
4165 – 4162
Stoploss: 4152
Take Profit: 100 – 300 – 500 pips
SELL GOLD:
4240 – 4243
Stoploss: 4250
Take Profit: 100 – 300 – 500 pips

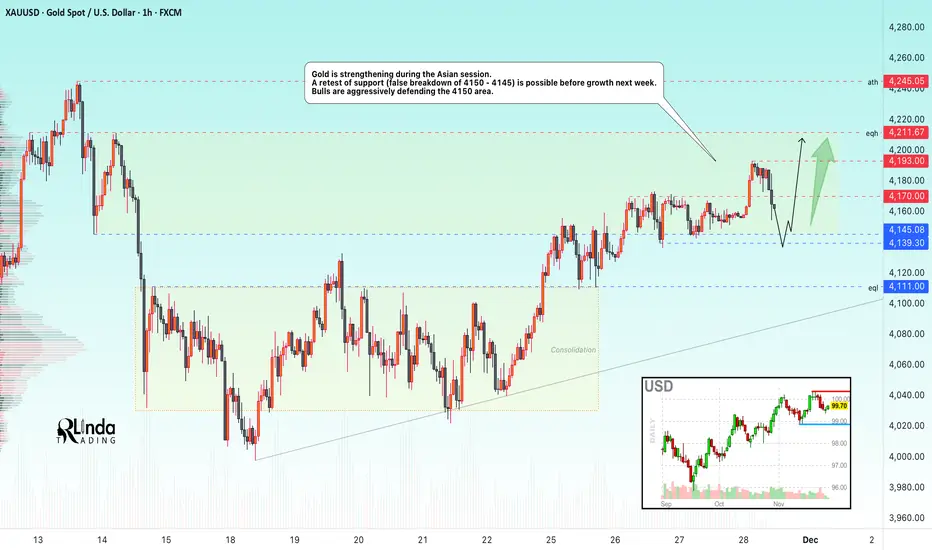
GOLD → Consolidation above 4150 amid a bullish market FX:XAUUSD breaks through 4170 and renews its high to 4193 during the Asian trading session. But further on, the market may consolidate before a possible continuation of growth...
The probability of a Fed rate cut in December remains at 82%. Geopolitical risks (Russia-Ukraine) continue to support demand for safe-haven assets. Weekly growth continues, but consolidation above $4170-4190 is required for the movement to continue.
However, low liquidity is expected on Thursday/Friday due to the holidays in the US. There may not be any strong movement, but volatility could be high during the European/American session...
Focus on the current trading range of 4150-4193...
Resistance levels: 4170, 4193, 4211
Support levels: 4150, 4145, 4139
The market is bullish both globally and locally. Accordingly, within the current trading range, gold may form a long squeeze relative to support and the liquidity zone at 4150. If the fundamental background does not change over the weekend, growth may continue next week...
Best regards, R. Linda!
Ethereum OUTCOME!ETH gained strength this week. Waiting to see if it will Break the TrendLine and Cross the Moving Average.

GOLD → Consolidation above the support level of the new rangeFX:XAUUSD is consolidating above 4150 but within the distribution phase after breaking through consolidation. The upward price movement is supported by the weakening of the dollar...
The metal remains on track for a fourth month of growth thanks to expectations of further Fed rate cuts and geopolitical tensions.
Despite strong US data, markets are still pricing in a 76-85% probability of a rate cut in December. The dollar is weakening, although yields are rising slightly.
Against the backdrop of the holiday week in the US, volatility may decrease and gold may consolidate. Talks about a possible peace between Russia and Ukraine could reduce demand for safe-haven assets, but the overall backdrop remains favorable for XAU/USD growth.
Resistance levels: 4170, 4211
Support levels: 4146, 4139
Gold is consolidating above the key support zone of 4140-4146. A long squeeze could trigger a shift in market imbalance in favor of buyers. If the bulls keep the price above 4150, this could trigger further growth, a breakout of 4170, and a retest of 4211.
Best regards, R. Linda!

EURUSD → Formation of an intermediate bottom...FX:EURUSD is forming a consolidation, which hints at a halt in the downward correction. The market is waiting for news that could trigger strong movements...
The dollar is pausing and moving into consolidation. If the index enters a correction phase, the euro will go up. A breakout of 1.155 could confirm a change in the local trend and trigger a rally.
The price is trading within a downward price channel; locally, the market is not ready to update the low and is consolidating above 1.150 and 0.7f. Accordingly, the focus is on the current consolidation: 1.150 - 1.155
Resistance levels: 1.155, 1.1606
Support levels: 1.1524, 1.1502, 1.1473
The price is currently consolidating, which means that the market is preparing for possible movements. A breakout of one or another boundary could trigger a rally. A breakout of resistance will confirm a change in the local trend. However, a breakout of support could trigger a continued decline to 1.1473.
Best regards, R. Linda!

XAUUSD – Ascending channel in play, eyes on the 4,240 regionXAUUSD – Ascending channel in play, eyes on the 4,240 region
Brian – Buying the dip within structure, watching for a fade at higher resistance
Market overview & structure
On the H4 chart, gold is trading neatly inside a well-defined ascending channel, printing higher highs and higher lows. The current leg is pushing up towards the 4,237–4,240 area, which lines up with:
The upper boundary of the channel
A key resistance zone
The 1.618 Fibonacci extension and resting liquidity above recent highs
So for now, the broader bias remains bullish, but as price creeps closer to 4,240, the risk of profit-taking and short-term selling naturally increases.
Wave & technical context
This move is an extension of the previous bullish structure after price broke out of the old descending channel and started to build a new bullish one.
Liquidity levels around 4,193 and above suggest the market has been building positions and still has room to drive price into the higher resistance band.
The buy zone around 4,154–4,157, near the lower edge of the channel, is where buyers are likely to step back in to defend the trend.
As long as price holds above 4,150–4,154, the continuation scenario towards 4,240 remains the higher-probability path.
Key zones & trading plan
Primary scenario – Buy with the trend
Buy zone: 4,154–4,157 (channel support + marked buy zone).
Idea: Wait for a pullback towards the lower boundary of the channel, or a brief liquidity sweep into this region, then look for a clear rejection candle on H1/H4 before going long.
Targets:
Short term: 4,190–4,200 (mid-channel / interim liquidity).
Extended: 4,237–4,240 (major resistance + 1.618 Fib extension).
This is a trend-following “buy the dip” setup, more suited to swing and short-term position traders rather than scalpers.
Secondary scenario – Short-term fade from 4,237–4,240
Sell zone: 4,237–4,240 – confluence of strong resistance and the 1.618 Fibonacci extension.
Idea: If price tags this zone and shows clear rejection (long upper wicks, bearish reversal pattern on H1/M15), it may offer a counter-trend short back towards the middle of the channel or the 4,190–4,200 support area.
As this is a counter-trend play:
Keep position size smaller than the main long idea.
Use a tight stop above 4,240 and avoid widening it out of emotion.
Macro and liquidity backdrop
Liquidity is likely to thin out towards the end of the session with the US Thanksgiving period in play, which can lead to the odd sharp spike or stop-hunt, especially around obvious liquidity pools.
On the political front, headlines such as Mr Trump’s comments about “permanently suspending immigration from third-world countries” add to broader policy uncertainty, but the impact on gold is indirect via risk sentiment rather than a direct driver.
It’s also worth noting that silver has been rallying strongly, supported by solar-related demand and supply concerns – a bit of a “silent workhorse” at the moment. That doesn’t remove gold’s role, but it does show that precious metals as a whole are attracting capital.
Strategy & risk management
For now, my focus is on buying dips around 4,154–4,157 in line with the ascending channel, and only looking for tactical shorts if price clearly rejects the 4,237–4,240 band.
I prefer not to open fresh trades when US liquidity is extremely thin or straight into major holiday sessions, as spreads can widen and price can behave erratically.
If we see a decisive close below the buy zone and a clean break of the channel structure, this bullish plan is invalidated – at that point it’s better to step aside and reassess rather than forcing trades.
What do you reckon – does this structure still favour the bulls, or are you leaning towards a deeper correction from the 4,240 region? Feel free to share your view in the comments.

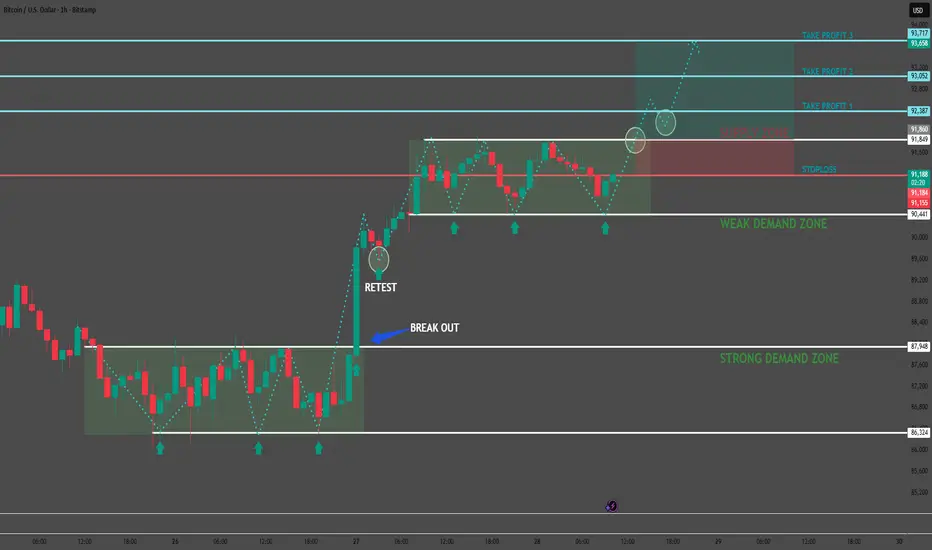
Bitcoin Loading a Breakout Continuation 📌 TECHNICAL ANALYSIS — BTC/USD (1H)
The market continues to maintain a clear bullish structure, with a consistent sequence of higher lows (HL) forming directly inside the Weak Demand Zone. After breaking out of the previous consolidation range, price delivered a clean retest, followed by a strong impulsive move upward confirming solid buy-side absorption.
🎯 PRIMARY SCENARIO — Continuation to the Upside
- As long as price holds above 90,850, the bullish structure remains intact.
- The Weak Demand Zone continues acting as a launchpad for bullish continuation.
- A decisive break above 92,387 will likely accelerate momentum and open the door for extended upside targets.
📈 TRADE SETUP (Precision Levels)
- Buy Entry: 91,250 – 91,350
(A pullback into equilibrium before continuation)
- Stop Loss: 90,850
(Protected below demand + previous swing low to avoid noise)
- Take Profit Levels:
TP1: 92,387
TP2: 93,052
TP3: 93,717
📌 TRADE RATIONALE
- The market is printing a textbook Higher High – Higher Low structure.
- Breakout followed by a clean retest confirms trend continuation.
- Demand zones show strong absorption — no lower lows created.
- Clear liquidity void above → high probability for price expansion into higher targets.
- The supply structure above is thin, increasing the likelihood of a breakout.
🔍 SUMMARY
BTC is currently behaving exactly as expected within a bullish continuation model.
As long as 90,850 holds, upside projection toward 92,387 → 93,717 remains the highest-probability scenario.
Stay disciplined — every candle tells a story, but only a patient trader profits from the ending.
Share your thoughts in the comments — what’s your bias on the next move?