Derivatives Are Powerful in the Global MarketIntroduction
In the vast and intricate world of finance, derivatives stand out as some of the most powerful and influential instruments driving global markets. These complex financial contracts derive their value from the performance of underlying assets such as stocks, bonds, commodities, interest rates, currencies, or market indices. Over the past few decades, derivatives have transformed the global financial landscape, enabling investors, corporations, and governments to manage risk, enhance returns, and access new opportunities. However, their complexity and leverage potential have also made them subjects of controversy, as they can amplify both gains and losses. This essay explores the nature of derivatives, their types, their importance in the global market, and how they influence international trade, investment, and financial stability.
Understanding Derivatives
The term derivative originates from the word “derive,” meaning that the instrument’s value is dependent on something else. In essence, a derivative is a financial contract whose value is based on the price of an underlying asset. Derivatives are typically used for three main purposes: hedging, speculation, and arbitrage.
Hedging:
Hedgers use derivatives to reduce or eliminate the risk of price fluctuations in the underlying asset. For example, a wheat farmer might use futures contracts to lock in the selling price of wheat months before the harvest, ensuring income stability despite potential market volatility.
Speculation:
Speculators, on the other hand, use derivatives to profit from expected changes in the market value of the underlying asset. They do not necessarily own the asset but anticipate price movements to gain from them.
Arbitrage:
Arbitrageurs use derivatives to profit from price discrepancies between markets or instruments. They buy in one market and sell in another to take advantage of temporary inefficiencies.
Types of Derivatives
Derivatives can be traded either on exchanges (standardized and regulated) or over-the-counter (OTC) (customized and privately negotiated). The four main types of derivatives are:
Futures Contracts:
Futures are standardized agreements to buy or sell an asset at a predetermined price on a specific date in the future. They are widely used for commodities like oil, gold, and agricultural products, as well as for financial assets.
Forward Contracts:
Forwards are similar to futures but are privately negotiated between two parties and not traded on an exchange. They are customizable in terms of quantity, price, and settlement date.
Options Contracts:
Options give the holder the right, but not the obligation, to buy (call option) or sell (put option) an underlying asset at a predetermined price before or on a certain date. They are powerful tools for both hedging and speculative strategies.
Swaps:
Swaps involve the exchange of cash flows between two parties, often based on different financial instruments. The most common types are interest rate swaps, currency swaps, and credit default swaps (CDS).
Growth of the Global Derivatives Market
The global derivatives market has grown exponentially since the 1980s. Today, it represents a notional value of hundreds of trillions of dollars, making it one of the largest components of the financial system. The expansion has been driven by globalization, technological innovation, financial liberalization, and the growing need for risk management tools among corporations and investors.
According to data from the Bank for International Settlements (BIS), the notional amount of OTC derivatives alone exceeds $600 trillion. Exchange-traded derivatives (ETDs) are also massive, with daily volumes in futures and options numbering in the millions. This growth reflects the increasing reliance of global market participants on derivatives to manage exposure to interest rates, currencies, commodities, and equity prices.
Derivatives as Tools for Risk Management
One of the most significant contributions of derivatives to the global market is risk management. Businesses and investors face various forms of risk—price, interest rate, credit, and currency risk—that can affect profitability and stability. Derivatives provide mechanisms to transfer or mitigate these risks.
Currency Risk:
Multinational corporations use currency forwards and swaps to hedge against fluctuations in foreign exchange rates. For example, an Indian exporter earning in U.S. dollars can use derivatives to lock in exchange rates and protect revenue from depreciation of the dollar.
Interest Rate Risk:
Banks and companies use interest rate swaps to manage exposure to changing interest rates. By exchanging fixed-rate and floating-rate payments, they can stabilize financing costs or returns.
Commodity Price Risk:
Producers and consumers of commodities use futures contracts to secure prices. Airlines, for example, use oil futures to hedge against rising fuel prices, ensuring predictable operating costs.
Through these mechanisms, derivatives contribute to financial stability by providing certainty and predictability in cash flows, even in volatile environments.
Enhancing Liquidity and Market Efficiency
Derivatives play a vital role in improving market liquidity and efficiency. By enabling investors to take positions without directly trading the underlying asset, derivatives increase the depth of the market. For instance, stock index futures and options allow investors to gain or hedge exposure to entire markets without trading individual stocks. This efficiency attracts institutional investors and promotes active participation across global exchanges.
Moreover, derivatives markets facilitate price discovery—the process of determining the fair value of an asset. The continuous trading of futures and options reflects the collective expectations of market participants about future price movements. This helps align prices across markets and reduces information asymmetry.
Speculation and Profit Opportunities
While derivatives are often used for hedging, they are equally attractive to speculators seeking to profit from market volatility. The leverage embedded in derivatives allows traders to control large positions with relatively small capital. For instance, buying an option requires only a fraction of the cost of the underlying asset, but potential profits (and losses) can be substantial.
Speculative trading, when done responsibly, enhances market liquidity and efficiency. Speculators absorb risk from hedgers, providing them with the counterparties necessary for risk transfer. However, excessive speculation can lead to bubbles or destabilizing volatility, as witnessed during the 2008 global financial crisis.
Derivatives in Global Financial Integration
Derivatives are at the heart of global financial integration. They connect markets across continents and allow capital to flow more freely. Through currency and interest rate swaps, international investors can manage cross-border risks and invest in foreign markets with confidence.
Global corporations rely on derivatives to operate efficiently in multiple countries. For example, a U.S.-based company investing in European projects might use currency forwards to hedge euro exposure, while using interest rate swaps to adjust financing costs in line with U.S. benchmarks. This interconnected web of derivative transactions supports global trade and investment, making derivatives indispensable to modern globalization.
Derivatives and the 2008 Financial Crisis
Despite their benefits, derivatives have also been associated with systemic risks. The 2008 financial crisis exposed the darker side of derivative misuse, particularly in the credit derivatives market. Instruments like credit default swaps (CDS) were used to insure against default risk on mortgage-backed securities. However, the complexity and opacity of these products led to massive losses when underlying assets (subprime mortgages) collapsed.
Institutions like Lehman Brothers and AIG faced devastating losses due to excessive exposure and inadequate risk management. The crisis revealed the dangers of leverage, interconnectedness, and lack of transparency in OTC derivatives markets.
In response, regulators introduced reforms such as central clearinghouses, higher capital requirements, and reporting obligations to enhance oversight and reduce systemic risk. These measures have made today’s derivatives markets more transparent and resilient.
Technological Advancements and Derivatives Trading
Technology has revolutionized the way derivatives are traded globally. The rise of electronic trading platforms, algorithmic trading, and blockchain technology has enhanced speed, transparency, and efficiency in derivatives markets. Exchange-traded derivatives are now accessible to a broader range of participants, from institutional investors to retail traders.
Moreover, the introduction of financial derivatives based on new asset classes—such as cryptocurrencies, carbon credits, and volatility indices—has expanded the frontier of derivative innovation. For instance, Bitcoin futures and options have allowed institutional investors to manage crypto exposure while maintaining compliance with regulatory standards.
Derivatives and Emerging Markets
In emerging economies like India, China, and Brazil, derivatives markets have become critical components of financial development. They offer mechanisms for managing currency volatility, commodity prices, and interest rate fluctuations—issues that are often more pronounced in developing nations.
India’s National Stock Exchange (NSE) and Bombay Stock Exchange (BSE) have developed vibrant derivatives markets, particularly in index futures and options. These instruments attract global investors and contribute to capital market growth, making emerging markets more integrated into the global financial ecosystem.
Challenges and Risks in the Derivatives Market
Despite their power, derivatives come with inherent risks that must be carefully managed:
Leverage Risk:
Small changes in the price of the underlying asset can result in large gains or losses due to leverage.
Counterparty Risk:
In OTC markets, the risk that one party defaults on the contract can lead to cascading failures.
Liquidity Risk:
In times of market stress, derivative positions may become difficult to unwind, leading to forced losses.
Complexity:
Some derivatives are highly complex and difficult to value, making them prone to misuse.
Systemic Risk:
The interconnected nature of derivatives markets can transmit shocks across institutions and borders, threatening global financial stability.
Regulation, transparency, and proper risk management are therefore essential to harnessing the benefits of derivatives without endangering the system.
The Future of Derivatives in the Global Market
Looking ahead, derivatives are likely to play an even greater role in shaping the future of finance. The rise of environmental, social, and governance (ESG) investing has led to new forms of derivatives such as carbon emission futures and climate swaps, designed to manage sustainability-related risks. Likewise, AI-driven analytics and machine learning models are being used to optimize derivative pricing, risk management, and trading strategies.
As the global economy becomes increasingly interconnected and digitized, derivatives will continue to serve as vital tools for managing uncertainty, improving liquidity, and enhancing market efficiency.
Conclusion
Derivatives are undeniably powerful instruments in the global market. They enable participants to manage risk, speculate efficiently, and facilitate cross-border capital flows. By enhancing liquidity, supporting price discovery, and integrating global markets, derivatives have become indispensable to modern finance. Yet, their power demands responsibility; misuse can have catastrophic consequences, as history has shown.
With sound regulation, technological innovation, and prudent risk management, derivatives can continue to drive global financial progress—empowering businesses, investors, and economies to navigate the complex landscape of the 21st-century marketplace with greater stability and precision.
Trend Line Break

Fluctuation Effects on the Global EconomyIntroduction
The global economy is a dynamic and interconnected system that continuously experiences fluctuations due to various internal and external factors. Economic fluctuations — often referred to as business cycles — involve alternating periods of expansion and contraction in economic activity, influenced by changes in market forces, monetary policies, trade dynamics, technological innovations, and geopolitical developments. These fluctuations impact every aspect of the world economy, including employment levels, inflation rates, investment flows, international trade, and overall economic stability. Understanding how these fluctuations affect the global economy is crucial for investors, policymakers, and businesses seeking to navigate uncertainty and maintain stability.
1. Understanding Economic Fluctuations
Economic fluctuations refer to the unpredictable variations in key macroeconomic indicators such as GDP growth, inflation, interest rates, and employment. These fluctuations are not always harmful; they represent natural movements in response to supply-demand shifts, innovation cycles, and consumer confidence.
1.1 Business Cycles
Business cycles typically include four phases:
Expansion: Characterized by increasing production, employment, and consumer spending.
Peak: The economy operates at full capacity, often leading to inflationary pressures.
Contraction (Recession): Decline in output, demand, and investment, often resulting in job losses.
Trough: The lowest point before recovery begins.
1.2 Causes of Economic Fluctuations
Economic fluctuations are caused by multiple factors:
Monetary and fiscal policy shifts
Commodity price volatility (especially oil and gas)
Technological disruptions
Global trade imbalances
Financial crises and capital flows
Geopolitical tensions
Natural disasters or pandemics
These elements interact in complex ways, creating ripple effects across the world economy.
2. Impact on Global Trade and Investment
One of the most direct consequences of economic fluctuations is their effect on global trade and investment. When major economies experience instability, their trading partners face repercussions as well.
2.1 Trade Volume Volatility
During periods of expansion, demand for imports rises as consumers and industries require more goods and raw materials. Conversely, recessions reduce purchasing power and decrease international trade. For instance, the 2008 global financial crisis caused global trade to contract by nearly 12% in 2009, marking one of the steepest declines in modern history.
2.2 Foreign Direct Investment (FDI)
Fluctuations influence investor confidence. During booms, foreign investors channel funds into emerging markets, seeking higher returns. However, in uncertain times, investors retreat to safe-haven assets like gold, U.S. Treasury bonds, or stable currencies such as the U.S. dollar and Swiss franc. Such movements create capital flight from developing economies, reducing growth potential.
2.3 Exchange Rate Instability
Economic fluctuations often trigger exchange rate volatility. For example, when a country experiences inflation or a balance of payment deficit, its currency value declines. This impacts export competitiveness and import costs, influencing inflation and consumption globally. Exchange rate fluctuations thus act as both a symptom and a catalyst of broader economic cycles.
3. Employment and Income Inequality
Economic fluctuations deeply influence labor markets and income distribution across countries.
3.1 Employment Cycles
In expansionary phases, companies hire more workers to meet rising demand, reducing unemployment and increasing wages. However, recessions often lead to layoffs, wage cuts, and higher job insecurity. Millions of workers globally lost their jobs during the COVID-19 pandemic recession, highlighting how fluctuations can rapidly alter employment landscapes.
3.2 Wage and Income Inequality
Fluctuations tend to worsen income inequality. High-skilled workers and capital owners recover quickly during upturns, while low-skilled laborers face longer unemployment spells. Moreover, automation and digitization, which often accelerate during downturns, can replace labor-intensive jobs, widening wage disparities within and across nations.
4. Inflation, Deflation, and Price Instability
Fluctuations have a direct impact on price stability, which is essential for economic predictability.
4.1 Inflationary Pressures
During economic expansions, strong demand can outpace supply, leading to inflation. Moderate inflation encourages spending and investment, but excessive inflation — like the hyperinflation seen in Zimbabwe or Venezuela — erodes purchasing power and destabilizes the economy.
4.2 Deflationary Risks
Conversely, during recessions, falling demand can cause deflation — a sustained drop in prices. Deflation discourages consumption and investment, as people delay purchases expecting further price falls. Japan’s “Lost Decade” (1991–2001) is a prime example of prolonged deflation stalling economic growth.
4.3 Commodity Price Fluctuations
Oil, gas, metals, and agricultural products often experience sharp price swings. These fluctuations affect both producers and consumers globally. For instance, a sudden spike in oil prices increases transportation and manufacturing costs, leading to inflationary pressures worldwide.
5. Effects on Financial Markets
Financial markets are extremely sensitive to economic fluctuations. Investors continuously adjust their portfolios based on perceived risks and returns.
5.1 Stock Market Volatility
Economic uncertainty increases volatility in global stock indices. During downturns, corporate earnings decline, leading to market sell-offs. For example, the 2020 pandemic crash wiped out trillions in global market capitalization within weeks. Conversely, strong recovery expectations can drive rapid market rallies, as seen in 2021.
5.2 Bond Markets
Interest rate fluctuations, driven by central bank policy responses, affect bond yields. In times of recession, central banks cut rates to stimulate borrowing, pushing bond prices up. During inflationary periods, higher interest rates cause bond prices to fall.
5.3 Currency and Crypto Markets
Exchange rates and digital currencies also reflect economic fluctuations. Investors flock to stable currencies during uncertainty, while risk appetite during recoveries often boosts speculative assets like cryptocurrencies.
6. Policy Responses to Economic Fluctuations
Governments and central banks play crucial roles in mitigating the adverse impacts of economic fluctuations.
6.1 Monetary Policy
Central banks use tools such as interest rate adjustments, quantitative easing (QE), and reserve requirements to stabilize the economy. Lowering rates encourages borrowing and investment during recessions, while raising rates helps control inflation during booms. For instance, during the 2008 financial crisis, the U.S. Federal Reserve implemented QE to inject liquidity and support recovery.
6.2 Fiscal Policy
Governments use spending and taxation to influence economic activity. During downturns, expansionary fiscal policy — such as infrastructure spending and tax cuts — stimulates demand. Conversely, contractionary fiscal measures help control overheating during rapid expansions.
6.3 International Coordination
Because modern economies are interconnected, international institutions like the IMF, World Bank, and G20 play key roles in coordinating responses to global fluctuations. During the COVID-19 crisis, global stimulus packages totaling over $14 trillion were deployed to stabilize financial systems and support recovery.
7. Sectoral Impacts of Fluctuations
Different sectors of the economy respond differently to fluctuations.
7.1 Manufacturing and Trade
Manufacturing and trade sectors are highly sensitive to demand shifts. Recessions reduce exports and industrial production, whereas recovery phases trigger rapid rebounds in supply chains and production.
7.2 Technology and Innovation
Economic uncertainty often accelerates technological innovation, as companies seek efficiency. For example, digital transformation and automation surged during the pandemic as businesses adapted to remote operations.
7.3 Real Estate
Fluctuations impact property values, mortgage rates, and construction activity. Booming economies raise housing prices, while recessions lead to declines in real estate demand and construction investments.
7.4 Energy and Commodities
Commodity-based economies, such as those of Russia, Saudi Arabia, or Brazil, experience strong cyclical effects due to volatile global prices of oil, metals, and agricultural products.
8. Global Inequality and Regional Divergence
Economic fluctuations often exacerbate global inequality. Developed economies typically have stronger institutions, diversified industries, and better fiscal capacity to absorb shocks. In contrast, developing countries rely heavily on exports or commodities, making them more vulnerable to downturns.
8.1 Emerging Markets Vulnerability
When global interest rates rise, emerging markets face capital outflows, currency depreciation, and higher borrowing costs. For example, when the U.S. Federal Reserve tightens policy, many emerging markets experience economic slowdowns.
8.2 Regional Recovery Gaps
The pace of recovery also varies by region. Advanced economies often rebound faster due to stimulus support and technological strength, while low-income nations face delayed recoveries due to limited fiscal space and debt burdens.
9. Psychological and Behavioral Effects
Economic fluctuations also have psychological consequences for consumers and investors.
Consumer Confidence: People spend less when they feel uncertain about the future, deepening recessions.
Investor Sentiment: Fear and speculation drive market volatility. Behavioral biases often cause overreactions to news and policy changes.
Corporate Behavior: Companies may delay expansions, acquisitions, or R&D investments due to uncertainty, affecting long-term innovation and productivity.
10. Future Outlook: Managing Global Economic Fluctuations
As globalization deepens, economic fluctuations are likely to become more interdependent. The future global economy will be influenced by factors such as:
Technological transformation (AI, automation, digital finance)
Climate change and green energy transition
Geopolitical realignments
Debt sustainability and financial regulation
Policymakers must adopt forward-looking strategies, including:
Strengthening financial safety nets
Promoting inclusive growth
Enhancing transparency and international coordination
Diversifying economies to reduce vulnerability to global shocks
The world needs resilient systems that can withstand fluctuations without causing widespread human and economic hardship.
Conclusion
Fluctuations are an inevitable feature of the global economic landscape. While they bring challenges such as unemployment, inflation, and inequality, they also create opportunities for innovation, reform, and structural transformation. The key lies in how nations, institutions, and individuals respond to these changes. Effective policy coordination, sound financial management, and adaptive business strategies can mitigate adverse impacts and harness positive momentum. Ultimately, understanding and managing economic fluctuations is essential for achieving long-term stability, sustainable growth, and global prosperity.

Global Finance Control on Central BanksIntroduction
Central banks are the cornerstone of a nation’s monetary and financial stability. They regulate the money supply, manage interest rates, maintain price stability, and act as lenders of last resort during crises. Examples include the Federal Reserve (U.S.), the European Central Bank (ECB), the Bank of Japan (BoJ), and the Reserve Bank of India (RBI). However, in today’s deeply interconnected global economy, the autonomy of central banks is not absolute. They operate within a global financial system heavily influenced by international capital flows, global trade dynamics, foreign exchange markets, and powerful multinational institutions.
The control of global finance over central banks is a topic of major debate among economists and policymakers. While central banks are officially independent, their actions are shaped by the pressures and movements within global markets. Understanding this interplay is critical to analyzing how global economic policies are formed and how nations maintain financial sovereignty.
1. The Role and Functions of Central Banks
Central banks serve several core functions within national economies:
Monetary Policy Implementation – They regulate interest rates and control money supply to achieve economic stability.
Price Stability and Inflation Control – Ensuring that inflation remains within target levels protects the value of money and public confidence.
Financial Stability and Regulation – Central banks oversee financial institutions to prevent systemic crises.
Foreign Exchange Management – They manage exchange rates, foreign reserves, and currency interventions.
Lender of Last Resort – During financial distress, central banks provide emergency liquidity to banks and financial institutions.
Economic Growth Promotion – By influencing credit availability and investment, central banks indirectly promote growth and employment.
In theory, these functions are carried out independently from political or external influences. However, in the era of globalized finance, maintaining such independence has become increasingly difficult.
2. The Global Financial System and Its Influence
The global financial system is a web of interconnected markets and institutions, including international banks, hedge funds, multinational corporations, and supranational organizations such as the International Monetary Fund (IMF) and World Bank. It is characterized by:
Cross-border capital flows
Global investment funds and currency trading
Interconnected banking networks
International debt and credit markets
Global rating agencies and financial intermediaries
These elements create a financial ecosystem in which no central bank can act in isolation. The decisions made by one major central bank—particularly the U.S. Federal Reserve—can ripple across the globe, influencing exchange rates, asset prices, and borrowing costs in multiple countries.
3. The U.S. Federal Reserve’s Global Dominance
The U.S. dollar is the world’s primary reserve currency, accounting for nearly 60% of global reserves and the majority of international trade settlements. As a result, the Federal Reserve (Fed) exerts substantial indirect control over global financial conditions.
When the Fed changes its interest rates or monetary policy stance, the effects are immediate and widespread:
Emerging markets experience capital inflows or outflows based on the attractiveness of U.S. yields.
Currency values fluctuate as investors shift between the dollar and other currencies.
Global borrowing costs rise or fall depending on U.S. Treasury yields.
For example, the 2013 "Taper Tantrum" occurred when the Fed announced it would reduce its quantitative easing program. This led to a massive outflow of capital from emerging markets, causing currency depreciation and market volatility worldwide. Central banks in countries like India, Brazil, and Indonesia were forced to raise interest rates or intervene in currency markets to stabilize their economies.
Thus, while national central banks manage their domestic economies, their room for maneuver is constrained by decisions made in Washington.
4. The Role of the IMF and World Bank
Institutions such as the International Monetary Fund (IMF) and the World Bank play a central role in influencing the monetary policies of developing and emerging nations. While these institutions provide financial assistance and development loans, their programs often come with policy conditionalities.
For instance, countries seeking IMF loans during balance-of-payment crises are required to implement austerity measures, fiscal discipline, and structural reforms, which often restrict the central bank’s ability to conduct independent monetary policy.
Examples include:
The Asian Financial Crisis (1997–1998), where IMF intervention imposed tight monetary and fiscal controls on countries like Thailand, Indonesia, and South Korea.
Latin American debt crises of the 1980s, where IMF programs demanded strict monetary policies and privatization measures.
Such conditions reflect how global financial institutions can indirectly control the policy framework of central banks, particularly in financially vulnerable nations.
5. Global Capital Flows and Market Pressures
Modern financial markets operate on a 24-hour global cycle, with trillions of dollars moving across borders daily. These massive flows of “hot money” can destabilize currencies and bond markets, forcing central banks to adjust their policies even if they conflict with domestic economic needs.
For instance:
A sudden capital outflow can devalue a country’s currency, raise import costs, and fuel inflation.
To counter this, the central bank may need to raise interest rates, which can slow economic growth.
Conversely, large capital inflows can create asset bubbles and inflationary pressures, requiring monetary tightening.
In this sense, global financial markets act as a disciplinary mechanism, rewarding or punishing central banks based on their policies. Nations with high fiscal deficits or loose monetary policies often face downward pressure on their currency or increased borrowing costs in global bond markets.
6. Exchange Rate Systems and Dependence
Exchange rate management is another area where global finance limits central bank independence. Most countries today operate under floating exchange rates, meaning their currency value is determined by market forces. However, even floating currencies are vulnerable to speculative attacks and global shocks.
Countries that peg their currency to the dollar or euro must align their monetary policies with the anchor currency’s central bank, effectively surrendering policy control.
For example, countries in the Eurozone have ceded national control to the European Central Bank (ECB), which sets a unified monetary policy for 20 diverse economies.
Similarly, economies with dollar pegs, like Hong Kong or Saudi Arabia, must follow U.S. interest rate trends to maintain currency stability.
Thus, through exchange rate mechanisms, global finance exerts control over domestic policy decisions.
7. The Power of Global Financial Institutions and Rating Agencies
Global credit rating agencies such as Moody’s, Standard & Poor’s, and Fitch Ratings have significant influence on national monetary conditions. A downgrade in a country’s sovereign rating can lead to higher borrowing costs, reduced investor confidence, and currency depreciation.
Central banks must often take preemptive actions—such as tightening monetary policy or maintaining high reserves—to maintain favorable credit ratings. This dependence on external validation further diminishes true policy autonomy.
Similarly, international investment banks and hedge funds influence global liquidity conditions. Their collective actions can amplify or counteract central bank policies, shaping market expectations and financial stability.
8. The Challenge of Central Bank Independence
Central bank independence is designed to prevent political interference and maintain policy credibility. However, true independence is a relative concept. Central banks must balance domestic economic objectives with global realities, including:
Exchange rate volatility
Global interest rate movements
Commodity price fluctuations
Investor sentiment and risk appetite
For smaller or developing economies, these external pressures can severely constrain policy options. Even advanced economies are not immune—consider the European Central Bank, which must balance the interests of both strong economies like Germany and weaker ones like Greece or Italy.
9. Global Crises and Central Bank Coordination
During periods of global crisis, such as the 2008 Global Financial Crisis or the COVID-19 pandemic, central banks often act in coordination. The Federal Reserve, ECB, Bank of Japan, and others engaged in synchronized interest rate cuts and quantitative easing programs to inject liquidity into global markets.
While such cooperation stabilized financial systems, it also highlighted the growing interdependence of global central banks. The Fed’s swap lines—temporary currency exchanges with other central banks—became essential tools to ensure global dollar liquidity, reinforcing U.S. dominance over international finance.
This global coordination is beneficial during crises but underscores the reality that national policies are now part of a global financial ecosystem dominated by major economies and institutions.
10. The Digital Era and Future of Central Banking
The rise of digital currencies, blockchain technology, and decentralized finance (DeFi) introduces new challenges to central banks’ control. Central Bank Digital Currencies (CBDCs) are being developed to maintain monetary sovereignty in an era of financial globalization.
However, even with digital innovation, global finance remains interconnected. A digital dollar or euro could enhance the global influence of their respective central banks, while smaller nations could find their financial systems further marginalized.
11. Implications for Developing Economies
For developing nations, dependence on foreign investment, external debt, and imported inflation makes them particularly vulnerable to global financial forces. When major central banks tighten policy, capital flows reverse, currencies weaken, and debt servicing costs rise.
This “financial dependency” limits the ability of central banks in emerging markets to pursue independent monetary policy. The solution often lies in:
Strengthening domestic financial markets
Diversifying reserves
Promoting local currency settlements
Building policy credibility and transparency
Such measures can help shield national economies from excessive global influence.
Conclusion
Central banks were originally established to safeguard national monetary stability, but in the 21st century, their independence is constrained by the immense power of global finance. International capital flows, financial institutions, rating agencies, and dominant currencies—especially the U.S. dollar—shape the policy space available to even the most powerful central banks.
Global financial control is not always direct or conspiratorial—it operates through market mechanisms, investor sentiment, and institutional interdependence. The challenge for modern central banks is to balance national economic priorities with global financial realities.
In an increasingly integrated world, complete autonomy is impossible. Yet, by fostering transparency, coordination, and prudent macroeconomic management, central banks can navigate these global pressures effectively. The key lies not in resisting globalization but in managing interdependence wisely, ensuring that the pursuit of global stability does not come at the expense of national sovereignty and economic justice.

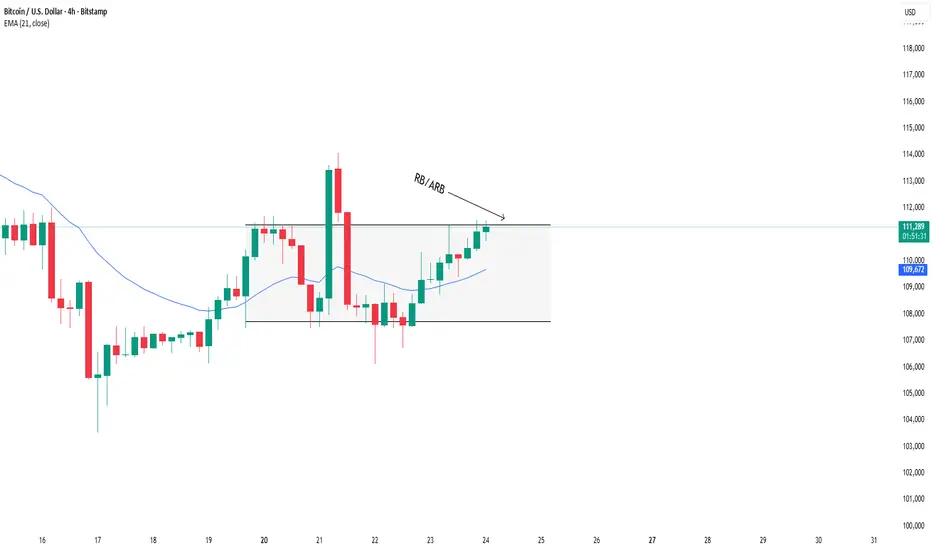
BTCUSD: Waiting for breakout confirmation near the range highBTCUSD – Analysis for October 24, 2025
Yesterday, we had two trading setups for BITSTAMP:BTCUSD .
The IRB setup played out as planned when the price rebounded from the EMA, formed a consolidation zone within the range, and then broke out strongly, pushing up toward the upper boundary of the range.
This move shows that bullish momentum is still present, although the resistance near the range high remains a key area where short-term profit-taking may occur.
Today’s Trading Plan
Wait for the price to compress and form a tight consolidation zone near the upper boundary of the range.
Confirmation condition: No candle closes below the EMA, which would confirm that buying pressure remains in control.
Once a RB or ARB setup appears, that will be our signal to enter long positions.
Bullish Scenario (primary bias):
Entry: On confirmed RB/ARB setup near the upper edge of the range
Stop Loss: Below the nearest EMA
Take Profit: Targeting extended resistance levels above the range
Alternative Scenario:
If the price closes below the EMA and breaks the compression structure, we’ll stay out of the market and wait for a new setup once the structure stabilizes.
Summary
BTC continues to show strength, but the upper range boundary remains a key test.
Today’s plan: Wait – Confirm – Execute. Avoid FOMO until a clear confirmation appears.
Daniel Miller @ ZuperView
GOLD will rise.XAUUSD has been moving sideways this week and good probabilité it will rise today or next week when markets will reopen. Also some news coming so we will see it's reaction from the fundamentals.

GBP/JPY Support Flip in ActionLong-term vibe (2W chart):
GBP/JPY's been cursing upwards since 2020, riding that strong support line. It's like the pair's got a safety net, and as long as it holds above this line, the trend's buddy-buddy with the bulls.
Short-term play (1D chart):
Check it, on the daily chart, GBP/JPY broke above a key resistance zone, and now that level turn into support. It's like getting a green light for a potential push higher. We're chillin' around the 203-204 zone now, if this holds, we're prob looking at higher targets.
Putting it together:
Long-term trend's up, and short-term breakout saying "hey, maybe more upside". If GBP/JPY hangs out above 203-204, bulls might keep pushing it higher.
DYOR, NFA
Thanks for reading! Appreciate your support and engagement 🙏

GOLD → Fundamental background boosts interest FX:XAUUSD is recovering after a correction, trading in the range of 4060-4120 amid geopolitical tensions and risks of an escalating trade war.
Key supporting factors: New threats from the US against China, which is responding with additional measures. Trump imposed sanctions against Russian oil companies, accusing Moscow of lack of progress on Ukraine. US inflation data (CPI) on Friday may cause volatility, although the Fed's rate cut next week is likely already priced in.
The meeting between Trump and Xi Jinping next week remains uncertain.
Gold remains a safe haven, but near-term dynamics depend on the balance between dollar strength and geopolitical risks.
Resistance levels: 4116, 4163, 4200
Support levels: 4082, 4060, 4002
A retest of support at 4082-4060, as well as a breakout of resistance at 4116, could trigger a bullish reaction—a rise to the resistance level or imbalance zones. Against the backdrop of the escalating trade war, gold is becoming attractive again.
Best regards, R. Linda!

GOLD → Correction after aggressive growthFX:XAUUSD is in a correction phase after a month and a half of aggressive growth. The price is forming a trading range and continues to storm support...
The record growth was overheated, and traders are closing long positions. A gradual change in the fundamental background and market sentiment is also provoking an outflow of funds. However, US-China negotiations, the ongoing US shutdown, and the tense geopolitical situation, including the cancellation of Trump's meeting with Putin, create additional risks in the economy, which may support the metal.
The correction in gold looks like a healthy pause. The $4,000 level remains key support. A recovery above $4100 indicates continued buyer interest, but further dynamics depend on news about trade negotiations.
Resistance levels: 4082, 4107, 4163
Support levels: 4059, 4000
A breakdown of the trading range support could trigger further sell-offs. Focus on 4000K, aggressive reaction possible. At the moment, the market is falling as aggressively as it rose. We need to wait for the price to slow down in order to make reasonable technical decisions.
Best regards, R. Linda!

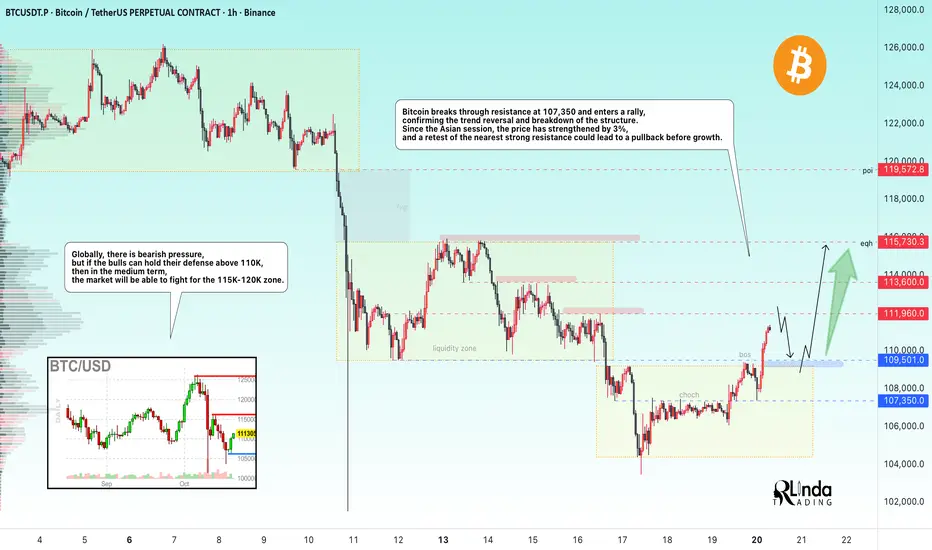
BITCOIN → Trend reversal. Is there a chance for growth?BINANCE:BTCUSDT.P is breaking the trend and local market structure, forming a rally. Giving hope to buyers, we see a strong reaction from the Asian session. Are the bulls returning?
The fundamental background is unstable; if Trump continues to escalate the trade war, the cryptocurrency market may close within the range. However, technically, we have positive signs of a bull market. BTC is breaking through the resistance level of 107,350 and entering a rally, which only confirms the change in trend and the breakdown of the structure. Since the Asian session, the price has strengthened by 3%, and a retest of the nearest strong resistance at 112K-113.6K could lead to a pullback before growth.
Globally, there is bearish pressure, but if the bulls can hold their defense above 110K, then in the medium term, the market will be able to fight for the 115K-120K zone.
Resistance levels: 111960, 113600, 115730
Support levels: 109700, 109200
In the short term, I expect a false breakout of the specified resistance and a correction of 1/2 of the local impulse, i.e., a retest of the 110K - 109200 support zone, which, in turn, could lead to another bullish run to 115K - 120K.
Best regards, R. Linda!
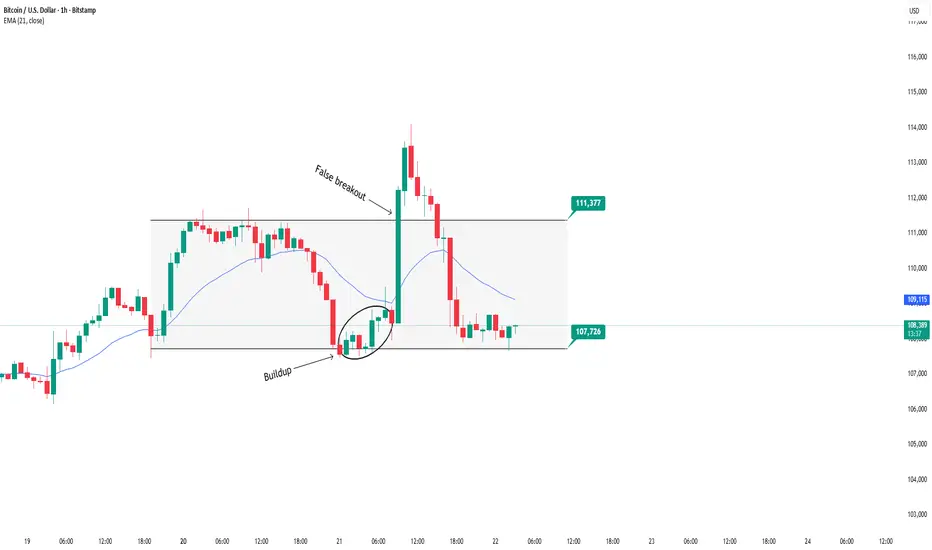
BTCUSD: Sideways - Watch for setup near range boundariesBITSTAMP:BTCUSD Analysis – October 22, 2025
BITSTAMP:BTCUSD is currently trading within a sideways range between 107,726 and 111,377 USD. After a breakout attempt, the price formed a buildup zone near the lower boundary of the range and surged upwards. However, it then created a false breakout at the upper boundary before pulling back to retest the previous buildup area.
This false breakout was caused by weakening buying momentum after breaking above the range, partly because the buildup zone was too far from the upper boundary, limiting the follow-through. According to yesterday’s plan, we are waiting for a buildup close to the upper boundary and EMA compression to confirm a valid breakout.
Trading plan for today:
Look to sell when price forms a buildup near the lower boundary of the range with EMA compressing close. Enter the trade upon the appearance of rejection signals such as RB or ARB.
The buy setup has not yet formed clearly but may be considered if an IRB appears within the larger BTC range.
In summary, BTC is still in an accumulation phase. Prioritize waiting for confirmed signals before entering trades to minimize risk.
Daniel Miller @ ZuperView
XAUUSD — Prioritize selling on H1 todayXAUUSD — Prioritize selling on H1 today | Sell retest 4313–4315, wait to buy back at 4230–4232 🟡
Summary: H1 is moving within a descending channel; the recovery is just a pullback. The main plan is to sell when the price retraces to the confluence zone of Fibo 50% + resistance box around 4313–4315. Buying is only a strategy to catch the technical rebound at deep support zones, prioritizing 4230–4232 (Fibo 0.236 + support box). Article optimized for mobile readers: concise – clear zones – if–then.
📊 Technical Analysis (H1)
Structure & Context
Price has fallen from the nearest peak and is moving within a descending channel → intraday trend leans bearish.
Zone 4313–4315 coincides with the 50% Fibonacci of the decline + resistance box on the chart (labeled “Sell fibonacci 50”) → a beautiful confluence for sell retest.
Support boxes in order: 4288–4292 (near Fibo 0.786 of the recovery wave), 4250–4255, 4230–4232 (Fibo 0.236). Further below is a strong liquidity zone around ~4185–4195 (near EMA200 H1 ≈ 4181).
If–Then (structure)
If it retraces to 4313–4315 and prints a clear rejection candle (long tail/close below the zone), then prioritize selling according to the descending channel.
If it breaks 4250–4255 and holds below this zone, then the downtrend is likely to extend to 4230–4232.
If it breaks above 4320 (H1 close), then the intraday sell scenario is invalidated, shifting to the 4336–4345 zone (next box peak).
📰 Basic Context (quick points)
Market sentiment is cautiously optimistic about potential improvements in US-China trade negotiations; however, the USD remains strong following bank news (Zions Bank report generally stable, despite some fraud factors) → putting pressure on gold during rebounds.
Large central bank inflows into gold and strong net inflows into gold ETFs recently remain a medium-term support; but in the short term, prices are heavily influenced by yields/USD.
🎯 Trading Plan (intraday) — if–then, clear zones
Scenario 1 — SELL retest (priority)
Entry: 4313–4315
SL: 4320
TP: 4290 → 4277 → 4252 → 4220
Condition: clear rejection appears at zone 4313–4315 (Fibo 50% + resistance box + channel edge).
Scenario 2 — BUY technical rebound (secondary, quick)
Entry: 4230–4232 (assumption: your provided zone is 4230–4232)
SL: 4224
TP: 4250 → 4272 → 4290 → 4308
Condition: wick/shadow at 4230–4232; better if it reclaims 4250–4255 afterward.
Scenario 3 — Intermediate BUY (supporting the rhythm)
Entry: 4288–4292
SL: 4282
TP: 4302 → 4310
Note: only short scalp when selling momentum slows at 0.786; do not hold if the market slips back below 4288.
Invalidation & Risk Management
Close H1 above 4320 ⇒ pause intraday sell scenario.
Each trade risk ≤ 1–2% of the account; adhere to SL first – position later. 🛡️
Summary
Intraday bias: Bearish within the H1 descending channel; prioritize sell retest at 4313–4315.
Buy only to catch technical rebounds at deep supports: 4288–4292 and 4230–4232.
Watch levels: 4313–4315 | 4320 (invalidation) | 4290 | 4277 | 4252 | 4232 | ~4190.
This article is for reference purposes, if you find it useful, follow me for the fastest updates.

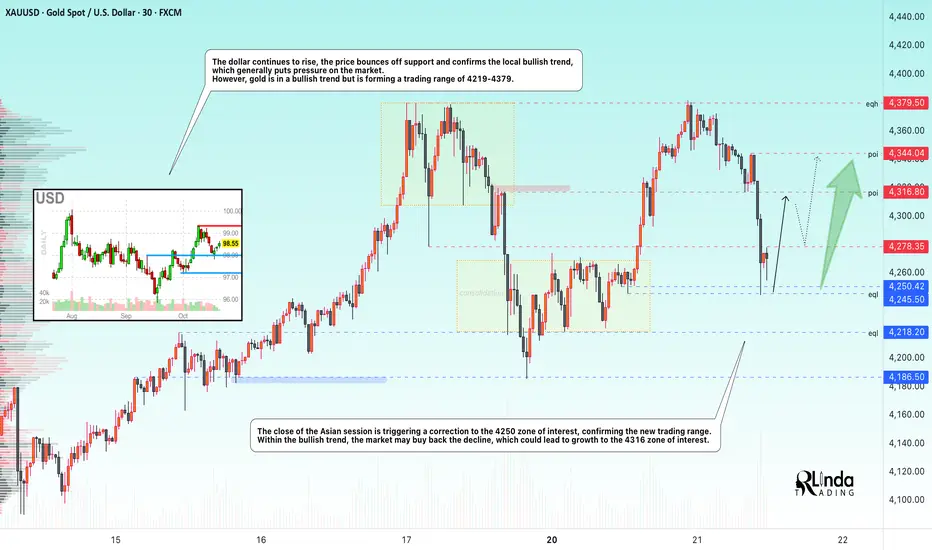
GOLD → The correction forms a trading range. Growth?FX:XAUUSD is adjusting to $4250 after retesting the all-time high of 4380. Short-term pressure is linked to hopes for an easing of the trade war between the US and China, but the bullish trend remains intact.
Key factors: Bentsen's meeting with the Chinese Vice Premier this week has revived optimism for a deal. The reduction in trade risks is temporarily supporting the USD. Hassett's statements about the imminent resumption of government work have reinforced risk-on sentiment.
Support for gold: The threat of tariffs rising to 155% from November 1 reminds us of the risks. Two rate cuts before the end of the year remain in focus. Friday's inflation data release and US corporate earnings reports are keeping demand for hedging alive.
Accordingly, the correction in gold is a temporary pause. The uptrend will remain unchanged as long as macro uncertainty persists.
Support levels: 4250, 4218
Resistance levels: 4278, 4316
Within the bullish trend, the price is forming a trading range. A retest of support could end in a recovery, with the fundamental background favoring the bulls. A retest of 4245 could trigger growth, as could a breakout of 4278 (closing above resistance).
Best regards, R. Linda!
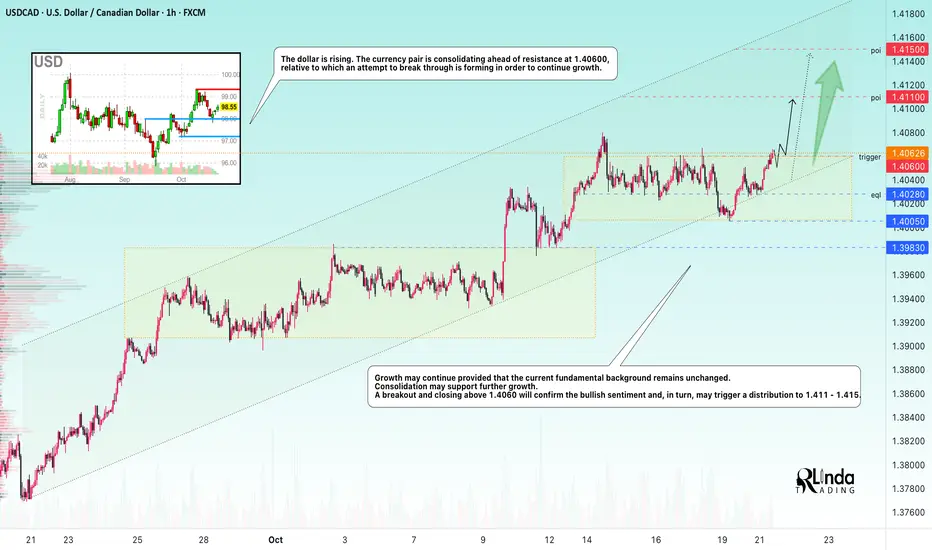
USDCAD → Attempt to break through resistance to continue growth FX:USDCAD is attempting to break through consolidation resistance within an uptrend. Growth in the dollar index may support the current trend.
The dollar is rising. The currency pair is consolidating ahead of resistance at 1.40600, against which it is attempting to break through in order to continue growing.
The growth may continue if the current fundamental background remains unchanged. Consolidation may support further growth. A breakout and closing above 1.4060 will confirm the bullish sentiment and, in turn, may trigger a distribution to 1.411 - 1.415.
Resistance levels: 1.4060
Support levels: 1.4028, 1.4005
The trend is bullish, with virtually no pullback after the growth, only consolidation, which is technically a positive sign. A breakout of the specified consolidation resistance could trigger distribution to areas of interest.
Best regards, R. Linda!
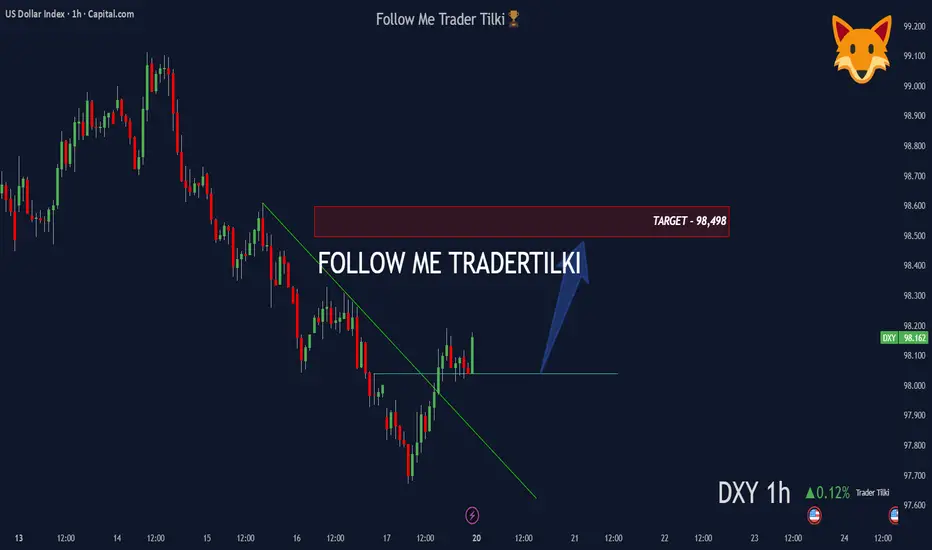
DXY 1H Analysis: Trendline Break with Rising Volume 📊 DXY – 1 Hour Analysis
Technical Outlook:
The trendline has been broken and rising volumes are drawing attention.
Based on this setup, my target level is: 98,498 🎯
Fundamental Analysis:
Recently, a White House economist stated that “we are not in any kind of economic war with China,” which reduced uncertainty in the markets and strengthened the dollar index.
In addition, FED policies, interest rate expectations, and tightening measures continue to be key factors supporting upward pricing on the DXY side.
🙏 Thanks to everyone who supports me with their likes.
US100: Needs a healthy pullback before breaking highs🧭 SKILLING:US100 (30-Min Chart) – The Market Needs a Pause Before the Breakout
After a strong recovery from the 24,200 area , the US100 has shown an impressive upward acceleration, forming a steep speed line that pushed price back toward the previous highs around 25,150 – 25,250 — a major resistance zone where sellers previously dominated.
However, as price reaches this area, the bullish momentum is starting to fade. Smaller candles and indecisive movements reveal hesitation — buyers are still in control, but the strength that carried the market this far is beginning to weaken.
If we look closely at the market structure, it’s clear that the index has been trying to reclaim the entire prior range, but that effort hasn’t come easy. After such a fast rally, the market looks overextended, and bulls may need a healthy pullback to gather enough energy for a real breakout.
________________________________________
🔍 Technical Outlook
• The 25,150 – 25,250 zone remains the key resistance area. If price keeps getting rejected here, short-term sellers might step in.
• A corrective move toward 24,850 – 24,950 (the pink zone) would not be surprising.
• That area should be watched closely — if buyers defend it strongly, it could become the launchpad for another push toward new highs.
________________________________________
🎯 Personal View
The overall structure still favors the bullish side, but momentum needs a reset.
A short-term pullback shouldn’t be seen as weakness — it’s an opportunity for the market to rebalance before the next leg up.
If the 24,850 zone holds, the probability of a true breakout above 25,250 increases significantly, potentially opening room toward 25,400 – 25,500 in the next sessions.
________________________________________
💬 In summary:
The US100 has worked hard to reclaim lost ground, but breaking above the previous top will require fresh momentum. A short-term correction could be exactly what the market needs to build a stronger foundation for a sustainable rally.
Please like and comment below to support our traders. Your reactions will motivate us to do more analysis in the future 🙏✨
Harry Andrew @ ZuperView

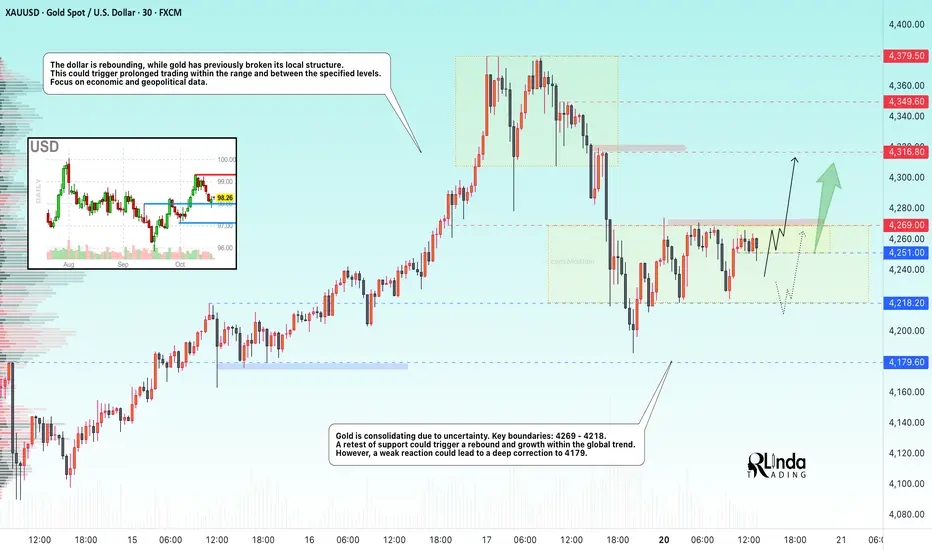
GOLD → Consolidation. 4269 - trigger. Chances for growth?Gold is consolidating due to uncertainty. On Friday, the market broke its local structure, which slightly changed sentiment. Focus on current consolidation.
Key drivers of the week: Trump's threat to impose 100% tariffs on Chinese imports and China's response supported demand for safe havens. Problems with regional banks (Zions, Western Alliance) and the fall in Treasury bond yields below 4% increased the inflow into gold. Powell maintained a neutral tone, but markets are expecting two rate cuts in 2024.
All eyes are on inflation data, US-China negotiations, developments between Russia, the US, and China; any de-escalation of the situation could trigger a correction.
Technically, the upward trend in gold remains relevant. Corrections will be bought up as long as uncertainty surrounding trade policy, the banking sector, and the Fed's monetary policy persists.
Resistance levels: 4269, 4316
Support levels: 4251, 4218
At the moment, a pre-breakout base is forming around 4269. If the structure remains intact and the price continues to attack resistance, the chances of a breakout and growth will be high. Otherwise, a close below 4251 could trigger a retest of 4218.
Best regards, R. Linda!
BTCUSD: Waiting for EMA pullback and bullish setupBITSTAMP:BTCUSD Analysis – October 20, 2025
Overview:
After a strong drop to the 103,600 area, BITSTAMP:BTCUSD is showing a solid recovery momentum. Price has broken out of the previous accumulation range and made a pullback, but the early buying opportunity has already passed.
Trading Plan for Today:
Currently, price is approaching a previous key resistance level—a critical zone to watch for reaction.
The main strategy is to wait for a pullback toward the EMA zone and look for a confirmed buy setup based on one of the following patterns:
DD (Double Doji) – indicating a potential pause and reversal.
SB (Second Break) – confirming continuation of the bullish trend.
Alternative Scenario:
If BTC continues to rally strongly without a pullback and breaks above the key level.
It’s better to stay on the sidelines rather than chase the move.
Avoid FOMO when the market doesn’t offer a clear setup — patience usually brings higher-probability entries.
Daniel Miller @ ZuperView

XAUUSD: Accumulation Within Price Channel XAUUSD: Accumulation Within Price Channel - Scalping Strategy Awaiting New Wave
Hello traders community,
XAUUSD (Gold) is expected to move sideways today, with accumulation being the main theme. Although the long-term upward pressure remains intact, in the short term, the market needs a "breather" and to accumulate more liquidity before it can break out strongly.
📰 Macro Analysis & Cash Flow
Fundamental factors continue to provide a solid "support floor" for Gold prices:
Safe Haven Flows: Ongoing trade uncertainties and geopolitical tensions show no signs of cooling down, continuing to favor safe-haven assets like Gold.
Weak USD: Expectations of an early Fed rate cut, combined with the risk of a US government shutdown, are weakening the USD and indirectly supporting XAUUSD.
Conclusion: The foundation for an upward trend remains very solid. Sideways movements or short-term corrections should be seen as opportunities.
📊 Technical Analysis
On the H1 chart, we clearly see Gold moving within a "Corrective Ascending Channel." This is a typical accumulation pattern.
Resistance Zone ("SELL LIQUIDITY POC"): The $4340 - $4342 zone is an extremely important resistance area. This is the confluence of the upper edge of the price channel and the Point of Control (POC) for Sellers. Profit-taking and short-selling pressure will be strong here.
Support Zone ("Buy scalping"): The $4207 - $4209 zone is the underlying structural support, corresponding to the lower edge of the price channel. This is where Buyers can step in to "Buy the dip."
Current Status: The price is "compressed" within this range, creating excellent short-term trading opportunities.
🎯 Intraday Trading Plan (Scalping)
With sideways movement being the main scenario, the optimal strategy is short-term trading (scalping) at the two edges of the price channel.
Scenario 1: Short Selling (Sell) 📉
Entry: $4340 - $4342
(SL): $4350
(TP): $4320 - $4302 - $4288 - $4260 - $4242
Scenario 2: Short Buying (Buy) 📈
Entry: $4207 - $4209
(SL): $4200
(TP): $4233 - $4250 - $4275 - $4290
Summary
Today is an ideal day for scalpers. Prioritize short-term trades within the $4207 - $4342 range. A strong breakout beyond one of the two edges of this price channel will be a confirmation signal for the next trend.
Always manage your capital tightly and trade with discipline!

XAUUSD-GOLD 1H Chart—SELL Setup with 3 Profit TargetsHello Guys,
Here’s my 1-hour XAUUSD-GOLD analysis for you.
These are the exact SELL levels I’ll be watching:
🔵SELL level: 4285.9
🔴 Stop level:4335.3 (or adjust based on your own margin)
🟢 TP1: 4264.8
🟢 TP2: 4232.1
🟢 TP3: 4185.0
Risk-to-reward ratio on this setup: 2.05
If XAUUSD-GOLD reaches these levels, I’ll definitely take a SELL position.
Every like is my biggest motivation to keep sharing these analyses.
Thanks to everyone supporting me!

BTC/USDT — Volume Strength Returns, Eyes on 110K+ RecoveryBTC/USDT — Volume Strength Returns, Eyes on 110K+ Recovery 🚀
Bitcoin is showing renewed momentum as it re-enters the volume+ zone, signaling stronger market participation after recent consolidation. The move above the low time frame structure confirms short-term strength and suggests a potential continuation to the upside.
Currently, BTC is holding steady around $108.9K, maintaining support within the accumulation range. If momentum continues, a breakout toward $110K+ looks increasingly likely, aligning with short-term recovery signals.
📊 Technical Overview:
Volume Zone: $108K–$109K
Short-Term Target: $111K
Main Resistance: $122.5K
Bias: Positive momentum forming above low time frame
A strong hourly close above $109K would further confirm the shift in trend strength, potentially opening the next leg higher toward $111K–$122K.
📈 Outlook: Bullish short-term structure forming

Global Commodity Trends: An In-Depth Analysis1. Overview of Commodity Categories
Commodities can broadly be categorized into three segments:
Energy Commodities – including crude oil, natural gas, coal, and renewable energy components.
Metal Commodities – comprising precious metals (gold, silver, platinum) and industrial metals (copper, aluminum, nickel, lithium).
Agricultural Commodities – such as grains, oilseeds, coffee, cotton, and sugar.
Each sector operates under different economic drivers but shares common threads: cyclical demand, global trade dependency, and vulnerability to geopolitical and climatic disruptions.
2. Energy Commodities: Shifting Power Dynamics
Oil Market Evolution
Crude oil remains the most influential commodity, dictating the rhythm of the global economy. After years of volatility, oil prices in 2025 have stabilized between $75–$90 per barrel, balancing between OPEC+ production controls and demand recovery in post-pandemic industrial economies. Key trends influencing the oil market include:
Geopolitical Tensions: Conflicts in the Middle East, Russia-Ukraine tensions, and sanctions have repeatedly disrupted supply routes and reshaped trade alliances.
Energy Transition: Many nations are reducing fossil fuel dependence, creating dual effects—investment withdrawal from oil projects and short-term supply tightness.
US Shale Resurgence: Technological improvements have revived U.S. shale production, moderating price spikes and diversifying global supply sources.
Natural Gas and LNG Boom
The liquefied natural gas (LNG) market has become a critical player in global energy security. Europe’s pivot away from Russian pipeline gas has spurred demand for LNG imports from the U.S., Qatar, and Australia. Asian markets—particularly India, Japan, and South Korea—are also expanding their LNG infrastructure. Prices remain elevated due to limited shipping capacity and long-term contract negotiations.
Renewable Commodities
The renewable sector is emerging as a commodity class of its own. Materials essential for wind turbines, solar panels, and batteries—like lithium, cobalt, and rare earth elements—are now strategically significant. Nations rich in these resources, such as Chile (lithium), the Democratic Republic of Congo (cobalt), and China (rare earths), have gained economic leverage in the green transition era.
3. Metal Commodities: Industrial and Technological Backbone
Copper: The ‘New Oil’ of Electrification
Copper is a vital indicator of global industrial health and the clean energy revolution. With rising demand from electric vehicles (EVs), grid expansion, and renewable infrastructure, copper prices have remained strong, hovering near $9,000–$10,000 per metric ton in 2025. However, supply shortages from major producers like Chile and Peru continue to pressure the market. Technological exploration and recycling have become key to meeting demand sustainably.
Aluminum and Steel: Industrial Expansion
Global infrastructure projects—particularly in India, Southeast Asia, and Africa—have driven demand for aluminum and steel. China’s gradual construction slowdown has been offset by growth in emerging markets. Decarbonization efforts have also led to “green steel” innovations, with major producers investing in hydrogen-based smelting technologies.
Precious Metals: Inflation Hedges
Gold remains a preferred hedge against inflation, currency devaluation, and financial instability. In 2025, gold prices are resilient around $2,100 per ounce, supported by central bank purchases and investor uncertainty about global debt sustainability. Silver, platinum, and palladium also benefit from industrial use in electronics, solar energy, and automotive catalysis.
Critical Minerals and Rare Earths
The rise of electric mobility and digital technologies has made critical minerals central to geopolitical competition. Nations are now securing mineral supply chains to reduce dependence on single-country producers. The U.S. and EU have launched strategic mineral alliances to diversify sourcing and encourage domestic mining.
4. Agricultural Commodities: Weather, Demand, and Technology
Food Security Challenges
Global food prices have experienced volatility due to extreme weather, conflict disruptions, and changing consumption patterns. Droughts in key grain-producing regions (such as North America and Australia) have tightened wheat and corn supplies, while El Niño weather patterns have affected rice production in Asia.
Grains and Oilseeds
Wheat and Corn: Prices remain firm as global demand for animal feed and biofuels continues to grow.
Soybeans: Driven by rising protein consumption in developing economies and biofuel production in the U.S. and Brazil, soybean demand remains robust.
Rice: Export restrictions by major producers like India in 2024–25 have kept rice prices elevated, intensifying food inflation pressures in Africa and Asia.
Soft Commodities: Coffee, Cocoa, and Cotton
Coffee and cocoa markets face supply disruptions due to unpredictable weather and labor shortages. Meanwhile, cotton prices have stabilized as global textile demand recovers post-pandemic. However, sustainability standards and organic production are reshaping trade patterns, with premium pricing for ethically sourced materials.
Technological Innovation in Agriculture
Precision farming, AI-driven weather forecasting, and genetically resilient crops are transforming agricultural productivity. These innovations aim to balance yield improvements with sustainability and environmental preservation, reducing the carbon footprint of global agriculture.
5. Geopolitical and Economic Influences
Global commodity trends are closely tied to geopolitics and macroeconomics. Several key developments have reshaped the landscape:
Trade Wars and Sanctions: The U.S.–China trade rivalry and sanctions on Russia and Iran have disrupted traditional commodity flows, leading to new alliances among BRICS nations.
Currency Movements: A strong U.S. dollar often suppresses commodity prices by making them costlier for non-dollar economies. However, increasing talk of “de-dollarization” could redefine commodity pricing in the long term.
Global Inflation and Interest Rates: Higher interest rates have tempered speculative investments in commodities, yet inflationary pressures from supply chain disruptions continue to sustain price floors.
Environmental Regulations: Climate policies and carbon taxes are influencing production costs and trade competitiveness, particularly in energy and metals sectors.
6. Technological and Structural Shifts
Digitalization and Smart Commodities
Blockchain and AI technologies are revolutionizing commodity trading systems. Digital platforms now enable transparent pricing, efficient logistics, and reduced transaction costs. Smart contracts in blockchain-based trade reduce fraud and enhance traceability from mines to markets.
Green Commodities and ESG Investments
Investors increasingly favor environmentally and socially responsible commodities. ESG (Environmental, Social, and Governance) frameworks are pushing companies to disclose emissions data, human rights practices, and sustainability metrics. This shift is influencing how commodity-backed financial instruments are structured and traded.
Automation in Mining and Logistics
Robotics, automation, and remote monitoring have transformed mining and shipping operations, reducing costs and improving safety. Autonomous drilling and AI-based maintenance systems enhance operational efficiency across industries dependent on raw materials.
7. Regional Insights
Asia-Pacific
Asia remains the largest consumer of commodities, with China and India leading demand for energy, metals, and food. India’s industrial expansion and renewable energy programs are reshaping regional trade flows. Southeast Asian nations are emerging as key exporters of palm oil, rubber, and rare earths.
North America
The U.S. and Canada benefit from abundant energy and agricultural resources. The shale industry revival and strategic mineral exploration position North America as a stable supplier amidst global uncertainty.
Europe
Europe’s energy diversification post-Ukraine war has accelerated investment in renewables, hydrogen, and circular economy practices. High carbon pricing has also made European industries more sustainable but less cost-competitive globally.
Africa and Latin America
These regions are rich in untapped resources, from lithium in Chile and Argentina to cobalt in the DRC and oil in Nigeria. However, political instability and infrastructure challenges hinder full potential. Strategic partnerships with China and Western investors aim to modernize extraction and processing industries.
8. Challenges Ahead
Despite progress, several structural challenges persist in global commodity markets:
Supply Chain Fragmentation: Geopolitical rivalries threaten trade connectivity.
Climate Risks: Extreme weather events continue to impact yields, mining operations, and energy supply.
Resource Nationalism: Governments are asserting greater control over natural resources, imposing export restrictions or windfall taxes.
Market Volatility: Speculative trading and financial derivatives amplify short-term price fluctuations, complicating investment planning.
Sustainability Pressure: Transitioning to low-carbon operations requires significant capital and policy alignment across nations.
9. The Future of Commodity Markets
Looking ahead to 2030 and beyond, the global commodity landscape is expected to be shaped by four major forces:
Energy Transition Acceleration: The world will see greater integration of renewables, hydrogen, and energy storage, reducing fossil fuel dependency but increasing demand for critical minerals.
Technological Integration: AI, blockchain, and predictive analytics will dominate commodity trading, making markets more transparent and efficient.
Sustainable Agriculture: Climate-resilient crops and smart irrigation will redefine global food systems.
Geopolitical Realignment: Multipolar trade networks among BRICS+ nations will challenge traditional commodity pricing systems dominated by Western economies.
Conclusion
Global commodity trends in 2025 reveal a dynamic interplay of energy transformation, technological evolution, and geopolitical recalibration. While oil and gas remain vital to short-term stability, the long-term trajectory points toward green minerals, digital commodities, and sustainable agriculture. The world is navigating a complex transition where supply chains, trade policies, and investment strategies must adapt to environmental and political realities. In essence, commodities have evolved from mere tradable goods into strategic instruments of power, policy, and progress. Managing this transformation with foresight, equity, and sustainability will define the resilience of the global economy in the years ahead.
GOLD → Positive backdrop. Consolidation before growth?FX:XAUUSD is consolidating after a shake-down in the Asian and Pacific sessions. The price hit a new low of 4278, but bulls are aggressively buying up two liquidations (manipulation?). The metal is preparing for its ninth consecutive week in positive territory, with an 8% increase over the week.
Key drivers: Fed members confirmed their readiness to cut rates in October and pointed to risks for the labor market. The situation with the trade war between China and the US is still tense.
However, negotiations between the presidents of three countries on the conflict in Eastern Europe have raised hopes for de-escalation, which has temporarily reduced demand for defensive assets. The shutdown continues, which supports the price of gold.
The correction in gold is a temporary pause, and any decline will be used for purchases.
Technically, the focus is on the global trading range of 4280-4380, with consolidation within 4350-4330. A breakout of the accumulation zone could trigger a move in the direction of the breakout
Resistance levels: 4350, 4380
Support levels: 4320, 4300, 4280
Technically, before rising, the price may test the liquidity zone located below the specified support zones. However, it is also worth watching the 4350 trigger—a breakout of resistance and a close above this level could trigger continued growth within the current bullish trend.
Best regards, R. Linda!

GBPCAD → The hunt for liquidity ahead of growthFX:GBPCAD , after breaking through the resistance of the ascending triangle consolidation pattern and updating its high to 1.8915, is forming a correction to retest the zone of interest before continuing its growth
The British pound is forming an uptrend, which supports the price of the currency pair.
The currency pair is forming a breakout of resistance. After updating the maximum, the price is rolling back to retest the previously broken consolidation border. Liquidity capture relative to 1.8825 - 1.8807 could lead to a shift in the imbalance towards buyers and provoke continued growth.
Resistance levels: 1.8915
Support levels: 1.8825, 1.8808
If, during the retest of support, the bulls keep the price above this zone, then the chances of a reversal and growth will be high. 1.8915 - 1.900 can be considered as a potential target.
Best regards, R. Linda!
