GOLD → Correction after aggressive growthFX:XAUUSD is in a correction phase after a month and a half of aggressive growth. The price is forming a trading range and continues to storm support...
The record growth was overheated, and traders are closing long positions. A gradual change in the fundamental background and market sentiment is also provoking an outflow of funds. However, US-China negotiations, the ongoing US shutdown, and the tense geopolitical situation, including the cancellation of Trump's meeting with Putin, create additional risks in the economy, which may support the metal.
The correction in gold looks like a healthy pause. The $4,000 level remains key support. A recovery above $4100 indicates continued buyer interest, but further dynamics depend on news about trade negotiations.
Resistance levels: 4082, 4107, 4163
Support levels: 4059, 4000
A breakdown of the trading range support could trigger further sell-offs. Focus on 4000K, aggressive reaction possible. At the moment, the market is falling as aggressively as it rose. We need to wait for the price to slow down in order to make reasonable technical decisions.
Best regards, R. Linda!
Trend Line Break

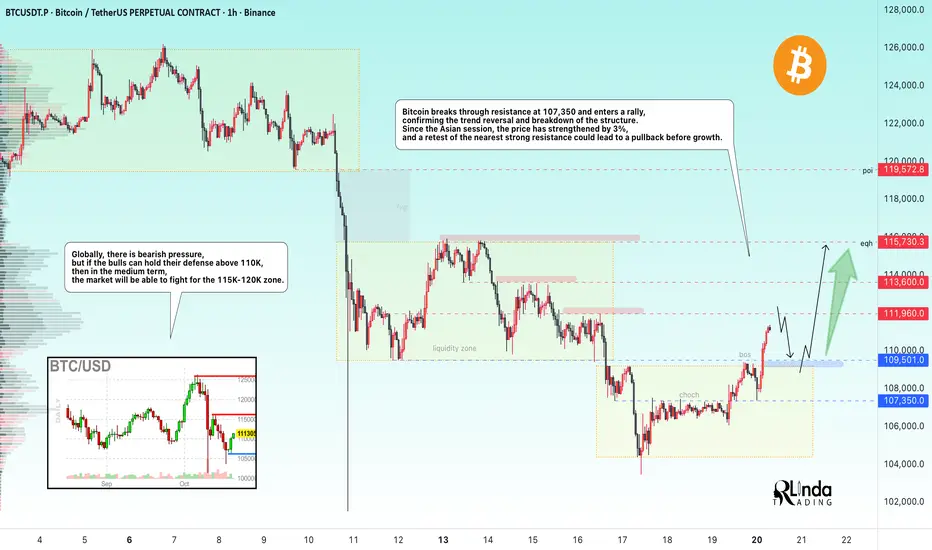
BITCOIN → Trend reversal. Is there a chance for growth?BINANCE:BTCUSDT.P is breaking the trend and local market structure, forming a rally. Giving hope to buyers, we see a strong reaction from the Asian session. Are the bulls returning?
The fundamental background is unstable; if Trump continues to escalate the trade war, the cryptocurrency market may close within the range. However, technically, we have positive signs of a bull market. BTC is breaking through the resistance level of 107,350 and entering a rally, which only confirms the change in trend and the breakdown of the structure. Since the Asian session, the price has strengthened by 3%, and a retest of the nearest strong resistance at 112K-113.6K could lead to a pullback before growth.
Globally, there is bearish pressure, but if the bulls can hold their defense above 110K, then in the medium term, the market will be able to fight for the 115K-120K zone.
Resistance levels: 111960, 113600, 115730
Support levels: 109700, 109200
In the short term, I expect a false breakout of the specified resistance and a correction of 1/2 of the local impulse, i.e., a retest of the 110K - 109200 support zone, which, in turn, could lead to another bullish run to 115K - 120K.
Best regards, R. Linda!
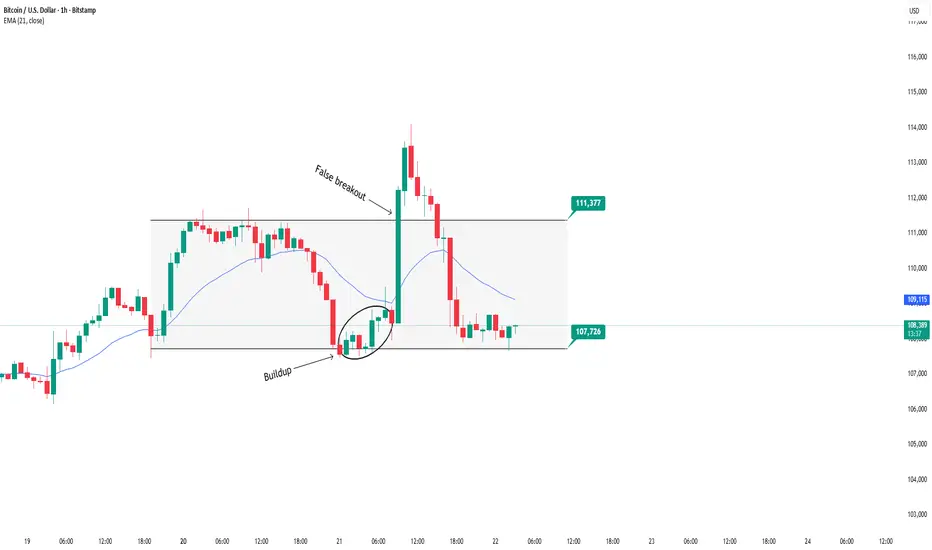
BTCUSD: Sideways - Watch for setup near range boundariesBITSTAMP:BTCUSD Analysis – October 22, 2025
BITSTAMP:BTCUSD is currently trading within a sideways range between 107,726 and 111,377 USD. After a breakout attempt, the price formed a buildup zone near the lower boundary of the range and surged upwards. However, it then created a false breakout at the upper boundary before pulling back to retest the previous buildup area.
This false breakout was caused by weakening buying momentum after breaking above the range, partly because the buildup zone was too far from the upper boundary, limiting the follow-through. According to yesterday’s plan, we are waiting for a buildup close to the upper boundary and EMA compression to confirm a valid breakout.
Trading plan for today:
Look to sell when price forms a buildup near the lower boundary of the range with EMA compressing close. Enter the trade upon the appearance of rejection signals such as RB or ARB.
The buy setup has not yet formed clearly but may be considered if an IRB appears within the larger BTC range.
In summary, BTC is still in an accumulation phase. Prioritize waiting for confirmed signals before entering trades to minimize risk.
Daniel Miller @ ZuperView
GOLD → The correction forms a trading range. Growth?FX:XAUUSD is adjusting to $4250 after retesting the all-time high of 4380. Short-term pressure is linked to hopes for an easing of the trade war between the US and China, but the bullish trend remains intact.
Key factors: Bentsen's meeting with the Chinese Vice Premier this week has revived optimism for a deal. The reduction in trade risks is temporarily supporting the USD. Hassett's statements about the imminent resumption of government work have reinforced risk-on sentiment.
Support for gold: The threat of tariffs rising to 155% from November 1 reminds us of the risks. Two rate cuts before the end of the year remain in focus. Friday's inflation data release and US corporate earnings reports are keeping demand for hedging alive.
Accordingly, the correction in gold is a temporary pause. The uptrend will remain unchanged as long as macro uncertainty persists.
Support levels: 4250, 4218
Resistance levels: 4278, 4316
Within the bullish trend, the price is forming a trading range. A retest of support could end in a recovery, with the fundamental background favoring the bulls. A retest of 4245 could trigger growth, as could a breakout of 4278 (closing above resistance).
Best regards, R. Linda!
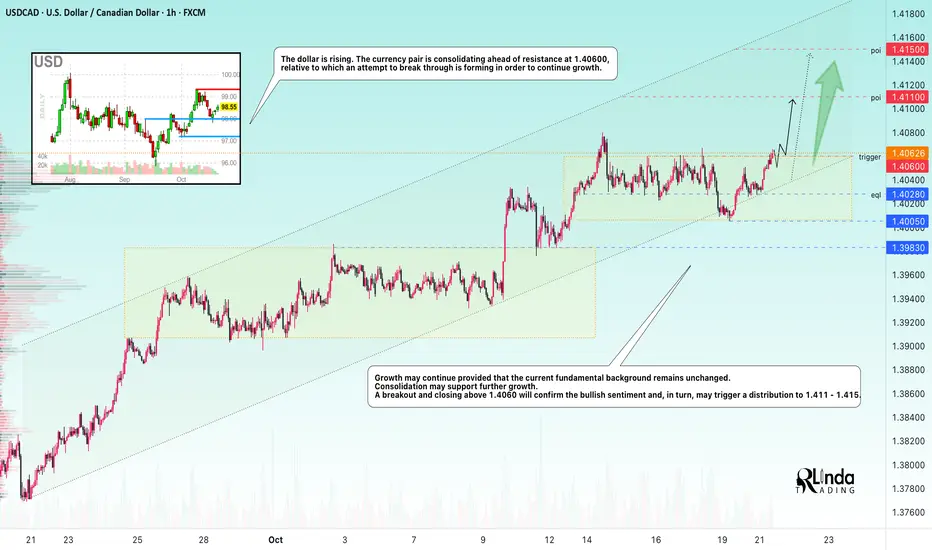
USDCAD → Attempt to break through resistance to continue growth FX:USDCAD is attempting to break through consolidation resistance within an uptrend. Growth in the dollar index may support the current trend.
The dollar is rising. The currency pair is consolidating ahead of resistance at 1.40600, against which it is attempting to break through in order to continue growing.
The growth may continue if the current fundamental background remains unchanged. Consolidation may support further growth. A breakout and closing above 1.4060 will confirm the bullish sentiment and, in turn, may trigger a distribution to 1.411 - 1.415.
Resistance levels: 1.4060
Support levels: 1.4028, 1.4005
The trend is bullish, with virtually no pullback after the growth, only consolidation, which is technically a positive sign. A breakout of the specified consolidation resistance could trigger distribution to areas of interest.
Best regards, R. Linda!
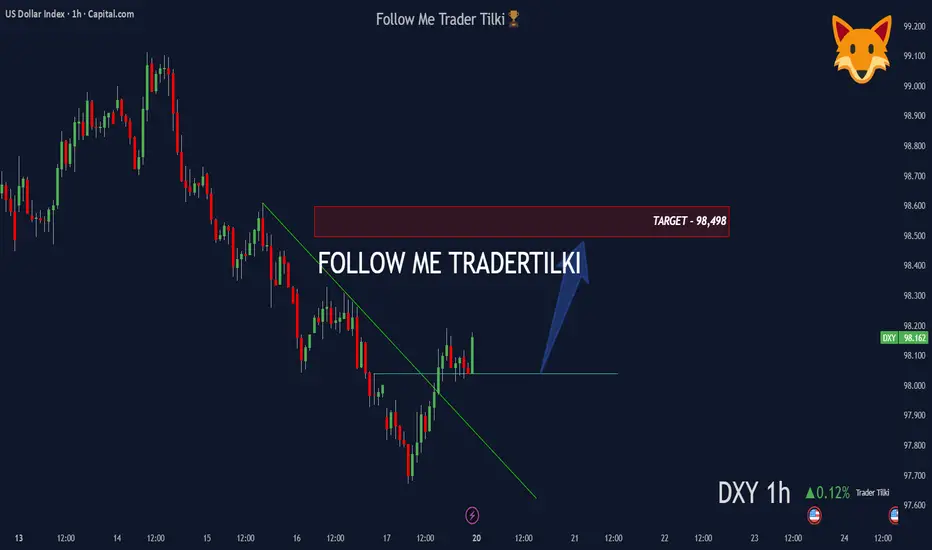
DXY 1H Analysis: Trendline Break with Rising Volume 📊 DXY – 1 Hour Analysis
Technical Outlook:
The trendline has been broken and rising volumes are drawing attention.
Based on this setup, my target level is: 98,498 🎯
Fundamental Analysis:
Recently, a White House economist stated that “we are not in any kind of economic war with China,” which reduced uncertainty in the markets and strengthened the dollar index.
In addition, FED policies, interest rate expectations, and tightening measures continue to be key factors supporting upward pricing on the DXY side.
🙏 Thanks to everyone who supports me with their likes.
US100: Needs a healthy pullback before breaking highs🧭 SKILLING:US100 (30-Min Chart) – The Market Needs a Pause Before the Breakout
After a strong recovery from the 24,200 area , the US100 has shown an impressive upward acceleration, forming a steep speed line that pushed price back toward the previous highs around 25,150 – 25,250 — a major resistance zone where sellers previously dominated.
However, as price reaches this area, the bullish momentum is starting to fade. Smaller candles and indecisive movements reveal hesitation — buyers are still in control, but the strength that carried the market this far is beginning to weaken.
If we look closely at the market structure, it’s clear that the index has been trying to reclaim the entire prior range, but that effort hasn’t come easy. After such a fast rally, the market looks overextended, and bulls may need a healthy pullback to gather enough energy for a real breakout.
________________________________________
🔍 Technical Outlook
• The 25,150 – 25,250 zone remains the key resistance area. If price keeps getting rejected here, short-term sellers might step in.
• A corrective move toward 24,850 – 24,950 (the pink zone) would not be surprising.
• That area should be watched closely — if buyers defend it strongly, it could become the launchpad for another push toward new highs.
________________________________________
🎯 Personal View
The overall structure still favors the bullish side, but momentum needs a reset.
A short-term pullback shouldn’t be seen as weakness — it’s an opportunity for the market to rebalance before the next leg up.
If the 24,850 zone holds, the probability of a true breakout above 25,250 increases significantly, potentially opening room toward 25,400 – 25,500 in the next sessions.
________________________________________
💬 In summary:
The US100 has worked hard to reclaim lost ground, but breaking above the previous top will require fresh momentum. A short-term correction could be exactly what the market needs to build a stronger foundation for a sustainable rally.
Please like and comment below to support our traders. Your reactions will motivate us to do more analysis in the future 🙏✨
Harry Andrew @ ZuperView

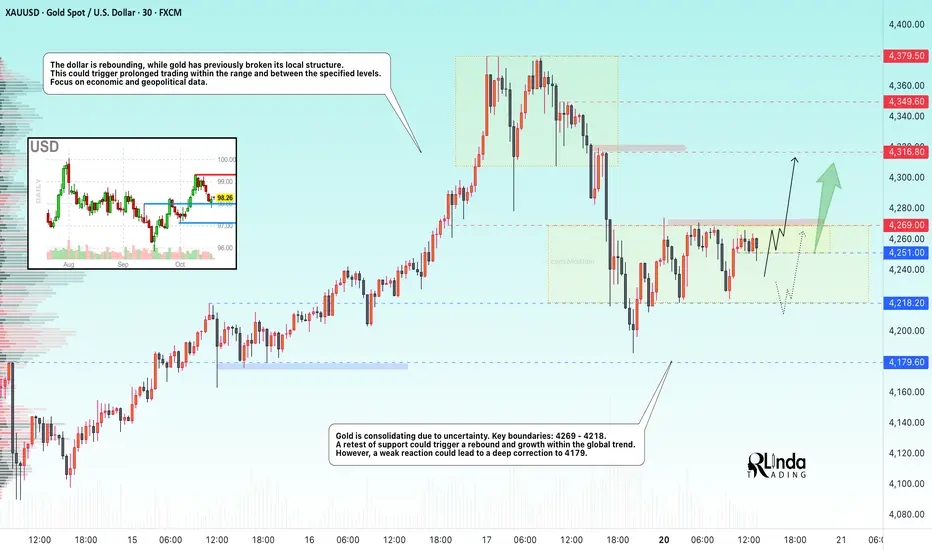
GOLD → Consolidation. 4269 - trigger. Chances for growth?Gold is consolidating due to uncertainty. On Friday, the market broke its local structure, which slightly changed sentiment. Focus on current consolidation.
Key drivers of the week: Trump's threat to impose 100% tariffs on Chinese imports and China's response supported demand for safe havens. Problems with regional banks (Zions, Western Alliance) and the fall in Treasury bond yields below 4% increased the inflow into gold. Powell maintained a neutral tone, but markets are expecting two rate cuts in 2024.
All eyes are on inflation data, US-China negotiations, developments between Russia, the US, and China; any de-escalation of the situation could trigger a correction.
Technically, the upward trend in gold remains relevant. Corrections will be bought up as long as uncertainty surrounding trade policy, the banking sector, and the Fed's monetary policy persists.
Resistance levels: 4269, 4316
Support levels: 4251, 4218
At the moment, a pre-breakout base is forming around 4269. If the structure remains intact and the price continues to attack resistance, the chances of a breakout and growth will be high. Otherwise, a close below 4251 could trigger a retest of 4218.
Best regards, R. Linda!
BTCUSD: Waiting for EMA pullback and bullish setupBITSTAMP:BTCUSD Analysis – October 20, 2025
Overview:
After a strong drop to the 103,600 area, BITSTAMP:BTCUSD is showing a solid recovery momentum. Price has broken out of the previous accumulation range and made a pullback, but the early buying opportunity has already passed.
Trading Plan for Today:
Currently, price is approaching a previous key resistance level—a critical zone to watch for reaction.
The main strategy is to wait for a pullback toward the EMA zone and look for a confirmed buy setup based on one of the following patterns:
DD (Double Doji) – indicating a potential pause and reversal.
SB (Second Break) – confirming continuation of the bullish trend.
Alternative Scenario:
If BTC continues to rally strongly without a pullback and breaks above the key level.
It’s better to stay on the sidelines rather than chase the move.
Avoid FOMO when the market doesn’t offer a clear setup — patience usually brings higher-probability entries.
Daniel Miller @ ZuperView

XAUUSD-GOLD 1H Chart—SELL Setup with 3 Profit TargetsHello Guys,
Here’s my 1-hour XAUUSD-GOLD analysis for you.
These are the exact SELL levels I’ll be watching:
🔵SELL level: 4285.9
🔴 Stop level:4335.3 (or adjust based on your own margin)
🟢 TP1: 4264.8
🟢 TP2: 4232.1
🟢 TP3: 4185.0
Risk-to-reward ratio on this setup: 2.05
If XAUUSD-GOLD reaches these levels, I’ll definitely take a SELL position.
Every like is my biggest motivation to keep sharing these analyses.
Thanks to everyone supporting me!

BTC/USDT — Volume Strength Returns, Eyes on 110K+ RecoveryBTC/USDT — Volume Strength Returns, Eyes on 110K+ Recovery 🚀
Bitcoin is showing renewed momentum as it re-enters the volume+ zone, signaling stronger market participation after recent consolidation. The move above the low time frame structure confirms short-term strength and suggests a potential continuation to the upside.
Currently, BTC is holding steady around $108.9K, maintaining support within the accumulation range. If momentum continues, a breakout toward $110K+ looks increasingly likely, aligning with short-term recovery signals.
📊 Technical Overview:
Volume Zone: $108K–$109K
Short-Term Target: $111K
Main Resistance: $122.5K
Bias: Positive momentum forming above low time frame
A strong hourly close above $109K would further confirm the shift in trend strength, potentially opening the next leg higher toward $111K–$122K.
📈 Outlook: Bullish short-term structure forming

Global Commodity Trends: An In-Depth Analysis1. Overview of Commodity Categories
Commodities can broadly be categorized into three segments:
Energy Commodities – including crude oil, natural gas, coal, and renewable energy components.
Metal Commodities – comprising precious metals (gold, silver, platinum) and industrial metals (copper, aluminum, nickel, lithium).
Agricultural Commodities – such as grains, oilseeds, coffee, cotton, and sugar.
Each sector operates under different economic drivers but shares common threads: cyclical demand, global trade dependency, and vulnerability to geopolitical and climatic disruptions.
2. Energy Commodities: Shifting Power Dynamics
Oil Market Evolution
Crude oil remains the most influential commodity, dictating the rhythm of the global economy. After years of volatility, oil prices in 2025 have stabilized between $75–$90 per barrel, balancing between OPEC+ production controls and demand recovery in post-pandemic industrial economies. Key trends influencing the oil market include:
Geopolitical Tensions: Conflicts in the Middle East, Russia-Ukraine tensions, and sanctions have repeatedly disrupted supply routes and reshaped trade alliances.
Energy Transition: Many nations are reducing fossil fuel dependence, creating dual effects—investment withdrawal from oil projects and short-term supply tightness.
US Shale Resurgence: Technological improvements have revived U.S. shale production, moderating price spikes and diversifying global supply sources.
Natural Gas and LNG Boom
The liquefied natural gas (LNG) market has become a critical player in global energy security. Europe’s pivot away from Russian pipeline gas has spurred demand for LNG imports from the U.S., Qatar, and Australia. Asian markets—particularly India, Japan, and South Korea—are also expanding their LNG infrastructure. Prices remain elevated due to limited shipping capacity and long-term contract negotiations.
Renewable Commodities
The renewable sector is emerging as a commodity class of its own. Materials essential for wind turbines, solar panels, and batteries—like lithium, cobalt, and rare earth elements—are now strategically significant. Nations rich in these resources, such as Chile (lithium), the Democratic Republic of Congo (cobalt), and China (rare earths), have gained economic leverage in the green transition era.
3. Metal Commodities: Industrial and Technological Backbone
Copper: The ‘New Oil’ of Electrification
Copper is a vital indicator of global industrial health and the clean energy revolution. With rising demand from electric vehicles (EVs), grid expansion, and renewable infrastructure, copper prices have remained strong, hovering near $9,000–$10,000 per metric ton in 2025. However, supply shortages from major producers like Chile and Peru continue to pressure the market. Technological exploration and recycling have become key to meeting demand sustainably.
Aluminum and Steel: Industrial Expansion
Global infrastructure projects—particularly in India, Southeast Asia, and Africa—have driven demand for aluminum and steel. China’s gradual construction slowdown has been offset by growth in emerging markets. Decarbonization efforts have also led to “green steel” innovations, with major producers investing in hydrogen-based smelting technologies.
Precious Metals: Inflation Hedges
Gold remains a preferred hedge against inflation, currency devaluation, and financial instability. In 2025, gold prices are resilient around $2,100 per ounce, supported by central bank purchases and investor uncertainty about global debt sustainability. Silver, platinum, and palladium also benefit from industrial use in electronics, solar energy, and automotive catalysis.
Critical Minerals and Rare Earths
The rise of electric mobility and digital technologies has made critical minerals central to geopolitical competition. Nations are now securing mineral supply chains to reduce dependence on single-country producers. The U.S. and EU have launched strategic mineral alliances to diversify sourcing and encourage domestic mining.
4. Agricultural Commodities: Weather, Demand, and Technology
Food Security Challenges
Global food prices have experienced volatility due to extreme weather, conflict disruptions, and changing consumption patterns. Droughts in key grain-producing regions (such as North America and Australia) have tightened wheat and corn supplies, while El Niño weather patterns have affected rice production in Asia.
Grains and Oilseeds
Wheat and Corn: Prices remain firm as global demand for animal feed and biofuels continues to grow.
Soybeans: Driven by rising protein consumption in developing economies and biofuel production in the U.S. and Brazil, soybean demand remains robust.
Rice: Export restrictions by major producers like India in 2024–25 have kept rice prices elevated, intensifying food inflation pressures in Africa and Asia.
Soft Commodities: Coffee, Cocoa, and Cotton
Coffee and cocoa markets face supply disruptions due to unpredictable weather and labor shortages. Meanwhile, cotton prices have stabilized as global textile demand recovers post-pandemic. However, sustainability standards and organic production are reshaping trade patterns, with premium pricing for ethically sourced materials.
Technological Innovation in Agriculture
Precision farming, AI-driven weather forecasting, and genetically resilient crops are transforming agricultural productivity. These innovations aim to balance yield improvements with sustainability and environmental preservation, reducing the carbon footprint of global agriculture.
5. Geopolitical and Economic Influences
Global commodity trends are closely tied to geopolitics and macroeconomics. Several key developments have reshaped the landscape:
Trade Wars and Sanctions: The U.S.–China trade rivalry and sanctions on Russia and Iran have disrupted traditional commodity flows, leading to new alliances among BRICS nations.
Currency Movements: A strong U.S. dollar often suppresses commodity prices by making them costlier for non-dollar economies. However, increasing talk of “de-dollarization” could redefine commodity pricing in the long term.
Global Inflation and Interest Rates: Higher interest rates have tempered speculative investments in commodities, yet inflationary pressures from supply chain disruptions continue to sustain price floors.
Environmental Regulations: Climate policies and carbon taxes are influencing production costs and trade competitiveness, particularly in energy and metals sectors.
6. Technological and Structural Shifts
Digitalization and Smart Commodities
Blockchain and AI technologies are revolutionizing commodity trading systems. Digital platforms now enable transparent pricing, efficient logistics, and reduced transaction costs. Smart contracts in blockchain-based trade reduce fraud and enhance traceability from mines to markets.
Green Commodities and ESG Investments
Investors increasingly favor environmentally and socially responsible commodities. ESG (Environmental, Social, and Governance) frameworks are pushing companies to disclose emissions data, human rights practices, and sustainability metrics. This shift is influencing how commodity-backed financial instruments are structured and traded.
Automation in Mining and Logistics
Robotics, automation, and remote monitoring have transformed mining and shipping operations, reducing costs and improving safety. Autonomous drilling and AI-based maintenance systems enhance operational efficiency across industries dependent on raw materials.
7. Regional Insights
Asia-Pacific
Asia remains the largest consumer of commodities, with China and India leading demand for energy, metals, and food. India’s industrial expansion and renewable energy programs are reshaping regional trade flows. Southeast Asian nations are emerging as key exporters of palm oil, rubber, and rare earths.
North America
The U.S. and Canada benefit from abundant energy and agricultural resources. The shale industry revival and strategic mineral exploration position North America as a stable supplier amidst global uncertainty.
Europe
Europe’s energy diversification post-Ukraine war has accelerated investment in renewables, hydrogen, and circular economy practices. High carbon pricing has also made European industries more sustainable but less cost-competitive globally.
Africa and Latin America
These regions are rich in untapped resources, from lithium in Chile and Argentina to cobalt in the DRC and oil in Nigeria. However, political instability and infrastructure challenges hinder full potential. Strategic partnerships with China and Western investors aim to modernize extraction and processing industries.
8. Challenges Ahead
Despite progress, several structural challenges persist in global commodity markets:
Supply Chain Fragmentation: Geopolitical rivalries threaten trade connectivity.
Climate Risks: Extreme weather events continue to impact yields, mining operations, and energy supply.
Resource Nationalism: Governments are asserting greater control over natural resources, imposing export restrictions or windfall taxes.
Market Volatility: Speculative trading and financial derivatives amplify short-term price fluctuations, complicating investment planning.
Sustainability Pressure: Transitioning to low-carbon operations requires significant capital and policy alignment across nations.
9. The Future of Commodity Markets
Looking ahead to 2030 and beyond, the global commodity landscape is expected to be shaped by four major forces:
Energy Transition Acceleration: The world will see greater integration of renewables, hydrogen, and energy storage, reducing fossil fuel dependency but increasing demand for critical minerals.
Technological Integration: AI, blockchain, and predictive analytics will dominate commodity trading, making markets more transparent and efficient.
Sustainable Agriculture: Climate-resilient crops and smart irrigation will redefine global food systems.
Geopolitical Realignment: Multipolar trade networks among BRICS+ nations will challenge traditional commodity pricing systems dominated by Western economies.
Conclusion
Global commodity trends in 2025 reveal a dynamic interplay of energy transformation, technological evolution, and geopolitical recalibration. While oil and gas remain vital to short-term stability, the long-term trajectory points toward green minerals, digital commodities, and sustainable agriculture. The world is navigating a complex transition where supply chains, trade policies, and investment strategies must adapt to environmental and political realities. In essence, commodities have evolved from mere tradable goods into strategic instruments of power, policy, and progress. Managing this transformation with foresight, equity, and sustainability will define the resilience of the global economy in the years ahead.

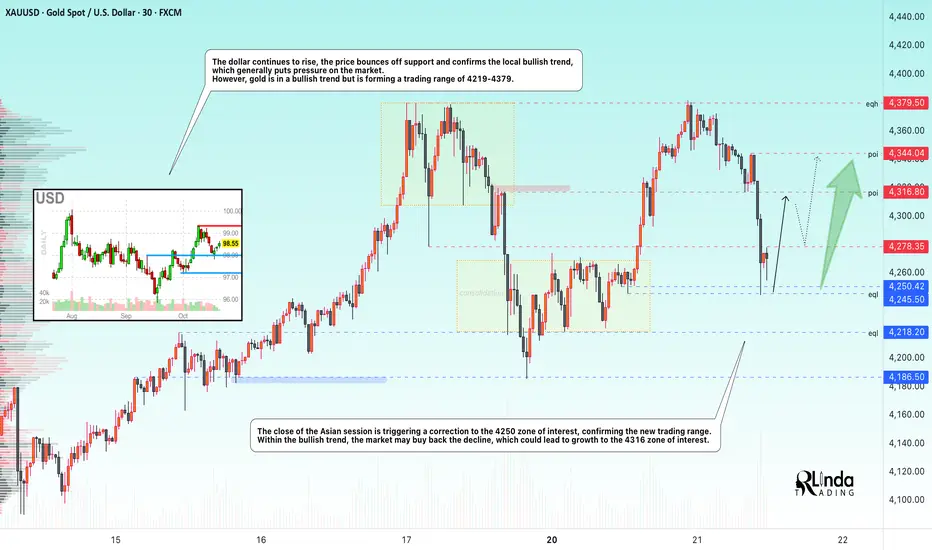
GOLD → Positive backdrop. Consolidation before growth?FX:XAUUSD is consolidating after a shake-down in the Asian and Pacific sessions. The price hit a new low of 4278, but bulls are aggressively buying up two liquidations (manipulation?). The metal is preparing for its ninth consecutive week in positive territory, with an 8% increase over the week.
Key drivers: Fed members confirmed their readiness to cut rates in October and pointed to risks for the labor market. The situation with the trade war between China and the US is still tense.
However, negotiations between the presidents of three countries on the conflict in Eastern Europe have raised hopes for de-escalation, which has temporarily reduced demand for defensive assets. The shutdown continues, which supports the price of gold.
The correction in gold is a temporary pause, and any decline will be used for purchases.
Technically, the focus is on the global trading range of 4280-4380, with consolidation within 4350-4330. A breakout of the accumulation zone could trigger a move in the direction of the breakout
Resistance levels: 4350, 4380
Support levels: 4320, 4300, 4280
Technically, before rising, the price may test the liquidity zone located below the specified support zones. However, it is also worth watching the 4350 trigger—a breakout of resistance and a close above this level could trigger continued growth within the current bullish trend.
Best regards, R. Linda!

GBPCAD → The hunt for liquidity ahead of growthFX:GBPCAD , after breaking through the resistance of the ascending triangle consolidation pattern and updating its high to 1.8915, is forming a correction to retest the zone of interest before continuing its growth
The British pound is forming an uptrend, which supports the price of the currency pair.
The currency pair is forming a breakout of resistance. After updating the maximum, the price is rolling back to retest the previously broken consolidation border. Liquidity capture relative to 1.8825 - 1.8807 could lead to a shift in the imbalance towards buyers and provoke continued growth.
Resistance levels: 1.8915
Support levels: 1.8825, 1.8808
If, during the retest of support, the bulls keep the price above this zone, then the chances of a reversal and growth will be high. 1.8915 - 1.900 can be considered as a potential target.
Best regards, R. Linda!

BTCUSD: Short opportunities on technical retrace BITSTAMP:BTCUSD Analysis – October 17, 2025
Yesterday’s short setup (BB) was triggered and hit target as planned.
The main trend remains bearish, confirming that sellers are still in control.
For today, the focus remains on looking for short opportunities following the current downtrend.
Expecting a technical pullback toward the 40%–60% retracement zone of the previous bearish leg.
As price approaches this area and retests the EMA, wait for a clear confirmation signal before entering.
If price fails to follow the setup, stay patient and wait for more confirmation to ensure a safe and disciplined trade.
Main Plan: Keep a bearish bias — look for shorts near the 40–60% retracement zone once confirmation appears.
Daniel Miller @ ZuperView

BTCUSD: Sideways in a block, looking for setup🧭 BITSTAMP:BTCUSD analysis – October 16, 2025
Currently, BITSTAMP:BTCUSD remains in a broader downtrend, so for today’s session, our main focus will be on looking for short (sell) opportunities, rather than counter-trend buys.
I’m using the 30-minute timeframe (M30) for today’s setup.
At the moment, BTC price action is quite complex — moving sideways within a block structure and has recently retested the resistance area around 110,904.
The plan for today is to wait for solid accumulation and a clear BreakBlock (BB) setup to confirm continuation to the downside.
Once a valid setup forms, we can look for short entries following the main trend, with strict risk management and flexible profit targets depending on market volatility.
Alternative Scenario:
If price breaks above the current range, we’ll stay patient and wait for clearer signals before entering any trades.
This approach helps us avoid FOMO and stay disciplined, ensuring all trades align with our predefined plan and market structure.
Daniel Miller @ ZuperView
XAUUSD: Prioritize Buying, Is the $5000 Target Still Distant?XAUUSD: "No More Gold to Sell" - Prioritize Buying, Is the $5000 Target Still Distant?
Hello trading community,
The Gold market (XAUUSD) is in a state of "extreme euphoria," continuously setting new highs. The upward momentum is driven not only by technical charts but also by extremely strong macroeconomic factors.
This article will analyze why the strategy "Prioritize Buying on Dips" is optimal, and the $4400 level, though seemingly high, might not be the final stop.
📰 Macro Analysis: "No More Gold to Sell!"
The market is witnessing a physical supply shock that cannot be ignored:
Supply Shock: Japan's largest gold retailer has temporarily halted gold bar sales due to overwhelming buying demand. This is a clear signal that physical gold demand is far outstripping available supply. When physical gold is scarce, paper market prices must rise to reflect true value.
Falling Bond Yields: The 10-year German government bond yield (representing Europe) has dropped to its lowest level since June. Lower yields make Gold (a non-yielding asset) significantly more attractive compared to holding bonds.
Both factors are creating a "perfect storm" supporting the price rise of XAUUSD.
📊 Technical Analysis
The M30/H1 chart shows a very sustainable parabolic uptrend:
Trend: The uptrend is undeniable. Prices are moving in a steep upward channel, with all selling efforts quickly absorbed by buyers.
Fibonacci Extension: Fibonacci extension levels are acting as the next price targets:
Zone $4382 (Fib 2.273): Conquered.
Zone $4407 - $4410 (Fib 2.407): This is a potential "Sell Scalping" zone, where a short correction might occur.
Zone $4480 - $4483 (Fib 2.618): This is a strong resistance "Sell Zone," the next target for buyers.
Volume Profile (VPVR):
"Buy Retest" Support ($4290 - $4300): This is an extremely important liquidity zone, a former peak that has been broken and also an area with large accumulated trading volume. Buyers will strongly defend this zone.
🎯 Detailed Trading Strategy
The main trend is Buying. Any Sell orders at this time carry high risk and should only be considered for short-term scalping to catch corrections.
Scenario 1: Buy the Dip 📈
Entry Zone: Wait for price to correct to the "Buy retest" zone $4290.
Stop Loss: $4280.
Take Profit: $4312 - $4334 - $4372 - $4390.
Scenario 2: Sell Scalping ⚡️
Entry Zone: Look to sell at the Fibo $4410 zone.
Stop Loss: $4420.
Take Profit: $4393 - $4380 - $4370. (Note: Counter-trend order, use small volume and take quick profits).
Scenario 3: Sell at Strong Resistance Zone 📉
Entry Zone: $4480.
Stop Loss: $4490.
Take Profit: $4463 - $4442 - $4410.
Summary
The combination of a strong technical uptrend and a fundamental supply shock is pushing Gold into a new price cycle. The $4400 level has been conquered, and with this momentum, the long-term target of $5000 is no longer a fantasy.
The wisest strategy is to "go with the flow," looking to Buy at key support zones.
Wishing traders a successful week!

GOLD → The aggressive trend continues. Focus on 4240FX:XAUUSD continues to break records, testing the $4,240 level amid a weakening dollar and sustained demand for safe-haven assets. The risks of a correction are growing as economic news releases approach.
Key supporting factors: Statements by US officials about China's “seizure of supply chains” and retaliatory measures are keeping markets on edge. US shutdown: The government shutdown is costing the economy $15 billion a week, increasing uncertainty. The probability of a rate cut in October and December is ~95%, which is putting pressure on the dollar. However, statements by Fed officials may adjust market expectations.
The bullish trend for gold remains unchanged. Any corrections will be seen as a buying opportunity. Key benchmarks are the development of the trade conflict and negotiations on the resumption of the US government.
Support levels: 4212, 4203
Resistance levels: 4234, 4235, 4250
Within the uptrend, it is worth waiting for a correction to support in order to open positions more profitably. There are no reasons for a trend reversal, and the fundamental background is bullish. We expect a retest of support before growth. However, a breakout of the 4234-4239 zone could trigger further growth!
Best regards, R. Linda!

USDJPY → False breakout? Target - gap?FX:USDJPY faces trend resistance during its rally and enters a correction. A retest of the range boundary is forming, the breakdown of which may trigger a sell-off.
The currency pair's growth, linked to the news, is slowing down. The price is testing the range boundary as part of a pullback, and the bullish reaction is weakening. Wednesday's daily candle closed below 151.23, which generally indicates buyer uncertainty.
Accordingly, there is a struggle for the 150.85 - 151.23 area, and the price closing below the key support zone will bring the price into the range. This, in turn, may provoke the closure of the gap (149.0 - 147.55).
Resistance levels: 151.23, 151.73
Support levels: 150.85, 149.93, 149.0
A false breakout and consolidation in the selling zone is a fairly strong signal that indicates the strength of the seller. A decline in the dollar index may trigger a decline in the price of the currency pair.
Best regards, R. Linda!

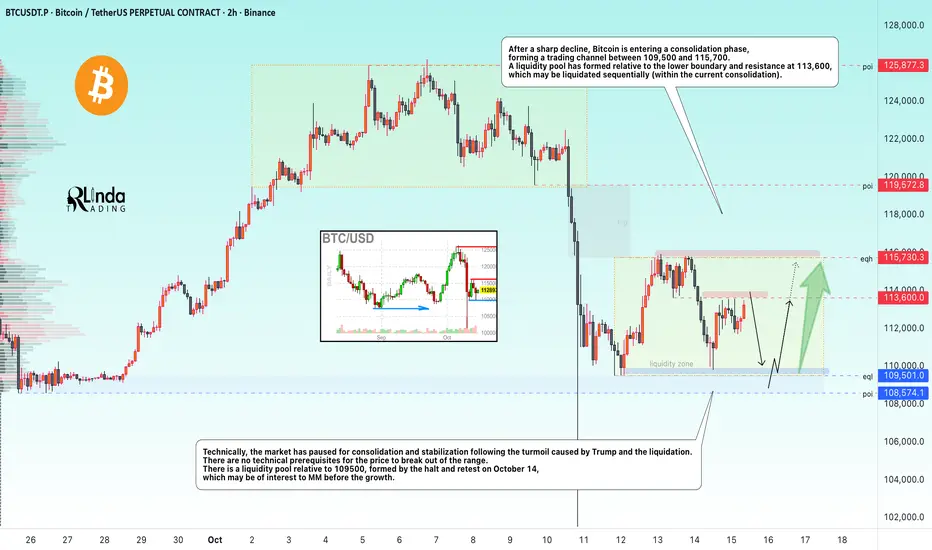
BITCOIN → Consolidation in the medium term. Focus on 109,5KBINANCE:BTCUSDT.P is forming a trading range after a sharp decline. Each distribution is followed by consolidation before the next distribution. Market phases in all their glory
After a sharp decline, Bitcoin is entering a consolidation phase, forming a trading channel of 109,500-115,700. A liquidity pool has formed relative to the lower boundary and resistance at 113600, which can be liquidated in turn (within the current consolidation).
Technically, the market has paused for consolidation and stabilization of the situation provoked by Trump and the liquidation. There are no technical prerequisites for the price to break out of the range. There is a liquidity pool relative to 109500, formed by the halt in the decline on October 11 and the retest on October 14, which may be of interest to MM before the growth.
Support levels: 109500, 108500
Resistance levels: 113,600, 115,730
Classic consolidation, the boundaries of which have not yet been tested. Possible false maneuvers relative to the specified levels to form a large MM position before moving in one direction or another in the medium term. Major players are still uncertain about further movement due to Trump's activism and his tariff strategy, which creates additional risks, and for this reason, I would not expect strong growth beyond the specified boundaries for now.
Sincerely, R. Linda!
GBPCHFHigher Highs (HH) & Higher Lows (HL): The pattern of higher highs and higher lows is an indication of an uptrend, showing that the buying momentum is strong.
Entry: Place a buy stop order just above the recent higher high (HH). This allows you to enter the trade if the price continues moving upward, confirming the bullish momentum.

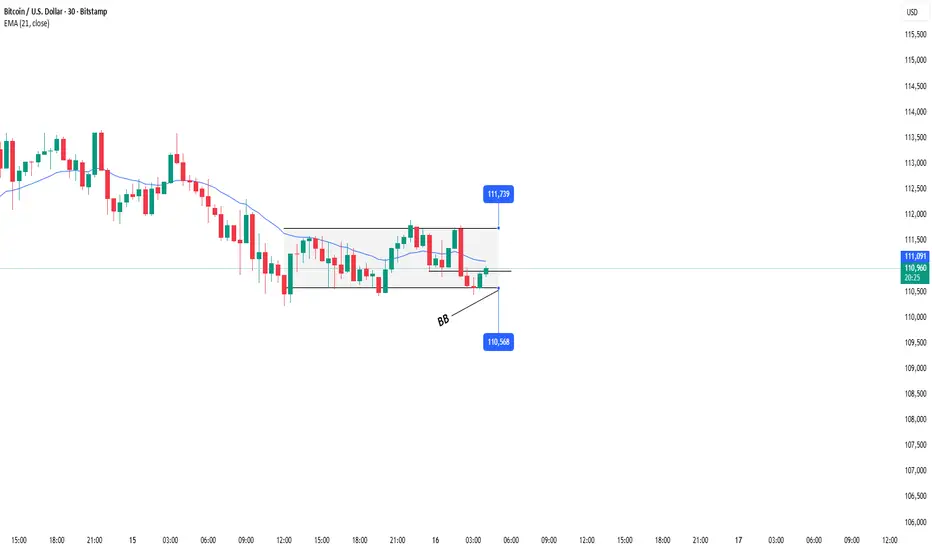
BTCUSD: Waiting for a range breakBITSTAMP:BTCUSD is currently trading within a tight accumulation range between 112,004 and 113,524.
Today’s plan:
Wait for price to consolidate near the upper boundary of the range while the EMA compresses close to price action. Once a clear range break (RB) to the upside occurs, enter a market buy.
If the price breaks early without enough consolidation, wait for a pullback to retest the breakout level and look for a buy setup after the range break (ARB).
Profit targets and stop loss levels should be chosen according to individual risk management preferences.
Daniel Miller @ ZuperView

GOLD → Correction to 4090. What could this mean?FX:XAUUSD , after updating its high to 4180, formed a correction and descended to the support zone of 4090, forming an intermediate bottom. We have a trading range...
Key drivers: China has introduced controls on rare earth metal exports, and the parties are holding consultations. A meeting between Trump and Xi Jinping is scheduled for the end of October.
Expectations of two rate cuts before the end of the year are strengthening gold's position. The ongoing government shutdown is fueling demand for safe-haven assets.
Today, attention is focused on Powell's speech, which could set the tone for the market.
The bullish trend for gold continues. The absence of bearish factors and ongoing macro risks continue to push the price up. Corrections are seen as an opportunity to buy.
Resistance levels: 4150, 4180
Support levels: 4117, 4090, 4059
The price is testing the 4150 liquidity zone, which could trigger a pullback within the range. A retest of support at 4117-4090 could support the market, and a change in imbalance could lead to another rally to 4180 - 4200
Best regards, R. Linda!
