EUR/USD – H1 - Fundamental Pressure Takes Control 📝 Description🔍 Setup (Fundamental + Technical) FX:EURUSD
EUR/USD has lost bullish structure after breaking below the rising trendline and confirming a bearish retest. Price is also trading below the Ichimoku cloud, with a bearish cloud crossover, signaling trend weakness.
📉 Fundamental catalyst:
1.Announcement of a new Fed Chair and political agreement to avoid a U.S. government shutdown
2. This reduces uncertainty and supports USD strength, pressuring EUR/USD lower
📍 Support & Resistance
🟨 Resistance Zone: 1.1980 – 1.2030
🟥 1st Support: 1.1715
🟥 2nd Support: 1.1620
Volume profile shows thin demand below, favoring continuation
#EURUSD #ForexTrading #FundamentalAnalysis #TrendlineBreak #BearishBias #USDStrength #PriceAction #TradingView #Kabhi_TA_Trading
⚠️ Disclaimer
This analysis is for educational purposes only.
Trading involves risk — always use proper risk management and trade with confirmation.
💬 Support the Idea👍 Like if you see EUR/USD heading lower
💬 Comment: Sell the retest or wait for breakdown continuation?
🔁 Share with traders watching USD fundamentals
Trend Lines

HYPEUSDT - Dump after pumpBINANCE:HYPEUSDT.P ended its rally in the 35.0 zone, smoothly changing the market phase from pump to dump. The cryptocurrency market is weak, but after a sharp decline, there may be a local correction
Bitcoin fell again to 81K during the Asian session. A strong rebound or uptrend should not be expected at this time. There is no fundamental support for the crypto market. Any attempts at growth may be perceived as a hunt for liquidity before the fall.
Within the framework of the downward trend and the weak state of cryptocurrencies, HYPEUSDT formed a pump phase and tested the local resistance zone of 35.0. The market was unable to reach the liquidity zone of 36.4. Before continuing its decline, against the backdrop of a general market correction, the coin may test 31.38 - 32.90
Resistance levels: 31.38, 32.9
Support levels: 29.98, 28.4, 25.84
If the market rebounds after the fall, the coin may test the resistance zone of 31.38 - 32.9. Another short squeeze and a close below 29.98 could trigger a continuation of the dump down to the interim bottom...
Best regards, R. Linda!

GOLD - The market may move towards consolidation...FX:XAUUSD is testing 4686, but by the end of Friday's session, traders are buying back the drop to 4800. The market may enter a consolidation phase until the fundamental situation stabilizes.
The reasons for the decline may include a change in the Fed's rhetoric due to the nomination of a new head of the regulator, Kevin Warsh, who is likely to adopt a more hawkish monetary policy. In addition, the growth of the dollar was also driven by hot inflation data. Traders reacted quite aggressively to the situation and moved to aggressively lock in profits.
In the new trading week, we are awaiting PMI, JOLTS, and ISM PMI data, as well as perhaps the most important economic index, NFP.
Technically, it is too early to talk about a clear market direction, as the situation has not yet stabilized. Accordingly, at the moment, I expect that the market may move towards consolidation after such a sharp decline. The approximate boundaries within which the price may stop are 4650 - 4950 (5000).
Support levels: 4800, 4686, 4643
Resistance levels: 4944, 4990, 5000
The Asian market may test resistance, but if bears keep the market below 5000, gold may form a correction to 4800 - 4686 due to the floating fundamental background.
Best regards, R. Linda!

XAUUSD Long: Defends Trend Support, Targeting $5,190 SupplyHello traders! Here’s a clear technical breakdown of XAUUSD (2H) based on the current chart structure. Gold remains in a broader bullish environment after a strong impulsive move that developed from a well-defined accumulation range. Following this consolidation phase, price broke to the upside and began respecting a rising trend line, confirming sustained buyer control and healthy trend conditions. During the advance, multiple bullish breakouts occurred above prior resistance levels, each followed by continuation, reinforcing the strength of the underlying trend. This bullish leg ultimately pushed price into a major Supply Zone around 5,190, where upside momentum began to stall.
Currently, at the supply area, Gold faced strong selling pressure, leading to a sharp pullback and the formation of a descending supply line, signaling short-term corrective pressure within the broader uptrend. Price then dropped toward a key Demand Zone near 4,940, which aligns closely with the rising trend line and a previous breakout structure. This confluence of horizontal demand and dynamic trend support makes the zone technically significant. The recent decline appears corrective rather than impulsive, suggesting profit-taking and short-term distribution instead of a full trend reversal.
My scenario: as long as XAUUSD holds above the 4,940 Demand Zone and continues to respect the rising trend line, the broader bullish structure remains intact. A sustained reaction from this demand area could lead to a recovery move back toward the 5,190 Supply Level (TP1). A clean breakout and acceptance above this supply would confirm bullish continuation and open the door for further upside expansion. However, a decisive breakdown below the demand zone and trend line would invalidate the bullish bias and signal a deeper corrective phase. For now, Gold is at a key decision area, with buyers attempting to defend structure and resume the broader uptrend. Manage your risk!

EURUSD: Rally Stalls at Resistance - Correction To 1.1860Hello everyone, here is my breakdown of the current EURUSD setup.
Market Analysis
EURUSD has recently transitioned from a prolonged consolidation into a strong impulsive bullish move. After respecting a rising trend line and repeatedly breaking above the descending triangle resistance, price showed increasing bullish momentum, confirming a structural shift to the upside. This breakout led to a sharp rally, pushing EURUSD into the higher price area and directly into a clearly defined Resistance Zone around 1.1940–1.1950. At this resistance, price behavior has changed noticeably. After the initial breakout above the zone, EURUSD failed to sustain acceptance at higher levels and printed signs of exhaustion, including a false breakout and rejection wicks. This suggests that buyers may be losing control near this key resistance, while sellers are beginning to step in.
Currently, price action shows hesitation and consolidation below the resistance, indicating a potential distribution phase rather than continued impulsive strength. Below the current price, the Support Zone around 1.1860 stands out as a critical area. This zone previously acted as resistance and was later flipped into support during the bullish breakout, making it a key level for short-term structure. A pullback toward this support would align with a healthy corrective move within the broader context. Overall, while the higher-timeframe trend recently turned bullish, the market is now reacting at a major resistance level, and the structure suggests that the current move may be corrective rather than a continuation breakout.
My Scenario & Strategy
My primary scenario favors a short setup as long as EURUSD remains below or shows clear rejection from the 1.1940–1.1950 Resistance Zone. A confirmed rejection from this area could trigger a corrective move back toward the 1.1860 Support Zone, where buyers may attempt to re-enter. If selling pressure accelerates, a deeper pullback toward the rising trend line could follow.
However, if price achieves a clean breakout and strong acceptance above 1.1950, this would invalidate the short bias and open the door for further bullish continuation. For now, EURUSD is at a key decision point, and patience is required to see whether sellers can defend resistance or buyers regain control above it.
That’s the setup I’m tracking. Thank you for your attention, and always manage your risk.

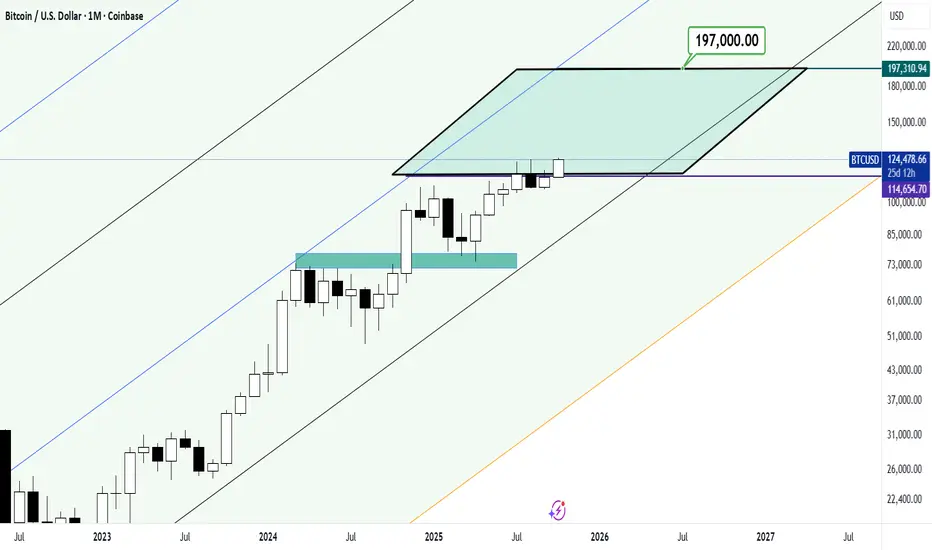
How long will the price stroking continue on the Bitcoin chart?A long-term analysis of Bitcoin’s trend suggests that we should expect a continued bullish trend in the coming months!
A price range of $197,000 per Bitcoin may seem far-fetched, but it would be very desirable and appealing to holders of this asset!!
Good luck!
Possibility Of Buying OpportunityHello Everyone, Welcome to Humam_FX
This is an analysis of (xauusd) that I've prepared based on the DOL. Through this, we can understand what the upcoming move of the market might be. I hope this analysis will be very helpful for all of you.

Possible wave 5?This count is based on my assumptions so anything can happen not a trading or financial advice just for educational purposes only kindly do your own ta thanks trade with care good luck.

Bitcoin - Weekly OutlookHistory equals wisdom and knowledge right? This chart shows every cycle top is the next cycles bottom. We are very close to that bottom as we speak. There is no longer any profits to make by selling and hoping for it to go lower. I believe this is THE moment to be a buyer for the medium to longterm. It is possible we will go sideways for a while but I think the upside is a more likely outcome after this weekly candle close IF it succeeds in closing above the 64 k.

USDJPY Uptrend in Focus | Fed Chair News Supports USDHey Traders,
In tomorrow’s trading session, we are closely monitoring USDJPY around the 154.150 zone. USDJPY remains in a well-defined uptrend and is currently undergoing a healthy corrective pullback, approaching a key trendline confluence and the 154.150 support-turned-resistance area, which may act as an important reaction zone for continuation.
From a fundamental perspective, the recent nomination of a new Federal Reserve Chair has helped support the US Dollar in the short term, as markets anticipate a more conventional and fiscally disciplined policy stance. This near-term USD strength could provide additional upside momentum for USDJPY, aligning well with the prevailing bullish technical structure.
As always, wait for confirmation and manage risk responsibly.
Trade safe,
Joe.

GOLD ( XAUUSD ) Buying Trade idea From the Support LevelHello Traders
In This Chart GOLD HOURLY Forex Forecast By FOREX PLANET
today Gold analysis 👆
🟢This Chart includes_ (GOLD market update)
🟢What is The Next Opportunity on GOLD Market
🟢how to Enter to the Valid Entry With Assurance Profit
This CHART is For Trader's that Want to Improve Their Technical Analysis Skills and Their Trading By Understanding How To Analyze The Market Using Multiple Timeframes and Understanding The Bigger Picture on the Charts

USDCAD – Initiative Sell-Off | Gap Fill & Rotation Between LVN aUSDCAD has printed a strong initiative sell-off, breaking below prior balance and leaving behind inefficiencies (gap) in the auction.
Price is now trading in a highly reactive environment, between two major Market Profile references:
🔴 Upper reference
Value Area (prior balance)
Acts as a magnet zone if price accepts back above VAL
Represents the area where fair value was previously established
🔵 Lower reference
LVN (Low Volume Node)
Indicates poor acceptance / fast auction area
Potential zone for responsive buyers or continuation if rejected
🔍 AMT Logic:
The impulsive move suggests initiative sellers in control
The current structure is a corrective rotation, not a trend confirmation yet
Acceptance above VAL opens the door for a rotation back into value
Rejection below value keeps the auction targeting lower references
This is a two-sided trade environment → execution must be based on acceptance vs rejection, not anticipation.
⚠️ Let the market show acceptance before committing.
Not financial advice – risk management first.

AU ShortW: Downtrend, price broke above trendline
D: Uptrend, respecting the lows
4H: Uptrend, respecting the lows
1H: Downtrend, price retraced 61.8%
CURRENTLY: I'm looking for price to continue short to previous support area and close the gap at -61.8 on H1 FIB
FIB Exits
TP1 @ -27%
TP2 @ -61.8%

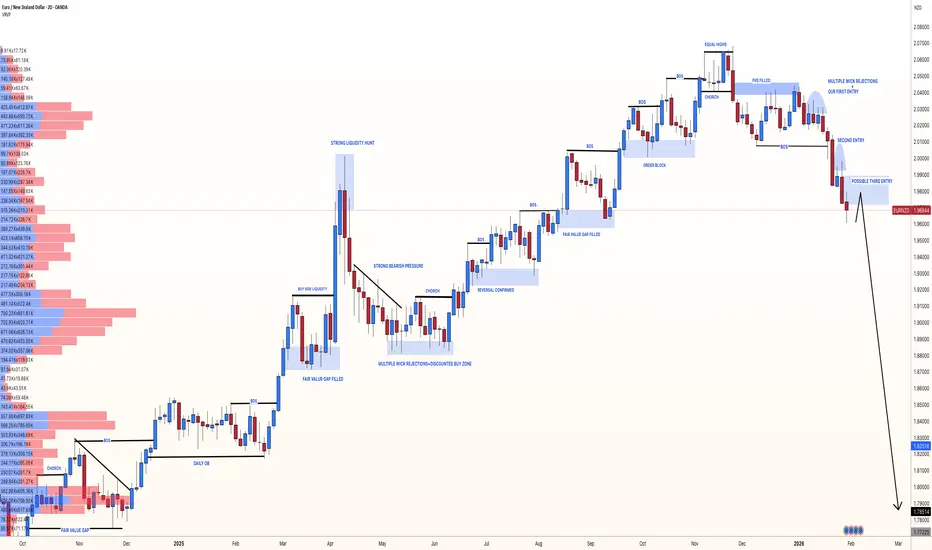
EURNZD: +1920 Pips Swing Sell to compete by 2026?EURNZD has been declining since NZD became the strongest currency at the current market. Our two entries are currently performing well but there’s a strong chance the price will drop around 1920+ pips. This would be one of the biggest drops EURNZD could experience. The timeline for this trading setup to complete is by 2026. It’s also not confirmed and the price could take longer to reach our take profit.
If you enjoy our work, please like and comment. Don’t forget to follow us for more!
Team Setupsfx_
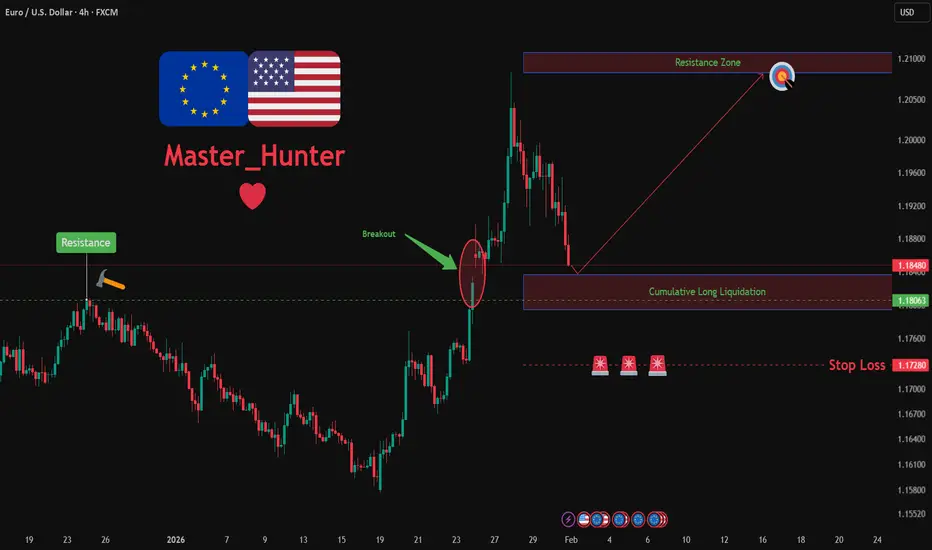
EURUSD: Bullish Push to 1.208?FX:EURUSD is eyeing a bullish continuation on the 4-hour chart , with price rebounding from support after recent consolidation, converging with a potential entry zone that could fuel upside momentum if buyers push through short-term resistance. This setup suggests a rally opportunity amid the ongoing uptrend, targeting higher levels with approximately 1:2.5 risk-reward .🔥
Entry between 1.1800–1.18350 for a long position. Target at 1.2080 . Set a stop loss at a daily close below 1.1828 , yielding a risk-reward ratio of approximately 1:2.5 . Monitor for confirmation via a bullish candle close above entry with rising volume, leveraging the pair's momentum near support.🌟
Fundamentally , EURUSD is trading around 1.182 in early February 2026, with key events this week potentially driving volatility. For the Euro, Thursday February 5 at 1:15 PM UTC brings the ECB Interest Rate Decision (previous 1.75%), where a hold or dovish signals could weaken EUR amid economic concerns. Also on February 5, the ECB Press Conference at 1:45 PM UTC for policy insights that may cause sharp moves. For the US Dollar, Wednesday February 4 at 2:15 PM UTC features ADP Non-Farm Employment Change (Jan, forecast 41K), potentially pressuring USD if softer. Thursday February 5 at 1:30 PM UTC brings Unemployment Claims (week of Jan 31, forecast 209K), with higher figures weakening USD. Friday February 6 at 1:30 PM UTC includes Non-Farm Payrolls (Jan, forecast 50K) and Unemployment Rate (Jan, forecast 4.4%), the week's highlight—weak data could favor EUR upside. 💡
📝 Trade Setup
🎯 Entry (Long):
1.1800 – 1.1835
(Entry from current price is valid with proper risk & position sizing.)
🎯 Target:
• 1.2080
❌ Stop Loss:
• Daily close below 1.1828
⚖️ Risk-to-Reward:
• ~ 1:2.5
💡 Your view?
Does EURUSD continue higher toward 1.2080, or will ECB/NFP volatility force another consolidation before the next leg up? 👇
WTIUSD: Bearish Drop to 62.7?CFI:WTI is eyeing a bearish reversal on the 4-hour chart , with price testing the upper boundary of an upward trendline after forming higher highs and a breakout candle near resistance, converging with a potential entry zone that could trigger downside momentum if sellers defend against further upside. This setup suggests a pullback opportunity amid the ongoing rally, targeting lower support levels with risk-reward exceeding 1:3 .
Entry between 65.0–65.24 for a short position. Target at 62.7 . Set a stop loss at a daily close above 65.8 , yielding a risk-reward ratio of more than 1:2 . Monitor for confirmation via a bearish candle close below entry with rising volume, leveraging oil's sensitivity to geopolitical developments.🌟
Fundamentally , crude oil faces significant upside pressure from escalating tensions in the Middle East, particularly the heightened risk of direct conflict between Iran and the United States , which could disrupt supply chains, trigger Strait of Hormuz concerns, and lead to sharp price spikes in the short term. 💡
📝 Trade Setup
🎯 Entry (Short):
65.0 – 65.24
🎯 Target:
• 62.70
❌ Stop Loss:
• Daily close above 65.80
⚖️ Risk-to-Reward:
• > 1:3
⚠️ Important: This is a very high-risk trade due to extreme oil volatility and headline-driven moves.
💡 Your view?
Do sellers step in near 65 for a healthy pullback to 62.70, or do geopolitics keep pushing oil higher despite technical exhaustion? 👇

Silver is in the Bullish directionHello Traders
In This Chart XAGUSD HOURLY Forex Forecast By FOREX PLANET
today XAGUSD analysis 👆
🟢This Chart includes_ (XAGUSD market update)
🟢What is The Next Opportunity on XAGUSD Market
🟢how to Enter to the Valid Entry With Assurance Profit
This CHART is For Trader's that Want to Improve Their Technical Analysis Skills and Their Trading By Understanding How To Analyze The Market Using Multiple Timeframes and Understanding The Bigger Picture on the Charts

ONDO, so much for the RWA narrativeLSE:ONDO is almost at all time low. the Real World Asset (RWA) narrative is still around but never really took and instead punishing anyone with capital who belives.
Weekly RSI is oversold, the Fibs have nearly be ran completely. Its the last stand for ONDO. No weekly 200EMA and well below the weekly pivot.
I think we are going to see bottoms soon enough. Dumping on a low liquidity Saturday is a suspicious move that could trigger a capitulation event.
Safe trading

S&P 500 beaar It not a good signalCould be a red monday's comming
downtrend break out.
I hope it will cooling down tonight and going up tmr

What's happening at Tesla!!I think Tesla should reach a price range of about $50 cheaper than the current price along the box drawn in the chart!

GU LongW: Uptrend, respecting the lows
D: Uptrend, price broke daily trendline
H4: Uptrend, price hit -61.8 on 4H FIB, and reversed
1H: Downtrend, price hit -61.8 + There's BULLISH divergence on minor RSI.
CURRENTLY: I'm looking for price to go long to previous support area @ H1 trendline for a minor structure trade

EURUSD Will Rise After BreakoutHello Traders
In This Chart EURUSD HOURLY Forex Forecast By FOREX PLANET
today EURUSD analysis 👆
🟢This Chart includes_ (EURUSD market update)
🟢What is The Next Opportunity on EURUSD Market
🟢how to Enter to the Valid Entry With Assurance Profit
This CHART is For Trader's that Want to Improve Their Technical Analysis Skills and Their Trading By Understanding How To Analyze The Market Using Multiple Timeframes and Understanding The Bigger Picture on the Charts

GBPUSD – Post-Impulse Balance | LVN Rejection & 50% Fibo SupportGBPUSD has printed a strong impulsive move followed by a transition into short-term balance on the 4H timeframe.
Price is currently trading between two key auction references:
🔴 Upper zone
LVN (Low Volume Node)
Acts as auction rejection / resistance, where price previously moved too fast
Expect responsive sellers if price re-enters this zone without acceptance
🔵 Lower zone
50% Fibonacci retracement aligned with LVN
Represents a high-probability responsive buyer area
Potential support for continuation if value is defended
🔍 Market Logic (AMT):
The impulse created inefficient structure → market is now correcting
Acceptance above the upper LVN = continuation scenario
Rejection from LVN = rotation back toward 50% Fibo / lower LVN
Loss of the lower zone opens the door for a deeper rebalancing toward prior value
This is a rotation environment, not a chase market.
Let the market confirm acceptance or rejection before execution.
⚠️ Context first, execution second.
Not financial advice – manage risk.
