MNQ Premarket Plan (POI Map) — 1/15🚨 MNQ Premarket Plan (POI Map) — 1/15
Bias/Context: We’re pressing the 25,870–25,880 decision zone (POI1 / near PDH). This is where trend day continuation OR rejection can start.
📍 Upside POIs (targets)
• POI1 25,871.25
• POI2 25,920.50
• POI3 26,006.00
• POI4 26,083.50
• POI5 26,106.25
📍 Downside POIs (supports)
• 25,738.75 → 25,652.75 → 25,615.50
• then 25,554.50 / 25,538.00
• deeper: 25,502.25 → 25,450.25 → 25,388.00 → 25,357.75 (FVG mid)
• worst case: 25,295.75
✅ Gameplan
Bull case: Hold/reclaim above 25,871–25,879 → push 25,920.50 then 26,006.00. If momentum stays strong, runner toward 26,083.50–26,106.25.
Bear case: Rejection at 25,871/25,920 → break back under 25,738.75 → target 25,652.75 then 25,615.50. If weakness accelerates, look for the next shelves below.
Rules today: First 15m range + POI retests only. No chasing mid-candle. If spreads/volatility spike → size down.
Trendpattern

Liquidity Grab into Reversal (PDH / AM High → Sellside Move)1/13 Session Recap — Liquidity Grab into Reversal (PDH / AM High → Sellside Move)
Today’s price action gave a clean, teachable sequence:
Market Structure
• Price pushed into an upside resistance pocket (PDH + upper POI area / AM High zone).
• After the tag, the market showed rejection + displacement down, signaling the reversal was active.
• The rest of the session delivered a sellside expansion into lower levels.
What I looked for
1. Tag of key upside level (PDH / AM High region)
2. Rejection candles / failure to hold above level
3. Shift in momentum → continuation lower
Execution (Options)
I executed the move using QQQ puts and scaled:
• 626P (starter / main)
• 624P and 620P (adds as confirmation strengthened)
Outcome
✅ Clean reversal execution
✅ Scaled entries + profit-taking into the dump
✅ Net: +$165.68
Key takeaway
The edge was NOT predicting — it was waiting for price to reach the level, then reacting to confirmation.
(Educational only, not financial advice.)

This Gold Drop Is a Trap — Smart Money Is Waiting Right HereMARKET BRIEFING – XAU/USD (1H)
Market State:
Gold is in a controlled corrective phase after failing to hold above the recent high. Price is now compressing toward a key demand zone, with momentum slowing rather than accelerating lower. This is not panic selling it’s positioning ahead of a macro catalyst.
Structure Read:
– Clear lower highs under a descending trendline → short-term bearish pressure
– Price is approaching a major reaction level (~4,205 – 4,215)
– This zone aligns with previous structure + demand, making it a decision point, not an automatic breakdown
Key Levels:
– Resistance: ~4,315 – 4,320
– Current Price Area: ~4,280
– Demand / Reaction Zone: 4,205 – 4,215
Macro Context – Why Non-Farm Matters Here
– NFP is the next major volatility trigger for USD and yields
– Market is currently flat positioning, waiting for labor data confirmation
– A weaker NFP → USD softens → Gold likely reacts sharply from demand
– A strong NFP → brief downside liquidity sweep possible, but still into major demand
This explains the compression and hesitation on the chart — institutions are waiting, not exiting.
Scenario Outlook
Primary Scenario – Reaction then Expansion (Post-NFP):
– Price sweeps liquidity into 4,205 – 4,215
– Holds structure
– Sharp reaction higher toward 4,315 – 4,320
– Break above opens room for trend continuation
Alternative Scenario – Deeper Shakeout:
– Only a clean acceptance below 4,200
– Would delay bullish continuation, not invalidate the larger structure
Gold is not breaking it’s waiting.
The market is pausing ahead of Non-Farm, letting liquidity build before direction is revealed.
Wait for Non-Farm. Let the data move price not emotion.

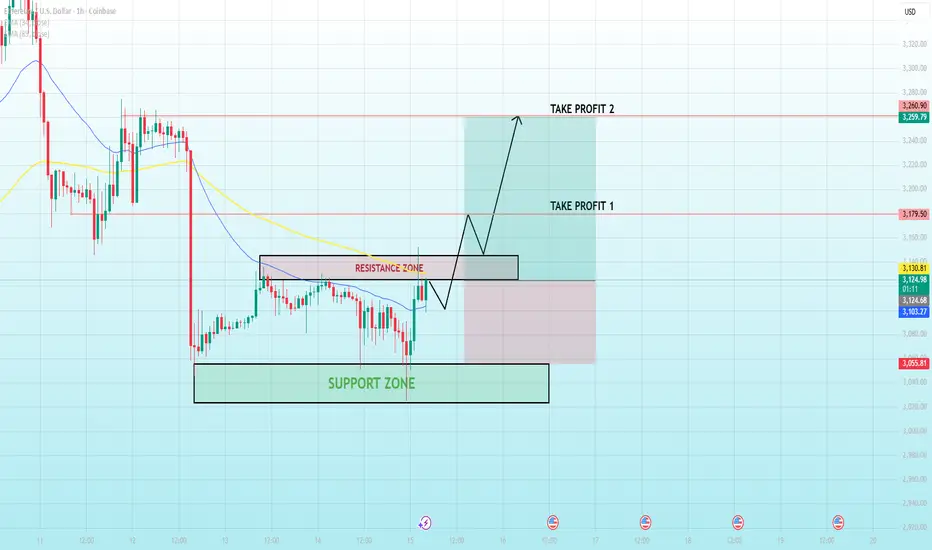
Ethereum Tests a Key Flip Zone....🔹 MARKET BRIEFING – ETH/USD (1H)
Market State:
– Ethereum has reacted strongly from the lower support zone and is now pressing into a well-defined resistance area.
– The impulsive bounce suggests short-term momentum recovery, but price is still interacting with prior supply, making this a decision point rather than a confirmed continuation.
Key Technical Levels:
– Support Zone: 3,030 – 3,060
– Resistance / Flip Zone: 3,120 – 3,145
– Take Profit 1: 3,175 – 3,185
– Take Profit 2: 3,250 – 3,265
– EMAs are flattening, reinforcing a transition from corrective to neutral structure.
🌍 Macro Context – What Supports the Upside Attempt
– Bitcoin Stability: BTC holding above recent lows reduces systemic downside pressure on ETH.
– Fed Expectations: With rates priced to remain steady, risk assets are allowed to recover technically, though without aggressive expansion.
– Liquidity Rotation: Post-selloff conditions favor mean-reversion rallies, especially from clean support zones.
Next Move:
– Acceptance above the 3,145 resistance zone would confirm a bullish flip and open the path toward 3,175 → 3,265.
– Failure to hold above resistance would likely result in a pullback toward the 3,060 support, keeping ETH range-bound.
Bottom Line:
– Ethereum is at a make-or-break level.
– Strength above resistance confirms continuation rejection reinforces a broader consolidation phase until a clearer macro catalyst emerges.
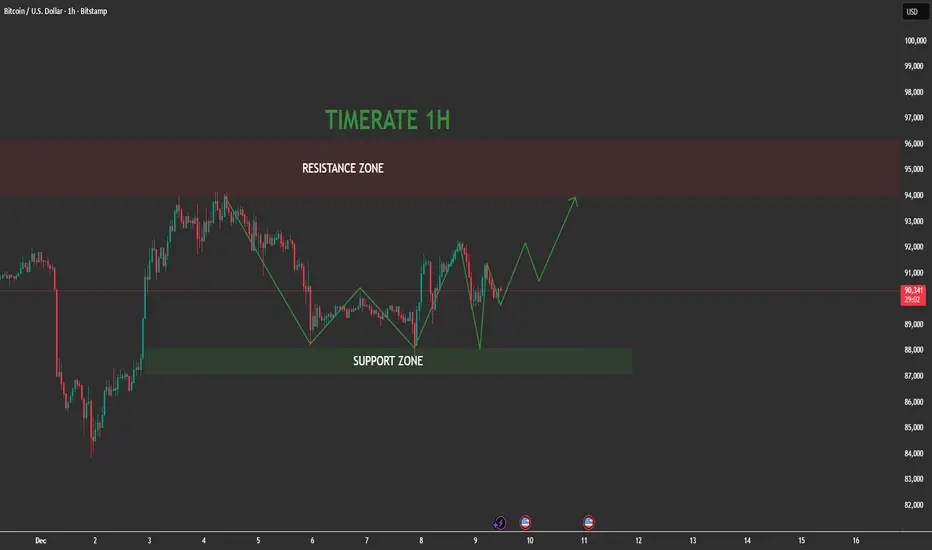
Bitcoin Repeats a Familiar Pattern - NEXTZone Is Already Defined🔹 MARKET BRIEFING – BTC/USD (1H)
Market State:
– Bitcoin is once again trading inside a repeating range structure, similar to the previous consolidation phases marked (1 → 3).
– Price has just rebounded from the lower demand area and is now holding above short-term support, while still trading below the key moving averages, keeping the broader structure neutral-to-corrective.
Key Technical Levels:
– Demand / Base Zone: 87,800 – 88,600
– Mid-Range Reaction Level: 90,000 – 90,300
– Major Resistance / Supply Zone: 93,000 – 93,500
– The projected move toward zone (4) aligns with prior range highs and unfilled liquidity.
🌍 Macro Context – Why This Remains a Range, Not a Breakout
– Federal Reserve: Policy expectations remain stable with no immediate liquidity expansion signal. This limits impulsive upside in risk assets.
– Liquidity Conditions: The recent downside move cleared leveraged longs, enabling a technical rebound, but macro liquidity is not supportive of trend continuation yet.
– Risk Sentiment: Broader markets continue to show consolidation behavior, reinforcing mean-reversion rather than directional conviction.
Next Move:
– A controlled push toward 90,000–90,300 is likely as part of a corrective recovery.
– Extension toward the 93,000–93,500 resistance zone is possible, but this area is expected to act as a decision point, not an automatic breakout.
– Only acceptance above 93,500 would invalidate the range-based thesis and shift the bias toward trend continuation.
Bottom Line:
– Bitcoin is following a structured, repeating range pattern, not randomness.
– Until macro conditions shift, rallies should be viewed as range extensions into resistance, not confirmed trend reversals.

BTC tops November 2024 and we are in distribution.Yes you are reading it right , Btc tops by the time Trump won the 2024 election as you can see the parabollic move not only in BTC but with other alts also.
I have 3 unignored observations:
1. MSTR topped at Nov 2024 by the time they purchase 50k plus BTC.
2. Notice the power of three at the btc chart started March 2025 and we are currently at expansion.
3. Privacy coins rallied- this is common scenario after btc tops just like what happens way back 2021 top where meme and metaverse coins rallied too much.
The duration for me is unknown, it will all depends on the MM and elites, but the bottom? I have two buy points, one at 50ksh and the other which is I am praying hard is the 30ksh level.
I know a lot will be disappointed but yeah crypto tops bro, time will tell, for me there was mini altseason parabollic move happens same month Btc did a mini parabollic move and some alts extending to December 2024 and the usual last part was the Meme rally which is the Trump meme coin on January 2025(crypto pros knows this).
Right now I will just wait for the bottom. If you will ask me how ugly will be the scenario of bottom then I think it is really ugly. I know 3 scenarios but I will just keep it for myself for now.

Is Bitcoin Quietly Building Power for a Breakout?📌 1. Market Structure
Bitcoin on the 1H timeframe is forming a clear higher-low structure off the support zone.
Price rejected the green support block aggressively, showing buyer absorption.
The current structure is transitioning from a consolidation phase into a potential bullish continuation leg.
📌 2. Key Zones
Support Zone (Strong Demand):
- Located around the $88,800 – $89,400 region.
- Price has tapped this zone multiple times and continues to bounce — clear demand.
Resistance Zone (Major Supply):
- The large red block at $94,000 – $97,600.
- This is the target zone for the next impulse move.
📌 3. Price Action
- Price formed a V-shaped recovery from support.
- Followed by a sequence of HL → HH attempts, signaling trend resumption.
- The latest pullback is shallow — a bullish sign showing sellers are weak.
- The green projection aligns perfectly with standard bullish market flow:
higher low → push up → correction → strong breakout leg.
Momentum is slowly shifting from neutral to bullish.
📌 4. Technical Confirmation
-Buyers defended support with strong reaction wicks.
-No breakdown beneath the key swing low — bullish structure intact.
-Mid-range is now acting as a local accumulation zone.
-Liquidity above $91,200 and $92,500 is likely to be targeted next.
This setup aligns with classic trend continuation inside a wide range.
📌 5. Trading Plan (Entry – SL – TP)
🎯 Long Setup
Entry: 90,300 – 90,450
Stop Loss: 89,650 (below last swing low & support zone)
Take Profit 1: 92,500
Take Profit 2: 94,800
Final Target: 97,500 (top of resistance zone)
Why this works:
You’re entering on a bullish higher low, with low risk and high reward as price moves toward the resistance block.
The Market Is Quietly Building a Trap1. Market Structure
- Price has been climbing cleanly from the support zone, forming a consistent bullish sequence: Higher Lows (HLs) and Higher Highs (HHs).
- Each yellow swing shows buyers still in control but momentum is visibly slowing as price pushes into the major resistance zone above.
2. Key Zones (Support & Resistance)
- Support Zone: Strong reaction base where the reversal started; buyers clearly defended this level multiple times.
- Resistance Zone: The market is now pressing into a heavy supply area visible from previous bearish reactions. This is where buyers typically weaken and liquidity shifts to the sellers.
3. Price Behavior at the Zone
- Inside the resistance area, price is starting to produce smaller HHs, overlapping candles, and hesitation early signs of bull exhaustion.
- The projected yellow path on your chart visualizes the most probable flow:
- A final liquidity grab above the resistance, then a sharp pullback as demand weakens.
4. Expected Scenario
The bullish structure remains intact for now, but the market is setting up a textbook bull trap.
Most likely scenario:
- Price pushes slightly higher to sweep liquidity
- Fails to maintain momentum
- Drops back into the resistance zone
- Then confirms the shift with a new Lower High (LH) → Start of short-term bearish correction
5. Trading Plan
No chasing longs into resistance.
Instead, wait for:
- A liquidity sweep above the zone
- Break of the minor bullish leg
- Retest → rejection → short entry
- Target: mid-range or the previous HL zone
This is a high-probability counter-move, aligned with how smart money manages liquidity at key levels.

Gold Is Preparing for a Reversal — Only Smart Money Will 📌 1. Market Structure
Gold is currently forming a bullish market structure on higher timeframes, with clear sequences of:
- HH (Higher Highs)
- HL (Higher Lows)
The recent drop created a series of LL & LH patterns, but this occurs inside a falling wedge, which typically appears as a bullish correction phase before a strong continuation upward.
The wedge + liquidity sweep + key HL zone indicates a potential trend continuation.
📌 2. Key Zones
Major Support Zone: 4163 – 4170
This is the large liquidity zone where price previously formed HL + BOS.
Price is now dipping back into this zone — ideal for liquidity collection.
Upper Resistance Target: 4230 – 4265
This is where previous HH formed and where price may extend after breaking the wedge.
📌 3. Price Action
- Price broke structure (ChoCh) during the drop, but this move is corrective, not reversal.
- The wedge is compressing with lower volatility and higher rejection wicks.
- Sellers are losing strength; buyers are absorbing entries near the HL liquidity zone.
- Current projection shows a possible V-shaped reversal or a slower corrective retest bounce, both converging to bullish continuation.
This matches your yellow & green projection lines.
📌 4. Technical Confirmation
-Falling Wedge: A classic bullish reversal pattern.
-Liquidity Sweep: Price wicked below the previous LL, grabbing liquidity for buyers.
-BOS signals: Multiple Break-of-Structure points confirm prior bullish intent.
-Rejection at Support: Strong wick rejections inside the wedge base show institutional buying.
-Fib Confluence (if applied): 0.618–0.705 zone aligns perfectly with the current rebound.
All technicals suggest a bullish reversal is highly probable.
📌 5. Trading Plan
🎯 BUY Setup
Entry Zone: 4165 – 4175 (at wedge bottom / liquidity zone)
Stop-Loss: 4148 (below liquidity sweep & wedge invalidation)
Take Profit 1: 4210 (first structure break)
Take Profit 2: 4235
Final Target: 4260 – 4265 (previous HH)
Why this setup works:
You’re entering at the end of a liquidity sweep, inside a falling wedge, at a major HL zone, with BOS support behind you.
This is exactly where institutions enter not retail traders.

IDEA GBP/USDThis basic analysis is based primarily on strong market areas where we should expect a reaction; I believe there is a high probability.

EURUSD TRADEIts been a while, here is my trade, see the charts for your stops and target.
this is only my trade for this week on this pair.
Trade at your own risk. if the stops and target hits, I follow up next idea.
This is not a financial advice.
Follow for more.

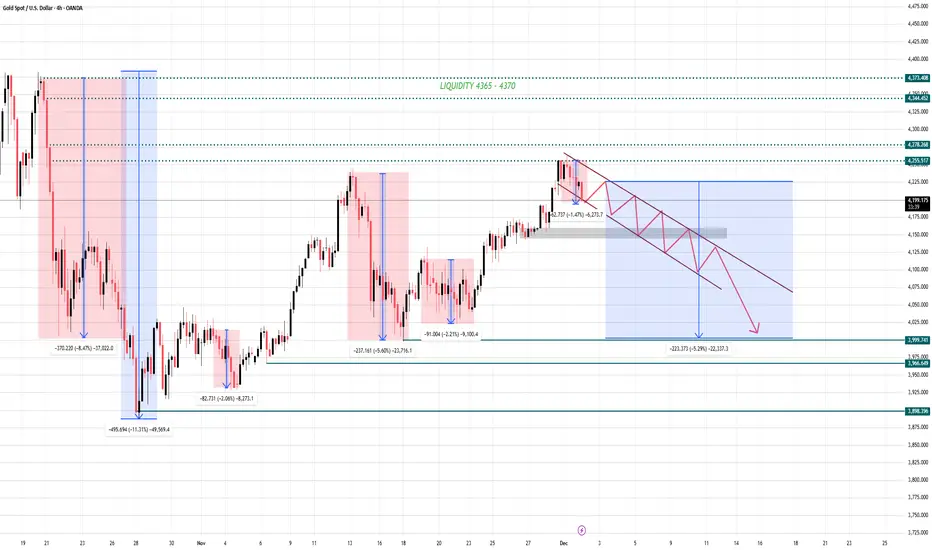
Gold Is Entering a Danger Zone—A Sharp Drop May Hit Before....📌 SETUP SIGNAL (GOLD – 4H)
Strategy: Sell the Downward Channel – Follow the Correction
1️⃣ Sell Setup
Entry: 4188–4175 (after a confirmed 4H close below 4188)
Stop-Loss: 4240
Take Profit:
TP1: 4120
TP2: 4050
Main Target: 4000–3990
Reason:
- Price is moving cleanly inside a descending correction channel.
- Repeated sell-offs + weak bullish reactions show sellers are still in control.
- Breaking 4188 confirms continuation toward the lower liquidity zone.
2️⃣ Alternative Scenario (Low Probability)
Bullish invalidation: Only if price breaks above 4280 (4H close).
→ Then the market may shift upward toward 4365–4370 liquidity.
📉 QUICK MARKET OUTLOOK – GOLD 4H (Rejection + Bearish Channel Forming)
Based on the current 4H structure, Gold is showing a clear pattern of repeating deep corrections every time it reaches major resistance/liquidity zones.
The latest price action continues to repeat this same behavior:
Key Observations
- Price has once again rejected strongly from the 4270–4280 zone (same rejection region as previous drops).
- A descending bearish channel is forming → indicating controlled distribution.
- The recent downward legs are consistent with past moves:
-8.47%, -11.31%, -5.60%, -2.21% → the market has a clear history of sharp sell-offs.
- Current structure suggests a continuing corrective wave until deeper support.
📌 Bearish Scenario (High Probability)
Price continues moving inside the descending channel and breaks the short-term support.
Targets → 4120 → 4050 → 4000
Major liquidity & demand zone sits at 3990 – 3980
→ where large buyers historically step in.
If panic selling accelerates, price may extend toward: → 3888 – 3900
📌 Bullish Scenario (Low Probability)
Only activated if Gold breaks OUTSIDE the descending channel and reclaims: → 4280
This invalidates the bearish outlook and reopens the path to 4365 – 4370 liquidity.
🎯 FINAL CONCLUSION
Gold is currently in a corrective downtrend, moving exactly within a well-defined bearish channel.
Unless buyers break the structure, the market is likely heading for deeper retracement toward the 4000 zone before any meaningful bullish continuation.
"Stay patient. Stay disciplined. Let the market come to your levels."
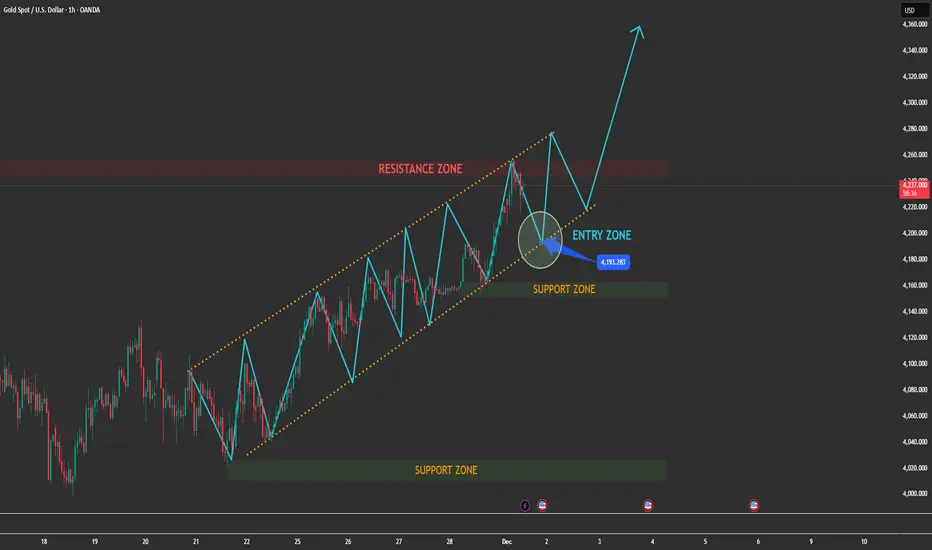
Still Watching the Market Move Without You? Fix That Today.1. Current Market Structure
- Gold is moving inside a well-defined ascending channel, respecting each swing high and swing low with precision — a clear sign that the bullish structure is still intact.
- Key observations:
+ Price has just rejected from the resistance zone at the top of the channel.
+ The current correction is healthy and normal within an uptrend, not a reversal signal.
+ Buyers are still defending the structure as long as price stays above the mid-channel + support zone.
+ Momentum remains bullish — any pullback into the highlighted ENTRY ZONE becomes a high-probability continuation setup.
This is exactly how a strong trending market behaves before its next leg up.
2. MAIN TRADING SCENARIO (HIGH PROBABILITY) – LOOK FOR LONG
➤ Scenario: Price pulls back into the ENTRY ZONE (channel bottom + support zone)
Expectations:
Price retests the lower boundary of the ascending channel
Buyers step in at the confluence area (trendline + structure)
A bullish rejection pattern → strong confirmation for LONG entries
Reasons this setup is high probability:
✓ Confluence of trendline support + horizontal support zone
✓ Clear bullish market structure (higher highs – higher lows)
✓ Retracement after hitting channel resistance is expected
✓ No sign of bearish reversal structure at the moment
Upside Target:
Once price bounces from the entry zone:
TP1: Retest of the resistance zone
TP2: Breakout of the channel → continuation to higher highs (as marked on the chart)
3. Alternative Scenario (Low Probability)
If price breaks below the channel and closes under the support zone:
Market shifts into a corrective phase
Wait for structure to rebuild
No aggressive sells — only reassess when major levels break decisively
But at the moment, the bullish structure remains strong.
4. Conclusion
Gold is still respecting its bullish channel perfectly.
The upcoming pullback is NOT weakness — it is an opportunity.
→ Priority: LOOK FOR LONG in the ENTRY ZONE.
→ Target: A new bullish impulse wave forming toward higher highs.
The Market Doesn’t Lie — But It Always Tests Your Nerve📈 NZD/USD TECHNICAL OUTLOOK — BUY FROM SUPPORT, TARGET THE BREAKOUT
1. Market Structure Overview
NZD/USD is currently correcting inside a descending pullback after a strong bullish impulse.
The structure is forming:
- A higher–low sequence, showing buyers are still in control
- A clear Support Zone where price previously reacted strongly
- A Resistance Zone above acting as the obstacle before a bullish breakout
Current price action is simply a retracement phase, not a bearish reversal.
2. Key Zone to Watch — LOOK FOR LONG
Your chart correctly marks the Entry Zone at the Support Zone.
Here’s why it’s high probability:
✓ Confluence for BUY
- Previous demand reacted sharply
- Market is forming a potential double-bottom or liquidity sweep
- Price is approaching the end of its corrective wave
- Momentum loss on the bearish leg
This area is where institutions typically accumulate long orders.
3. Main Scenario (High Probability)
[/b ]BUY FROM SUPPORT → BREAKOUT → FULL BULLISH CONTINUATION
When price taps the Support Zone:
-Look for rejection
- Look for a higher low
- Enter LONG on confirmation
- Stop loss below structure (as marked)
Take-Profit Levels:
- TP1: Mid-range / mini resistance
- TP2: Major Resistance Zone
- TP3: Full extension (your highest TP zone)
This matches your drawn black path:
Dip → higher low → breakout → strong bullish continuation.
4. Secondary Scenario (Lower Probability)
Price consolidates at Support but does not break higher immediately.
Even if so — this still favors accumulation, not selling.
As long as price stays above the Support Zone → the bias remains bullish.
5. Intraday Bias: BULLISH
- Structure: Uptrend
- Current move: Healthy pullback
- Key reaction zone: Support
- Best trade: BUY on rejection
- Risk management: SL below the liquidity sweep zone
This is a clean, textbook continuation setup.

TAKE PROFIT HIT EURYENEurjpy has wonderfully done as expected and we we able to get into a trade and hit take profit , there’s still more to come too , from this structure so can expect more opportunities

GBP/USD – 4H Technical OutlookMarket Bias:
Range (buyers holding support, sellers defending resistance)
Key Levels:
• Resistance: Major 4H zone where sellers are consistently active
• Support: Strong 4H demand + order block recently respected
• Market Structure: Price has already formed a higher high, signaling bullish intentions
Reasoning:
Price is currently trapped between a strong resistance above and a strong support/order block below.
Buyers successfully defended the support, creating a higher high — a sign of bullish strength.
However, sellers are still aggressively positioned at the resistance zone, creating a tug-of-war scenario.
Trade Idea:
Look for bullish continuation only if support continues to hold and price rejects the zone with strength.
Potential Entry:
• At/near the 4H support or after a clean bullish rejection candle
Stop Loss:
• Below the order block / support structure

Bitcoin Reversal Setup Toward 96K TargetBitcoin is currently trading within a corrective structure after breaking down from the central zone. The chart highlights a fair value gap (FVG), a support level below, and a potential short-term bullish push toward the 96,000 target before any deeper move. The market remains in a ranging phase with key levels marked for possible reactions.

CHN ready to runCHN has demonstrated encouraging developments after emerging from a descending wedge pattern, bolstered by a bullish RSI divergence and the formation of a bull flag on the hourly chart. Furthermore, the daily chart reveals hidden bullish divergence, complemented by support from a trendline established in July and a .05 Fibonacci retracement level. A decisive move above $2 would serve as a strong indicator of a structural shift, potentially paving the way for a more substantial upward trend. Good luck and happy trading! 🍀

Bitcoin Rebound from Support Toward Key Resistance TargetsBitcoin is showing a potential rebound from the support zone near $103,200. Price may target the $104,800 (Target 1) and $105,400 (Target 2) resistance levels if bullish momentum continues. The Fair Value Gap (FVG) suggests possible upward movement after recent correction.

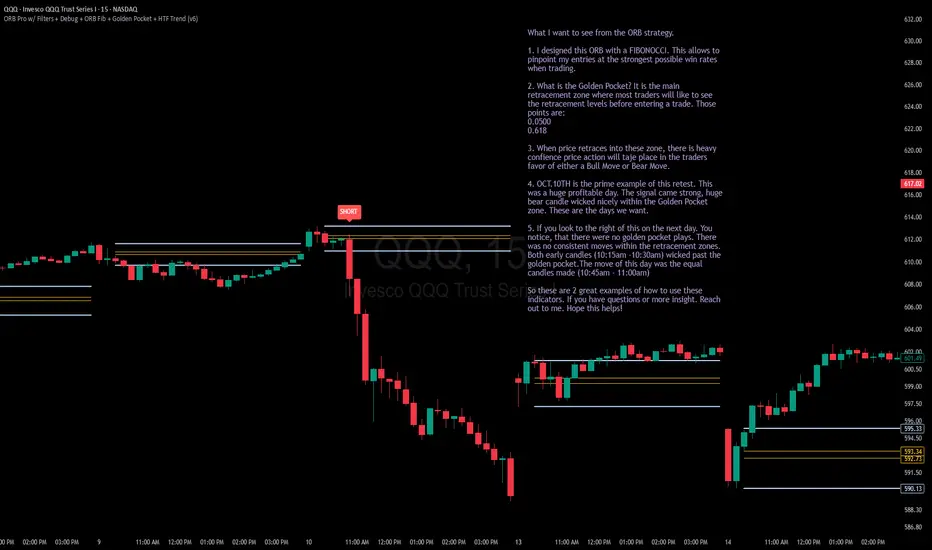
Some notes to reflect on. A little how to for the indicatorHey everyone,
Hope you guys & gals are doing well using these indicators. I'm publishing a chart that I wrote some notes for. Notes are offering some insight on what look for when using this indicator. If you have any questions, let me know. I am planning to get videos up soon when I get some extra free time.
Thank you again for the support!
GOLD on the RISE!XAUUSD moved as we analyzed. Now waiting for BreakOut from RESISTANCE to see if it will retesting and continue flying UP todsy or when markets reopen next week.

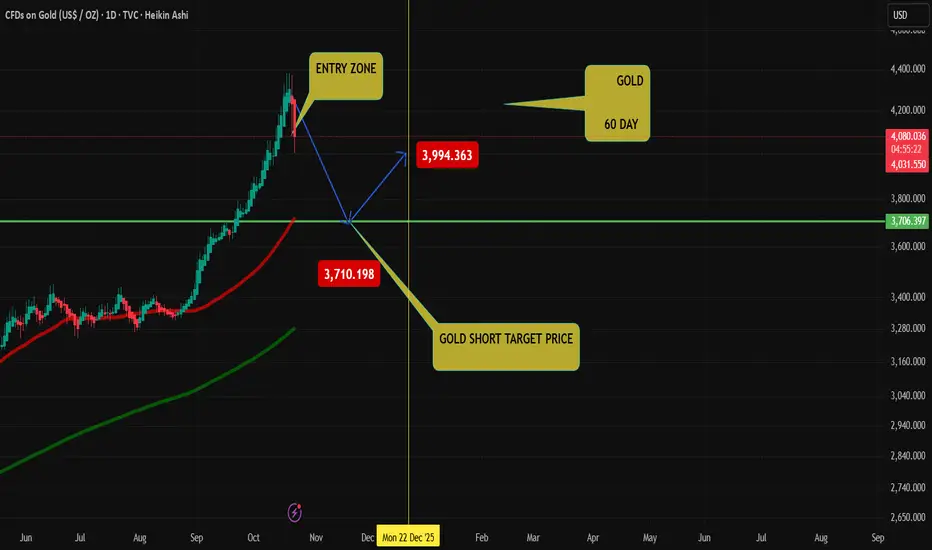
GOLD US SHORTGOLD 60 DAY Target point
You try! Easy Money,
The gold Only long position after!!!
check my profile gold / play button