GBPAUD Smart Money Reversal in Play | Liquidity Grab & doneHello Billionaires!!
The British Pound / Australian Dollar (GBPAUD) is setting up a Smart Money Concept (SMC)-based reversal structure, signaling a potential premium distribution before a strong bearish leg.
📊 Market Breakdown:
🟠 POI / Order Block tapped perfectly at the discount zone
🔵 FVG + IFVG alignment indicates potential retracement zone
⚙️ Volume Imbalance (IMB) marks the ideal area for liquidity sweep
🧠 Market Structure Shift (MSS) expected from premium zone
📉 After retracement to 2.085–2.095, expecting a sharp bearish continuation
💡 Smart Money Perspective:
Institutions may drive price up to fill imbalances and trigger retail longs, before initiating a sell-off back into the discount range (below 2.030).
Trendtrader

GBPUSD: Waiting for bullish pullback signalsIn my previous analyses, GBPUSD has been in a corrective downtrend on the daily timeframe. On the lower timeframes, the pair continues to test support and resistance levels to confirm the overall trend.
Daily timeframe outlook:
4h timeframe outlook:
* Trend: assessed using at least three trend indicators, with market structure as the primary guide.
** Weak or Reversal Signals: Assessed based on one of our criteria for trend reversal signals.
*** Support/Resistance: Selected from multiple factors – static (Swing High, Swing Low, etc.), dynamic (EMA, MA, etc.), psychological (Fibonacci, RSI, etc.) – and determined based on the trader’s discretion.
**** Our advice takes into account all factors, including both fundamental and technical analysis. It is not intended as a profit target. We hope it can serve as a reference to help you trade more effectively. This advice is for informational purposes only and we assume no responsibility for any trading results based on it.
George Vann @ ZuperView

Hellena | GOLD (4H): LONG to resistance area of 4104.Colleagues, gold is going up steadily and right now it is hard to say where the correction will be. If we look at the wave structure, I expect the completion of the higher order wave “3” and the middle order wave ‘5’. because wave “5” completes the impulse - it complicates the concept of where exactly this wave will end. I think the psychological level of 4100-4105 is suitable for this target.
I expect the price to reach the 4104 resistance area.
Fundamental context
Gold recently broke above $4,000, driven by strong safe-haven demand amid global uncertainty and expectations of U.S. rate cuts.
Central banks continue to accumulate gold, supporting demand structurally.
Deutsche Bank raised its 2026 target to $4,000, citing a weak dollar and sustained global demand.
Given the strength and stretched momentum, a pullback is plausible — but the exact timing remains unclear.
Manage your capital correctly and competently! Only enter trades based on reliable patterns!

BTC Trend Continuation Trading with Fibonacci and Price Action📹 In this video, I break down a powerful trend continuation strategy as we look at a BTC Bitcoin chart designed to help you identify high-probability trading setups 🎯.
📊 We’ll dive nto using the Fibonacci retracement tool alongside consistent, repeatable price action patterns that tend to appear in strong trends. When a specific setup reveals itself, that’s when we look to take advantage of the opportunity.
📈 The focus is on recognizing higher highs and higher lows in a bullish market structure, understanding how to align with momentum, and building confidence in trading the continuation of trend direction 🚀.
⚠️ Disclaimer: This content is for educational purposes only and not financial advice. Always manage your risk and trade responsibly.

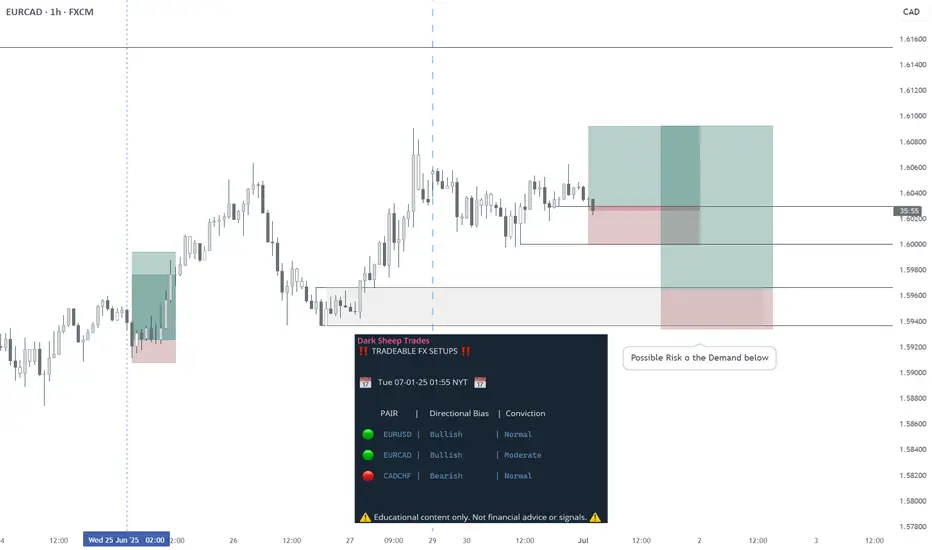
EURCAD - LONG - Statistically-backed FX shortlistEURCAD - LONG
Daily Outlook: Statistically-backed FX shortlist
@darksheeptrades
XAUUSD – Swing Trade and Trend FollowingXAUUSD – Swing Trade and Trend Following
Gold prices have been moving sideways, forming a consolidation range, and recently broke out to the upside last week.
Currently, the price is pulling back to retest the bullish Fair Value Gap (FVG). If it can bounce from the 3400 support level, the next target would be the Range Volatile Week High around 3500.
However, if the FVG fails to hold, the price may drop to the next support levels at 3350 and 3300.
These are critical supports that should not be broken, as they also align with the ascending trendline (Up Trend Line).
That said, this move is seen as a pullback for a potential continuation to the upside.
Strategy: Buy the dip
Wait for a reversal candlestick at the key support zones.
The bullish outlook would be invalidated if the price breaks below 3250.

short term long oppertunityit looks like we have settled for a bit and ready to start moving towards TP 1 in the new cycle I just opened a long position that ,i will be looking to sell between may 7th and may 18th

XAU/USD: Bearish Continuation Setup with SMC Framework~On the 4H chart, the previous bullish structure shifted to bearish intent after breaking the recent major higher low (HL). This confirmed a change of character (CHoCH) and suggested a potential trend reversal. Following the break, price took out buy-side liquidity (BSL) as inducement and fully mitigated the supply zone/order flow area, solidifying the bearish bias.
~Lower Timeframe Plan (30M & 5M):
As we approach the Sunday evening or Monday opening, I am closely watching the 30-minute chart for confirmation of a CHoCH that aligns with the 4H bearish intent. Once the CHoCH on the 30M is validated, I will refine my entry on the 5-minute chart by looking for a CHoCH flip into a precise order block or order flow zone.
Expectations:
I anticipate price to respect the mitigated supply zone on the 4H and continue its bearish trend. My targets are set at liquidity zones aligned with the higher timeframe structure. I will patiently wait for the setup to develop in alignment with Smart Money Concepts (SMC) principles, focusing on structure, liquidity inducements, and precise entries.
Key Levels:
• 4H bearish intent confirmed after HL break.
• 30M CHoCH confirmation: Awaiting.
• 5M entry: Pending precise setup during Sunday evening or Monday open.
Let’s Connect:
Does this setup align with your perspective on XAU/USD? Drop your thoughts or questions below!
Bless trading!

[Vienmelodic] EURUSD - 2 Jan 2025 SetupEURUSD Market structure are still now in a bearish mode. Spotted nearest supply area (Red Rectangle). This is the first supply area that breaking the market structure, it's ussually very good area to entry.
Entry Position : Short
Profit Target : 1:3 Shown on the chart image (Green Line)
Stop Loss : Slightly above supply area (Red Line)
Follow me if u guys making any gains from this idea.
Thanks
Vienmelodic

[Vienmelodic] GBPCHF - 2 Jan 2025 SetupGBPCHF Market structure are still Bullish. Spotted demand area (Green Rectangle). its the first demand area and theres a bullish engulfing candle before the area so its the evidence of strong bullish continuation pattern.
Entry Position : Long
Profit Target : 1:3 Shown on the chart image (Green Line)
Stop Loss : Slightly below demand area (Red Line)
Follow me if u guys making any gains from this idea.
Thanks
Vienmelodic

[Vienmelodic] CADCHF - 2 Jan 2025 SetupCADCHF Market structure are now in Bullish structure. Spotted demand area (Green Rectangle) and this area are breaking a new high so it the evidence of strong trend continuation.
Entry Position : Long
Profit Target : 1:3 Shown on the chart image (Green Line)
Stop Loss : Slightly below demand area (Red Line)
Follow me if u guys making any gains from this idea.
Thanks
Vienmelodic

[Vienmelodic] CADCHF - 3 Jan 2025 SetupCADCHF Market structure are making Bullish breakout once again. Spotted demand area (Green Rectangle) near our last worked area. this is the second demand area since we already got profits 1:3 on yesterday's setup
Entry Position : Long
Profit Target : 1:3 Shown on the chart image (Green Line)
Stop Loss : Slightly below demand area (Red Line)
Follow me if u guys making any gains from this idea.
Thanks
Vienmelodic

How to Trend Trade & Why I Avoid Trading Fridays & Mondays 👀👉 In this video, I take you through a detailed breakdown of my trend continuation strategy with the EURJPY. 🔍 We’ll explore key concepts like trend analysis, price action, and market structure, and I’ll share a simple yet highly effective method for identifying the best trade entry points. ✅ I’ll also explain why I choose to avoid trading on Mondays and Fridays and how this approach helps refine my trading discipline. ⚠️ Disclaimer: This video is for informational purposes only and is not financial advice. ⚠️

AUDCHF for next week still ebarish expectations
AUDCHF whats next,- technically based still bearish for expect in next week.
SUP zone: 0.57650
RES zone: 0.56800, 0.56600

BTC Trend AnalysisCRYPTOCAP:BTC is currently trading around $60,410 after a recent drop from the $61,000 level. The 1-hour chart shows that BTC faced resistance near $61,500, leading to a downward correction. Immediate support is found around $60,000, with a further drop possibly targeting the $59,000 level. On the upside, a break above $61,500 could push BTC towards the next key resistance at $63,000. The market is currently indecisive, so keep an eye on these levels for potential breakout or breakdown signals.

GBPUSD BUYWe currently you broke the trendline confirming a potential up trend. We got a retest after the break and a confirmation candle for the buy. We aiming for at TP1 and TP2 at 1:1 and 1:2

My Theory Bias on Gold⚱️#XAUUSD (GOLD / U.S. Dollar)
⏰Time Frame : 4-hour
📌Status : Neutral
‼️ Important
📆26.06.2024
By investigating the #gold graph on the 4-hour time span, we can see that in the wake of stirring things up around town focus of $2337 from our last examination, gold confronted weighty selling pressure and neglected to arrive at the ensuing targets. Following this, gold encountered a huge drop, remedying down to $2304, and has since seen recharged request in the wake of social occasion liquidity underneath this level. As of now, gold is exchanging around $2315. We really want to check whether the cost can remain over this basic level for the following 8 hours. Assuming the cost falls beneath $2309 once more, it will probably enter the $2200 territory. Notwithstanding, in the event that gold can settle above $2320, we could see it rise again to $2329. This investigation will be refreshed appropriately.

A Trading Plan Is Important For Success - Here Is MineIn this video we take a look at a trend continuation trading strategy. I explain my approach to trading how I identify a trend and what I look for for high probability trade opportunities. As always the information is for educational purposes only and not to be construed as financial advice.

Nifty Probable Trade idea1.If you think market will fall from tomorrow, without a pullback chances are rare.
2. This week or the next it will be in today's range most likely
3. If bull run is over, it will take to give confirmation in form to distribution and dump the big money at the top
4. Or if trend to continue then we have levels to reverse from the marked levels

DXY for the next few days.. Hello, Mates hope you all are doing well and enjoying the weekend.
This is my thoughts about DXY for the next few days.
NOTE: This is only based on technical analysis fundamental or geopolitical situations may change the direction to any side.

Bitcoin correction through time and price coming to an end?Bitcoin was all the rage in the first quarter of the year. Price was appreciating fast and everyone was gobbling up shares of the newly approved ETFs hand over fist before the highly anticipated halving. Bitcoin climbed 91% in 50 days from the January 23 low to the March 13th high.
However, after topping out in March around $74,000 Bitcoin has entered into a 61 day (and counting) correction through time and price which has done a great job at working off the froth, momentum chasers, and leveraged degens. In short, the attention shifted away from BTC.
It's too early to declare bullish victory definitively but this this zoomed out perspective continues to look extremely constructive to me and my bet is the low we saw around 56K on May 1 will be the low for this consolidation and so as long as we stay above that level (really I want to see Bitcoin stay above 59K), I'll maintain my long trade here.
If we roll over back into the mid to upper 50K's I'll consider myself wrong and stop out and move to the sidelines for the next setup to emerge.
For those who think the waters are too cloudy right now, waiting for a breakout back over 65K should be the unlock for new momentum to enter this market.
(disclosure: long)

GOLD SELL - 15 Min EntriesGold has broken out of 2 bullish trend lines and I am looking for a retest of the resistance level before entering a sell position.
Price may sweep the highs to take out the liquidity above resistance before moving bearish.
I will be looking for the retest then waiting for a closure below $2321.30 for extra confirmation.

GBPUSD: GET YOUR LONGS READY!We are seeing clean bullish momentum for this pair. Excellent and clear market structure of lower lows and lower highs.
Now looking for trend continuation to take a long trade.
Waiting for at least a 50% retracement into the resistance turned support- then we look for a bullish market structure shift on the 1hr and ATTACK!
This is looking like a very yummy long!
Follow and Stay tuned my friends ;)
