EUR/USD Is Walking on Thin Ice📉 EUR/USD TECHNICAL ANALYSIS — RISING WEDGE LOSING MOMENTUM
1. Market Structure Overview
EUR/USD is moving inside a Rising Wedge, a classic bearish reversal pattern.
Key observations from current price action:
- The higher highs are becoming weaker, showing fading bullish momentum.
- The lower trendline has been tested multiple times, increasing the probability of a breakdown.
- The price is hovering near your entry zone, right at the confluence between:
✓ Rising Wedge support
✓ Micro lower-high structure
- Candles show rejection wicks on the upside, indicating pressure from sellers.
This structure suggests the market is preparing for a bearish shift.
2. Main Scenario — Breakdown is More Likely (Preferred)
If EUR/USD breaks below the Rising Wedge support with a firm candle close:
👉 Expect a sharp sell continuation toward the demand zone.
SELL confirmation checklist:
- A candle closes below the dotted support line
- Price retests that broken line and rejects → your entry zone
- A new lower high forms
When this happens, sellers will dominate the next movement.
Downside Targets
Target 1: Support zone in the green zone
Target 2: Previous swing low of the wedge
Target 3: Extended bearish continuation if momentum accelerates
3. Secondary Scenario — Weak Bounce but Still Bearish
If price bounces slightly from the wedge bottom but fails to break the upper resistance zone, then:
- Market remains weakly bullish but highly vulnerable
- Momentum will continue to compress
- Eventually, a breakdown becomes the high-probability outcome
- Buy positions are not recommended here — risk > reward
4. Intraday Bias
📌 Bias: Bearish to moderately bearish
📌 Setup: Sell the retest near the entry zone
📌 Invalidation: Clean breakout above the resistance zone
Sellers are in control as long as the price stays inside the wedge and below the resistance zone.
5. Final Verdict
EUR/USD is signaling a high-probability bearish reversal:
Rising Wedge losing power
Buyer exhaustion visible
Support line weakened
Retest zone beautifully aligned for SELL positions
👉 Expect: Breakdown → Retest → Sell-off toward major support.
Trendtrading

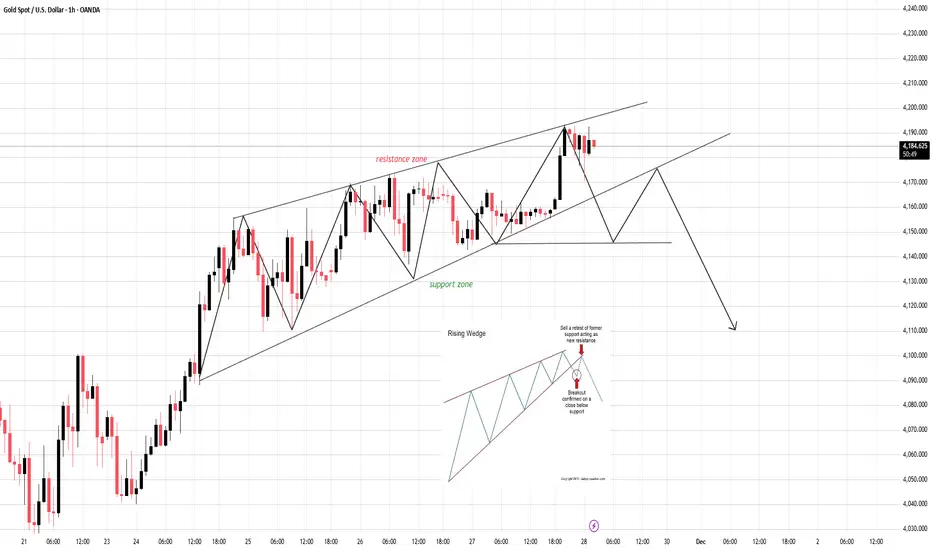
Gold Is Loading Pressure — The Next Breakout Will Be Violent1. Market Structure Overview
Price is currently respecting a rising channel, showing a consistent sequence of higher highs – higher lows, but with gradually compressed momentum near the upper boundary and the resistance zone.
Key observations:
- Price is hovering near the upper trendline of the ascending channel.
- The resistance zone is directly above current price, causing hesitation and wicks.
- The chart shows a potential indecision → correction → continuation pattern forming.
This reflects a market preparing for a bullish continuation, but only after a controlled pullback.
2. Expected Scenarios for Today
✓ Primary Scenario – Bullish Retest Before Breakout (High Probability)
Price is likely to:
- Pull back toward the midline/lower edge of the ascending channel (yellow zone).
- Form a higher low within structure.
- Execute a clean retest of the ENTRY ZONE highlighted on your chart.
- Break above the Resistance Zone → Continue toward higher targets.
This matches your projected structure perfectly.
Entry Logic:
- Wait for price to retest the rising trendline and show bullish confirmation.
- The ENTRY ZONE is valid and aligns with trend continuation.
Upside Targets:
- TP1: 4,215–4,225
- TP2: 4,250+
- TP3 (extended): 4,280+ if the breakout is impulsive.
✓ Secondary Scenario – Compression Before Break
If price stays inside the channel and moves sideways:
- Market remains bullish but indecisive.
- This builds liquidity for a stronger breakout later.
- No selling is recommended unless structure breaks.
This scenario still favors bulls—just slower.
3. Trend Bias (Intraday)
The dominant trend is:
➡️ BULLISH – Buy the dip, do NOT chase breakouts
Signs confirming bullish bias:
- Higher lows remain intact.
- Structure respects the ascending channel perfectly.
- Resistance is tested multiple times → weakening.
- Volume spikes on bullish waves, fades on corrections.
4. Professional Conclusion
Gold remains in a strong bullish continuation structure inside the rising channel.
Your ENTRY ZONE is positioned perfectly for a high-quality retest trade.
Plan of Action:
- Wait for the pullback to the trendline.
- Confirm bullish rejection.
- Enter long within the zone.
- Target the liquidity sweep above resistance.
Smart, calculated, high-probability setup. 🔥

ETH BREAKOUT: DON’T MISS THE NEXT BIG MOVE!📌 ETH/USD MARKET ANALYSIS – 30M (Professional Trader Style)
1. Overall Market Structure
- Price has been consolidating inside a descending channel.
- Forming consistent lower highs – lower lows, but selling pressure is weakening near the demand zone.
- Finally, price created a rectangle compression and then broke out aggressively above the descending trendline.
2. Key Zones
✔ Demand Zone (Strong Support): 2980 – 3010
Multiple rejections + strong bullish reactions → buyers clearly defend this area.
✔ Supply Zone (Key Resistance): 3065 – 3090
Price is approaching this zone again, but momentum suggests a high probability of BREAKING THROUGH.
3. Breakout Confirmation
The breakout candle shows:
- Strong bullish body
- Increased volume
- Clear break of previous lower high → CHOCH (Change of Character)
This signals that ETH is transitioning from a correction phase into a renewed bullish trend.
4. Trading Plan (Price Action Style)
📌 Primary Scenario – BUY the Retest
Wait for price to pull back into the broken supply zone (now a demand flip) at 3065–3075.
Enter BUY when you see:
- Rejection wicks
- Bullish engulfing
- FVG reaction
- Or any PA confirmation
🎯 TP1: 3120
🎯 TP2: 3160
🎯 TP3: 3200+
⛔ SL: Below 3045 (below breakout structure)
5. Why This BUY Setup Is High Probability
✔ Clean breakout of the descending channel
✔ Strong momentum push (not a weak fake-out)
✔ Beautiful defense at demand zone
✔ Trendline tested 3 times → valid breakout
✔ Market structure shift from bearish → bullish
6. Pro Tips
Don’t FOMO buy the breakout candle
Wait for a clean retest for better R:R
Focus on zone reaction + CHOCH + bullish momentum
Stay patient. The market always rewards disciplined traders.

Rising Wedge on the Edge — The Breakdown Is Only One Candle AwayCURRENT MARKET ANALYSIS & TODAY’S EXPECTED MOVE
1. Current Market Structure
The market is currently respecting the structure of a Rising Wedge — a pattern where price continues rising but momentum weakens, volatility compresses, and the probability of a bearish breakdown increases.
Key observations:
- Price is moving near the upper boundary of the wedge.
- Newly formed highs lack strength → buying pressure is fading.
- Recent candles show long upper wicks, indicating strong sell pressure at resistance.
- The lower support line has been tested multiple times, increasing the likelihood of a breakdown.
- Buyers are losing control while sellers are beginning to step in.
2. Primary Scenarios for Today
✓ Scenario 1 – Breakdown of the Rising Wedge (High-probability scenario)
If a candle closes decisively below the lower support, the market is likely to:
- Drop quickly toward the next support levels.
- Trigger strong seller participation on the retest of the broken trendline (support → resistance).
- Confirm a high-quality SELL entry.
Downside Targets:
- Target 1: Nearest support zone
- Target 2: Previous low of the wedge
- Target 3: Major support below (depending on your timeframe)
✓ Scenario 2 – Price holds but remains weak
If price bounces from the lower edge but fails to break the upper boundary:
- The structure remains weakly bullish but vulnerable.
- Any upward move is fragile and easy to reverse.
- Not suitable for chasing BUY positions.
- Bulls need a strong breakout above the upper trendline to reverse the bias — which currently has a lower probability.
3. Intraday Trend Bias
Today’s intraday bias remains: DOWN (or at least corrective to the downside).
Confirmation signs:
- Support becomes easier to break the more it is tested.
- Volume is weak on bullish moves.
- Price action is tightening → preparing for a breakout.
- Sellers will wait for a clean retest, as shown in your reference chart.
4. Conclusion
The market is approaching the end-phase of a Rising Wedge, a classic bearish reversal pattern.
Priority today: Wait for breakdown → retest → SELL.
Avoid chasing BUY setups due to high reversal risk.
Expected development:
Break support → Retest → Continue dropping
“Your edge is built from discipline — not every setup must be traded, but every trade must follow your plan.”
Drop your market bias in the comments — do you expect the breakdown or a surprise breakout?
BTCUSD – CHANNEL RESPECT & BULLISH CONTINUATION SCENARIO 📌 BTCUSD – CHANNEL RESPECT & BULLISH CONTINUATION SCENARIO (H1 Analysis)
1. Market Structure – Dow Theory Perspective
On the H1 timeframe:
- BTC has consistently printed Higher Highs (HH) and Higher Lows (HL) inside a well-defined ascending channel.
- The recent corrective move into the ENTRY ZONE aligns perfectly with the channel’s mid-support.
- Buyers have shown early signs of stepping back in, forming a localized HL and rejecting lower prices.
According to Dow Theory:
➡ An uptrend remains intact as long as price continues forming higher lows and doesn’t break key structure support.
➡ BTC is currently maintaining all bullish conditions.
This confirms that the pullback is structural, not a reversal.
2. Channel Confirmation & Price Reaction
The ascending channel remains active and respected:
✔ Price rejected the upper resistance of the channel
✔ A healthy retracement is ongoing
✔ The market is approaching the ENTRY ZONE with decreasing bearish momentum
The reaction behavior is typical of bullish continuation within a trend channel.
There is no sign of market breakdown as long as price stays above the SUPPORT ZONE.
3. Key Zones to Watch
🔹 Support Zone (Entry Zone)
Located at the mid-range of the channel — a high-probability area for buyers to return.
This zone has historically shown strong demand and fits perfectly into the channel geometry.
🔹 Resistance Zone
The upper boundary of the chart and liquidity zone.
This is where previous rejection occurred, and where TP2 & TP3 are aligned.
4. Bullish Scenario – Primary Outlook
BTC is expected to follow a standard:
pullback → bullish rejection → continuation upward structure.
🎯 TP1: Minor channel resistance (short-term reaction zone)
🎯 TP2: Previous strong resistance zone
🎯 TP3: Channel top & extended liquidity zone
As long as BTC holds above the SUPPORT / ENTRY ZONE, upward continuation remains the highest-probability scenario.
5. Alternative Scenario
If BTC breaks below the support zone:
- Price may retest the lower channel boundary
- Market would enter a deeper correction phase
- Trend remains bullish unless the lower channel is broken
This scenario is less likely but still important to consider.
6. Technical Summary
✔ BTC continues respecting the rising channel
✔ Price is forming clean HL patterns
✔ Pullback is controlled — not impulsive
✔ Liquidity targets remain untouched above
✔ Structure supports bullish continuation
Everything aligns with a high-probability bullish continuation setup.
🔥 Conclusion
BTC remains in a well-defined bullish channel, and current price action is moving exactly according to prior projections. As long as price stays above the SUPPORT / ENTRY ZONE, the market strongly favors an upward continuation toward TP1 → TP2 → TP3.
This is a clean, structure-based opportunity for channel traders, trend traders, and momentum traders alike.

XAUUSD – Weekly Scenario: Target Expands to 4,580 RegionXAUUSD – Weekly Scenario: Target Expands to 4,580 Region
Brian – Only prioritize buying if the price remains above 3,996
1. Market Overview – Breaks Triangle, Confirms Uptrend
On the D1 frame, gold has clearly broken out of the accumulation triangle that lasted for weeks.
The sixth candle closed above the descending trendline – which has been the main resistance for a long time – indicating:
Buying power has returned to control the market.
There is a high probability that this is a confirmation of the medium-term uptrend.
Above, the 4,246 region is considered the next “trend confirmation point”:
If the price breaks and holds above 4,246, the path to higher regions, especially 4,360–4,380 and 4,560–4,580, will open according to the Fibonacci expansion roadmap on the chart.
In summary: moving into next week, the current structure supports the bullish scenario, viewing corrections mainly as opportunities to buy.
2. Technical Structure – From Breakout to Fibonacci Levels
The breakout from the triangle occurred after a series of higher lows, bouncing from the lower ascending trendline → leaning towards accumulation, not distribution.
Below the current price are important demand/support regions:
The trendline area around 4,110 – an area to watch for entry plans.
Deeper are the 4,040 and 3,920 regions if a strong correction occurs.
Above, the technical “roadmap” is quite clear:
Point 1: 4,246 – near resistance + retest of the old supply area.
Point 2: 4,360–4,380 – old ATH/peak area, coinciding with the 1.0 Fibonacci region on the chart.
Point 3: 4,560–4,580 – 1.618 Fibonacci region, also the expansion target for the medium-term bullish scenario.
As long as D1 maintains the higher high – higher low pattern and does not break 3,996, the priority remains to view gold in the “buy the dip” frame.
3. Price Zones & Trading Ideas for Next Week
This is not personalized advice, but how Brian is mapping the chart for himself:
Main Scenario – Buy on Trendline/Support
Watch area: around the ascending trendline area of 4,110.
If early in the week there is a correction to this area with a nice candle reaction on H4/D1 (long lower tail, bullish engulfing…), that is the area I prioritize for finding a Buy entry point.
Target roadmap:
Target 1: 4,246 – resistance & trend confirmation area.
If break & retest 4,246 successfully from above, the next bullish wave could expand to 4,360–4,380.
Extended Target: 4,560–4,580 according to 1.618 Fibonacci as shown in the image.
Secondary Scenario – Use Fibonacci Area When Price Exceeds 4,246
When gold exceeds and holds above 4,246, then the 4,360–4,380–4,580 areas will be:
Areas to partially take profit / move SL to protect profits.
At the same time, short pullbacks from this area, if still respecting the uptrend structure, can continue to be opportunities to buy more with the final target of 4,580.
Invalidation Level:
Closing D1 below 3,996 will ruin the current uptrend structure.
At that point, I will stop the medium-term buy strategy, stand aside to observe and wait for a new structure, instead of holding onto the old view.
4. Fundamental Perspective – Why is Gold Still Supported?
On the macro side, gold is being affected by the interplay of:
Tariffs & trade tensions → increasing demand for defense, hedging policy risks.
War and geopolitical conflicts → maintaining gold’s classic “safe haven” role.
End of interest rate cycle: after a long period of interest rates being “pumped” high, the market is increasingly focused on the question “when” rather than “if” they will decrease. This makes non-yielding assets like gold more attractive in the eyes of long-term capital.
Overall, the current fundamental picture is limiting the deep decline of gold: each strong drop often soon sees bottom-fishing buying power, as long as the technical structure is not broken.
5. Strategy & Risk Management
In the coming week, Brian’s bias is quite clear:
→ Prioritize buying on corrections, as long as the price remains above 3,996.
The trendline area around 4,110 is the first place I pay attention to for the buy scenario; if the market is “more generous” and pulls deeper to 4,040–4,000 but still maintains the uptrend structure, that is an even more attractive price for a medium-term position.
Most importantly:
The order volume must be suitable for the account.
Have a plan to move SL/take profit when the price approaches each point 4,246 → 4,360 → 4,580, instead of trying to “hold the peak.”

EURGBP higher bearish from here expecting
OANDA:EURGBP trend based analysis, we are have break of H&S pattern, we are have one time bounce on sup zone, today we having and another bounce, taking this sup zone (0.88050) for valid and from here expecting higher bearish trend.
SUP zone: 0.87950
RES zone: 0.87000, 0.86800

ANFIBO XAUUSD – Holiday Range or Surprise Breakout? [11.27]Hi guys, Anfibo’s here!
XAUUSD Intraday Trading Plan
Overall Picture
On M30, gold is trading inside a tightening rising structure, with price repeatedly bouncing between local support and descending short-term resistance. Liquidity is thin due to the holiday period, so the market is compressing in a narrow range instead of showing a clear trend.
Key things on the chart:
Upper trendline + horizontal resistance around 4170–4175 is acting as a sell zone.
Local supports are stacked around 4143 – 4136, with a major liquidity pocket / demand zone near 4110 labeled “Strong Liquidity”.
Because of low volume and mixed flows, the safest approach is to trade the edges or wait for a clean breakout of this range.
On the macro side, USD is correcting as markets price in a more dovish Fed path, while Thanksgiving liquidity is thin. According to ING, recent USD moves are more about rate expectations than geopolitics, and the low-liquidity environment can also invite occasional volatility spikes, especially in pairs like USD/JPY. All of this supports a choppy, indecisive environment for gold in the short term.
Trading Plan – Fade the Edges, Respect the Range
We’ll work with two tactical setups:
a sell from resistance and a buy from deep liquidity support.
>>> Scenario #1 – SELL from 4173 Resistance Zone
If price drifts back into the upper boundary and reacts bearishly, I’ll look for short setups:
Sell entry: 4173 – 4175
Stop loss: 4180
Take profit levels:
TP1: 4162
TP2: 4150
TP3: 4122
TP4: 4110 (strong liquidity / demand)
Idea: fade the holiday squeeze into resistance, targeting a move back toward mid-range support and eventually the liquidity zone at 4110 if downside extends.
>>> Scenario #2 – BUY from the Strong Liquidity Zone
If price flushes down into the 4110 area and shows strong rejection, I’ll switch to a buy-the-dip plan:
Buy entry: 4110 – 4112
Stop loss: 4104
Take profit levels:
TP1: 4133
TP2: 4150
TP3: 4172
TP4: 4190 (if market breaks above the current range)
Idea: participate in a liquidity grab at the bottom of the structure, aiming for a bounce back into the core of the range and potentially a breakout if volume returns.
Key Intraday Levels to Watch
Resistance / Sell zone: 4167 – 4175
Mid-range supports: 4143 – 4136
Major liquidity support: 4110 – 4112
A clean break and hold outside this band would signal the next directional move; until then, this is a range market.
Risk Management
Holiday liquidity can be tricky – avoid over-leveraging and keep positions smaller than usual.
Wait for clear rejection or confirmation at planned levels; avoid trading in the noisy middle of the range.
Maintain Risk:Reward ≥ 1:2 for both buy and sell setups.
Do not hold both directions simultaneously; follow the scenario that price confirms first.
If price breaks and holds beyond your SL zone (above 4180 or below 4104), close the idea and reassess instead of forcing re-entries.
Conclusion
Gold is stuck in a narrow holiday range, squeezed between resistance near 4175 and liquidity support around 4110. With USD adjusting to softer Fed expectations and volumes thin, the best edge comes from patiently trading the extremes or standing aside until price finally breaks out.
TRADE THE EDGES, RESPECT THE RANGE, AND LET THE MARKET SHOW ITS HAND, GUYS!

XAUUSD – H1 uptrend channel, short-term downside risk increasingXAUUSD – H1 uptrend channel, short-term downside risk increasing Brian – Prioritize short selling at the channel peak, wait to buy back at lower support
I. Strategy Summary Gold is trading in an uptrend channel on H1, but the rise around 4.160 shows signs of weakening, increasing short-term correction risk.
Preferred Scenario: Short sell at the channel peak 4.162–4.164, targeting support areas 4.145 – 4.130 – 4.115 – 4.100.
After the correction, the 4.100–4.080 area may become the foundation for the next rise in the larger trend.
Important price areas to watch: 4.139 – 4.127 – 4.110 – 4.088.
II. Macro Context & News 27/11
02:00 – Fed releases Beige Book This document updates the Fed branches' assessment of the US economic situation.
Describing slower growth, cooling price pressures will further reinforce expectations that the Fed will soon cut interest rates → supporting gold.
Conversely, if the Beige Book describes the economy as still “resilient,” the market may temporarily slow down pricing in rate cuts → causing a short-term adjustment for gold.
19:30 – ECB releases October meeting minutes
If the minutes lean towards the scenario of keeping high interest rates longer, the EUR may be supported, indirectly affecting the USD and gold inflows.
However, the impact is usually not as strong as US data, mainly affecting the overall risk-on/risk-off sentiment.
General Context: Gold has surpassed 4.160 USD/oz as the market increasingly expects the Fed to cut interest rates as early as December, reducing the appeal of interest-bearing assets and increasing the allure of gold – a non-yielding asset. This creates a support foundation for the medium-term uptrend, but after a hot rise, technical adjustments on H1 are normal.
III. Technical Structure – H1 uptrend channel
The price is within the H1 uptrend channel, with rising peaks and troughs, but the upper area near 4.160 coincides with:
The upper boundary of the price channel. The “Sell POC” area on the chart – where liquidity and sell orders are concentrated.
Preferred scenario on the chart: The price may slightly rebound to the POC area 4.162–4.164, then be rejected and slide to the important support area around 4.110 before extending the adjustment down to 4.100–4.080.
The lower trendline of the uptrend channel also acts as a short-term buy area if a clear candle reaction appears.
Notable price areas on H1: Resistance: 4.162–4.164 (channel peak + POC). Intermediate support: 4.139 – 4.127 – 4.110. Deep support: 4.088 – 4.080 – 4.100 (area that may form the bottom for the next rise).
IV. Trading Plan 1. Preferred Scenario – Short sell at the channel peak Idea: Short sell when the price rebounds to the upper boundary of the H1 uptrend channel and POC 4.162–4.164, expecting a correction to support.
Sell: 4.162–4.164 SL: 4.168 TP targets: TP1: 4.145 TP2: 4.130 TP3: 4.115 TP4: 4.100
This is a counter-move order in the uptrend channel, only targeting a short-term correction, not a major trend reversal scenario.
2. Supplementary Scenario – Short buy at support trendline Idea: When the price hits the lower trendline of the H1 uptrend channel and a nice candle reaction appears, consider a short-term buy according to the channel, prioritizing areas:
4.139 – 4.127 – 4.110 – 4.088
Specific Entry/SL levels will depend on the actual price reaction at the trendline, but the general principle:
Buy close to the trendline,
SL placed below the immediate support area,
TP aimed at the middle of the channel or the nearest resistance.
V. Risk Management & Notes
Do not open new positions right before or at the time of the Beige Book and ECB minutes release, as volatility may suddenly increase, widening spreads.
The sell order at 4.162–4.164 is a short-term counter-trend order in the uptrend channel, requiring moderate volume and strict adherence to SL 4.168.
If the price clearly breaks and holds above the 4.170 area, the H1 correction scenario weakens – in that case, stay out, wait for a new structure instead of trying to maintain a sell view.

XAUUSD – H4 Trend Structure Awaiting BreakoutXAUUSD – H4 Trend Structure Awaiting Breakout
Brian – Strategy to Buy on Pullback in Uptrend Channel
I. Strategy Summary
Gold continues its uptrend on H4, supported by the upward trendline from the 3,880–3,900 region.
The price is testing the resistance zone of 4,133–4,150, coinciding with the H4 supply and descending trendline, making short-term corrections likely.
Main strategy: wait for a pullback to support/FVG to buy with the trend, avoid FOMO buying at resistance.
Key levels to note: closing below 4,000 weakens the uptrend structure; below 3,884 risks shifting to a medium-term downtrend.
II. Macro Context
Unemployment Claims (weekly unemployment benefits):
Forecast: 226K
Previous: 220K
Higher-than-expected figures → indicate a weakening labor market, cooling economy, increasing the likelihood of the Fed easing sooner → real yields decrease, supporting gold.
Better-than-expected figures (lower than forecast) → support USD and bond yields, potentially causing short-term pressure on gold.
Geopolitical:
Trump's statement on easing "deadline" pressure for Russia–Ukraine negotiations ("the deadline will be when the issue is resolved") helps the market worry less about a hard deadline, but conflict risks remain. The demand for gold as a safe haven remains stable, not overly inflated but also unlikely to disappear entirely.
III. Fundamental Picture
Expectations for a rate cut cycle in 2025 continue to support gold as the market gradually prices in lower real interest rates in the medium to long term.
The demand for holding defensive assets persists amid slowing global growth and unresolved geopolitical hotspots.
In the short term, USD and US bond yields remain the two leading variables; any USD recovery can pull gold back to technical support areas, creating opportunities for buy-on-dip strategies.
IV. Technical Structure – H4 Trend Channel & FVG Zone
On H4, the price is moving within an uptrend channel, with the support trendline respected multiple times since the end of last month.
Above is the descending trendline connecting the nearest peaks, creating a price compression zone as the market approaches the 4,133–4,150 area. This is a confluence resistance zone:
The nearest swing high.
H4 supply zone.
Intersection with the descending trendline.
Notable price zones:
Resistance: 4,133–4,150 – a zone that may trigger short-term profit-taking and create a correction.
Near support/FVG: 4,078–4,080 – FVG zone combined with support after the previous breakout.
Psychological support: 4,000 – if H4 closes below this area, the uptrend structure weakens.
Medium-term reversal level: 3,884 – closing below here opens the risk of shifting entirely to a medium-term downtrend.
V. Trading Plan
Scenario 1 – Buy with the Trend (Priority)
Idea: wait for a shallow pullback to near support in the H4 uptrend channel and then buy.
Entry: 4,111–4,114
SL: 4,005
TP: 4,133 – 4,150 – 4,172 – 4,190
Scenario 2 – Buy Deep at FVG Zone
Idea: if a stronger pullback to FVG 4,078–4,080 occurs, take advantage of the good price zone to buy.
Entry: 4,078–4,080
SL: 4,073
TP: 4,100 – 4,115 – 4,142
VI. Risk Management & Notes
Limit opening new orders at the time of Unemployment Claims announcement due to potential volatility and spread widening.
If H4 closes below 4,000, reassess all current buy positions.
If H4/Daily closes below 3,884, consider the medium-term uptrend structure broken; prioritize staying out to observe or wait for a new downtrend scenario instead of continuing to look for buying points.

GBP/JPY Technical OutlookMarket Bias:
Bullish bias with demand strength
Key Levels:
• Strong demand zone at lower timeframe support
• Resistance levels to monitor on higher timeframes
Reasoning:
The price shows bullish momentum supported by strong buyer interest and demand zones. Confirmation from lower timeframes will strengthen the case for upward movement. The demand from buyers creates potential for continuation higher.
Trade Idea:
Look for bullish entries upon confirmation on lower timeframes near the demand zones.
Potential Entry:
• After bullish confirmation on lower timeframes (e.g., bullish candle patterns, momentum) near demand zones

Gold trend in the last week of November⚔️1. Trendline
Descending Trendline (upper red line)
Acts as the main dynamic resistance.
Every retest results in rejection → the overall trend remains bearish.
The 4.150 – 4.160 zone is likely where price may retest the trendline before reversing lower.
Ascending Trendline (lower red line)
Previously the nearest dynamic support but has now been broken.
The downside breakout signals weakening momentum, favoring SELL setups.
⚔️2. Resistance Zones
Resistance 1: 4.148 – 4.150 (Fibo 0.5 – 0.618)
Confluence of Fibonacci retracement and the descending trendline.
High probability that price will retest this area and reject strongly.
Resistance 2: 4.245 – 4.250
The strongest resistance zone (Fibo 1.0).
Only reachable if a strong bullish pullback occurs.
⚔️3. Support Zones
Support 1: 3.995 – 4.000 & 4.028 – 4.030
Confluence of static support + psychological level.
A technical bounce may appear here.
Support 2: 3.890 – 3.900
The strongest support zone.
Main downside target if the price gets rejected from the upper resistance.
⚔️4. Price Scenarios
⭐️Primary Scenario (Bearish)
Price pulls back to 4.148 – 4.152, retests the descending trendline → rejection → moves down toward:
TP1: 3.995
TP2: 3.890
⭐️Alternative Scenario (Bullish)
Valid only if:
Price breaks above the descending trendline
Closes above 4.160
→ Next target: 4.250
TRADING RECOMMENDATIONS
BUY GOLD: 3890 – 3888
SL: 3878
TP: 100 – 300 – 500 pips
SELL GOLD: 4250 – 4248
SL: 4260
TP: 100 – 300 – 500 pips

LiamTrading – XAUUSD H4 | Gold accumulates on the trendlineLiamTrading – XAUUSD H4 | Gold accumulates on the trendline, waiting to break the structure for a breakout
After testing the upward trendline twice, gold bounced up and then moved sideways around the 4065 area. On H4, this price zone has accumulated for almost a week – indicating that the selling force is not liquid enough to push the price down deeply, while there is still plenty of price gap above according to Fibonacci. My preferred scenario: gold continues to "compress" within the triangle, then breaks out to create a new wave.
Macro – Fed context
Fed member Collins emphasized that there is still reason to be cautious about cutting rates in the December meeting. She stated:
This is a complex phase, and it's not unusual for internal disagreements within the Fed.
The Fed must balance between the two goals of employment and inflation, which are moving in opposite directions.
This makes it difficult for the market to clearly price the interest rate scenario, so gold continues to choose to accumulate around important technical zones instead of breaking out in one direction.
Technical Analysis – Trendline, Fibonacci, Volume Profile
The current H4 structure is a triangle model with:
A downward sloping trendline from the old peak 42xx.
An upward sloping trendline from the late October low, acting as dynamic support.
Zone 4060–4070: the "balance" price zone last week – where the price moved sideways the longest, serving as a reference point for the short-term trend.
Key levels: 4132: near resistance, coinciding with the VAH area of the current Volume Profile.
4171: higher resistance, near the Fibonacci 1.0 area of the recovery wave.
4242: Fibonacci extension confluence zone (1.618) + historical resistance – where strong profit-taking is likely.
4347: 2.618 expansion zone – reference target if the peak is successfully broken.
4022 and 3997: important support close to the lower trendline – main buy zone if there is a liquidity sweep.
When the price decisively breaks out of one of the trendlines, the new trend on H4 will be clearer; the trading plan will follow this breakout direction.
Risk management and invalidation
H4 closes below 3997: the triangle structure is broken downward, fully prioritizing sell orders to lower zones – at that point, medium-term buy orders should not be held.
H4 closes above 4245 with good volume: considered a successful triangle peak breakout, discard all sell orders in this area and focus on buying according to the new trend.
Which scenario are you leaning towards for next week: breaking up to test 4242–4347 or sweeping down to 4022–3997 before bouncing back? Leave a comment and follow the LiamTrading channel on TradingView for daily XAUUSD updates.

Gold Bearish Continuation Analysis
📉 Gold Market Analysis (45-min Chart)
Your chart shows a full transition from bullish trend → distribution → bearish trend.
Below is the step-by-step breakdown:
1️⃣ Previous Trend: Strong Uptrend
Price was moving inside a rising channel, creating:
Higher highs
Higher lows
Fair Value Gap (FVG) inside the channel
Breakout points showing bullish continuation
This structure remained intact until BOS (Break of Structure).
2️⃣ Break of Structure (BOS) → Trend Reversal
Price broke out of the ascending channel and then broke below structural support → confirming a bearish reversal.
This BOS is the key signal showing buyers losing control.
3️⃣ Current Phase: Range Consolidation
After BOS, price entered a range between:
Upper range: ~4,100
Lower range: ~4,020
This type of consolidation usually appears before another strong move.
Because BOS is bearish, the expected continuation is downward.
4️⃣ Liquidity Objective: 4,012 Target
Your chart marks TARGET 4012, and it aligns with:
Liquidity grab zone
Previous reaction area
Lower range boundary
Beginning of the order block
This makes 4,012 a high-probability bearish target.
5️⃣ Order Block Confirmation
Below the chart, there is a large order block zone (3,927–3,947).
If 4,012 is broken with momentum, price may later gravitate toward this deeper zone.
But for now, the nearest confirmed target is:
👉 4,012
6️⃣ Expected Movement (Short-term)
Price is currently retesting the breakdown area (small pullback).
From here, the expected path is:
Pullback → Rejection → Drop toward 4,012
(Bearish continuation)
---
📉 Summary
Trend shifted from bullish to bearish after BOS.
Price is inside a bearish range.
Momentum favors a continuation downward.
Short-term target: 4,012
Major support/order block below: 3,927–3,947
If you want this analysis in another language or want me to write a full signal, let me know!

Mastering RSI: A Complete Guide to Momentum🔵 Mastering RSI: A Complete Guide to Momentum, Regimes, Reversals & Professional Signals
Difficulty: 🐳🐳🐳🐳🐋 (Advanced)
This article goes far beyond the basic idea of “RSI = overbought/oversold.” If you want to truly master RSI as a momentum gauge, trend filter, reversal tool, and structure confirmation model, this guide is for you.
🔵 WHY MOST TRADERS MISUSE RSI
Most traders use RSI in the simplest way:
RSI above 70 = sell
RSI below 30 = buy
This leads to shorting strong trends and catching falling knives.
RSI is not a reversal button. RSI is a momentum translator.
To master RSI, you must understand:
Trend regimes
Momentum pressure
Acceleration and deceleration
Failure swings
Divergences
Trend vs range behavior
Multi-timeframe alignment
Structure confirmation
RSI shows the strength behind price, not just extremes.
🔵 1. RSI TREND REGIMES (CORE FOUNDATION)
RSI moves in predictable zones depending on the type of market environment.
Bullish RSI Regime
RSI holds between 40 and 80
Pullbacks bottom around 40–50
Breaks above 60 show trend acceleration
Bearish RSI Regime
RSI holds between 20 and 60
Pullback tops form around 50–60
Breaks below 40 confirm bearish dominance
These regimes tell you who controls the market before you even look at candles.
🔵 2. MOMENTUM PRESSURE (RSI AS A SPEEDOMETER)
RSI measures the speed and pressure of price movement.
Rising RSI with rising price = trend acceleration
Falling RSI with rising price = momentum weakening
Rising RSI with falling price = early strength
Falling RSI with falling price = continuation pressure
This is not divergence. It is momentum pressure, the earliest sign of trend shift.
🔵 3. FAILURE SWINGS (THE MOST RELIABLE RSI REVERSAL SIGNAL)
Failure swings are powerful because they show internal momentum breaking before price reacts.
Bullish Failure Swing
RSI makes a low
RSI rallies
RSI dips again but stays above previous low
RSI breaks the previous high
Bearish Failure Swing
RSI makes a high
RSI pulls back
RSI rallies but fails to break the previous high
RSI breaks the previous low
Failure swings often appear at trend tops and bottoms before candles reveal anything.
🔵 4. DIVERGENCES (REGULAR AND HIDDEN)
Regular Divergence: Reversal Clue
Bullish: price lower low, RSI higher low
Bearish: price higher high, RSI lower high
Hidden Divergence: Trend Continuation
Bullish hidden: price higher low, RSI lower low
Bearish hidden: price lower high, RSI higher high
Hidden divergence is more powerful than regular because it confirms trend continuation.
🔵 5. RANGE RSI VS TREND RSI
RSI behaves very differently in ranges versus trends.
Range Environment
RSI oscillates between 30 and 70
Reversals at extremes have high accuracy
RSI 50 is the equilibrium
Trend Environment
RSI stays above 50 in bullish trends
RSI stays below 50 in bearish trends
30 and 70 extremes lose meaning
Always identify environment first. RSI signals change depending on regime.
🔵 6. RSI AS A STRUCTURE FILTER
RSI combined with structure improves trade selection dramatically.
Price makes higher highs + RSI rising = healthy trend
Price makes higher highs + RSI flat = weak breakout
Price makes higher highs + RSI dropping = exhaustion
Support retest + RSI 40–50 = strong continuation potential
Most false breakouts are avoided simply by checking RSI pressure.
🔵 7. MULTI-TIMEFRAME RSI ALIGNMENT
Use higher timeframe RSI to validate lower timeframe setups.
HTF RSI bullish + LTF RSI pullback = high-quality entry
HTF RSI bearish + LTF RSI bounce = premium short area
HTF RSI crossing 50 = long-term regime shift
This is one of the most powerful RSI confluences.
🔵 EXAMPLE TRADING FRAMEWORK
Bullish Setup Checklist
RSI in bullish regime (above 50)
Pullback into 40–50 zone
Hidden bullish divergence or failure swing
Structure forms a higher low
Bearish Setup Checklist
RSI in bearish regime
Rejection from 50–60 zone
Hidden bearish divergence or failure swing
Structure forms a lower high
🔵 COMMON RSI MISTAKES
Trading RSI extremes without trend context
Ignoring RSI regimes
Entering on regular divergences in strong trends
Not using RSI midline (50) as a regime filter
Relying only on overbought/oversold signals
🔵 CONCLUSION
RSI is one of the most powerful indicators when used correctly. It provides a complete framework for:
Reading trend strength
Tracking momentum pressure
Identifying early reversals
Trading continuation setups
Filtering breakout strength
Aligning multi-timeframe bias
Master RSI, and you gain a clearer view of momentum than most traders ever experience.
How do you use RSI? Do you prefer divergences, trend zones, or failure swings? Share your approach below!

QuyetP | Careful Selling JPY Pairs — EURJPY Is Going ATH!Selling /JPY pairs right now just looks wrong.
Momentum is one-way, and OANDA:EURJPY shows it clearly.
Pullbacks get bought almost instantly.
Higher lows keep building — clean, steady pressure.
Intermarket checks line up the same direction:
-Global yields stay elevated → JPY remains weak.
-Risk sentiment stable → yen demand stays low.
-BOJ still hesitant → market keeps pressing the upside.
No drama. No noise. Just a pair that wants higher ground.
QuyetP’s view :
Bias is strongly bullish.
I’m avoiding any sell idea on JPY pairs until this structure breaks — and right now, it’s not even close.
Careful out there — fading this move is a tough bet.

GBPJPY higher bullish expectations
OANDA:GBPJPY trend based analysis, currently price in ASCENDING TRIANGL, from here expecting higher bullish continuation.
SUP zone: 202.500
RES zone: 204.500, 205.000

CADCHF strong bullish expectations
OANDA:CADCHF looks beautiful and more after todays BOC.
Price in CHANNEL, moving strong bullish today, we are have and break of BULLISH FLAG pattern, currently here strong bullish i am.
SUP zone: 0.56800
RES zone: 0.58200, 0.58600

AUDCHF for new week still bullish for expect
OANDA:AUDCHF trend based analysis, we have strong bullish push from last week, currently price on good sup zone, from which expecting bullish continuation.
RBA next day.
SUP zone: 0.52450
RES zone: 0.53400, 0.53700

NAS100 8H - real correction or just another dramatic rehearsal?NAS100 held the 24850–25000 demand zone with precision, forming a classic false break followed by a sharp recovery back into the rising channel. Volume expansion on the reversal, strong lower wicks, and sustained support at the dynamic trendline all signal that the medium-term bullish structure remains intact. The path toward 26300 inside the channel stays open, and a breakout above this level unlocks the next target at 27300 - the upper boundary of the current impulse.
The NAS100 index represents the core of the US tech sector, reflecting demand for IT, cloud infrastructure, AI technologies, communication platforms, and high-growth digital companies.
Fundamentally , the backdrop on November 15 strengthens the bullish case: the market continues to price in a softer Fed stance, bond yields are easing, major tech companies are raising guidance, and demand for AI-driven solutions remains stable. With inflation trending into a manageable range and expectations for improved credit conditions rising, liquidity is rotating into high-beta assets, providing structural support and limiting corrective depth. Strong margins, solid earnings and resilient tech demand continue to anchor the broader uptrend.
As long as price holds above 24850–25000, the bullish scenario remains active. A confirmed breakout above 26300 opens the way toward 27300. Any controlled pullback into 24850–25000 remains a buy zone within the prevailing trend.
NASDAQ likes to overact, but more often than not it’s simply warming up before the next performance.

SYRUPUSDT 4H – On-Trend Long in Institutional Credit RWA 1. Setup
BINANCE:SYRUPUSDT is the token of Maple Finance – an institutional on-chain credit / RWA platform with syrupUSDC/USDT products and a clear fee → buyback model.
Spot trades around 0.44–0.45 with 24h volume in the $45–58M range and a market cap near $510M. Drawdown from the June ATH at 0.6532 is only ~31%, so this is not a “dead rebound” but a mid-trend pullback.
My 4H On Trend Long strategy has triggered a fresh long after a higher low around the 4H EMA band, with all intraday timeframes (15m–3D) in “Above trend” state while only 1W remains below.
2. Technical context (4H)
Price has been oscillating around the 4H EMA ribbon, respecting it as dynamic support. The last dip into ~0.43–0.44 was bought up, leaving a higher low at the blue support block. From here I’m following the system and joining the existing uptrend instead of trying to catch an extreme deviation.
Trade levels on the current setup:
Entry zone ≈ 0.449
Invalidaton ≈ 0.428 (break below local demand / 4H EMA stack)
Main target ≈ 0.533–0.537 (prior local high and resistance cluster)
That’s roughly +18.6% upside vs −4.8% downside, R:R ≈ 3.9.
3. Strategy statistics – 4H On Trend Long (SYRUP)
Backtest sample: 65 trades, long only.
Winrate ~41.5% – many small scratches and failed trends.
Average PnL per trade +1.70%.
Average winner +5.6%, average loser −2.1% → win/loss size ratio ≈ 2.45.
Largest winner +22.1%, largest loser −7.3%.
Trades are relatively short-lived: ~5 bars in total on average, ~8 bars in winners.
So the edge is classic trend-following: lower hit-rate, but winners tend to pay for several losers. This current setup fits the profile – risk is kept close to the historical average loss, while the target lies in the upper zone of past winners.
4. Fundamentals & flows
TVL and AUM keep expanding: Maple has >$5B AUM in Q3, +66% QoQ, with institutional inflows above $500M recently.
Revenue momentum is strong: about $4M in Q3 (+41.5% QoQ), with an October revenue ATH around $2.16M.
The protocol directs 25% of protocol revenue into SYRUP buybacks, creating a direct link between credit growth and token demand.
Recent news highlighted integrations with Aave and other DeFi venues, plus a Q4 ecosystem call focused on 2026 plans – all keeping the RWA/credit narrative warm.
On derivatives, OI sits near $25M, with futures volume roughly 1.5–3x spot. This leverage mix can amplify moves in both directions, so invalidation needs to be respected.
Scorecard from my dashboard:
Sentiment +9, Momentum neutral, Liquidity high, Risk medium, Confidence ~80%.
5. Trade plan & invalidation
The idea is simple: follow the existing 4H uptrend with a system long, using the EMA ribbon as a dynamic line in the sand.
If price closes 4H below 0.428 and fails to quickly reclaim the EMA band, I treat the trend leg as broken and exit. If the move plays out, I’ll look to realise most profits around 0.53–0.54, where earlier sellers were active, and only keep a small runner in case the fundamental momentum drives a new ATH push.
Not financial advice – just a structured on-trend long setup in one of the stronger RWA / credit names.

What will gold do in the US trading session?📈 Market Structure
Price Action:
Price has just broken out of the accumulation zone, moving sharply toward the main resistance area.
📊 Trendlines
Lower Trendline (Red): Long-term dynamic support — price has bounced multiple times from this level.
Upper Trendline (Red): Main descending resistance — price is now approaching this zone.
🧱 Support Zones
3,970,000: Confluence of horizontal support and the lower trendline → key reaction area to monitor.
4,030 – 4,050 (Breakout Zone): Intermediate support if price pulls back after the breakout rally.
⚔️ Resistance Zones
4,100 – 4,115: Strong resistance aligning with the upper trendline and previous highs → possible correction zone.
🎯 Scenario
If price gets rejected around 4,115, it could pull back toward the 4,030 – 4,050 breakout zone, or even retest 3,970,000.
A clean breakout above 4,115 would confirm stronger bullish continuation.
🧭 Summary
Trend: Short-term bullish — currently testing major resistance.
Strategy: Watch price action near 4,115; wait for confirmation to re-enter buys around 4,030 – 3,970.
💼 Trading Plan
BUY GOLD: 4,030 – 4,028
Stop Loss: 4,018
Take Profit: 100 – 300 – 500 pips
SELL GOLD: 4,115 – 4,117
Stop Loss: 4,127
Take Profit: 100 – 300 – 500 pips

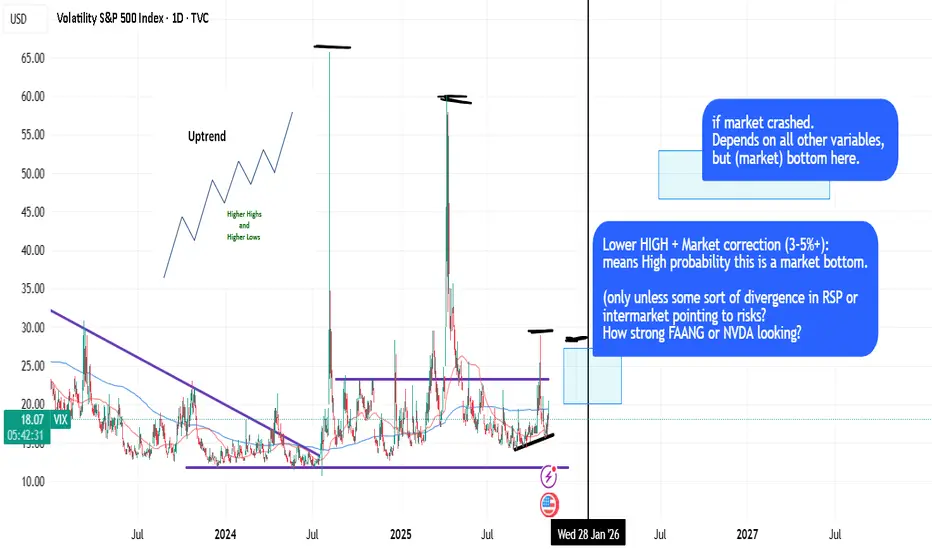
Using HLOW/LHIGH (Dow) + LOGIC to pinpoint probabilities.DOW Theory is the king of the stock market (Higher Lows, Lower Highs, uptrending, etc.) and it's quite basic concept to apply with logic.
Sometimes you can time the market (based on 50dma/200dma crosses, price extensions) and LHIGH dynamics and logic -> to pinpoint probabilities. Like, look at VIX dynamics during 2023/2024.
in short: DOW + LOGIC = PROBABILITY.