PENDLEUSDT → Retest of the 5.0 liquidity zone before rising to 7BINANCE:PENDLEUSDT is still consolidating, but is preparing to enter a correction phase, which could be triggered by a breakdown the 5.23 support level. Correction is a vital stage for further growth.
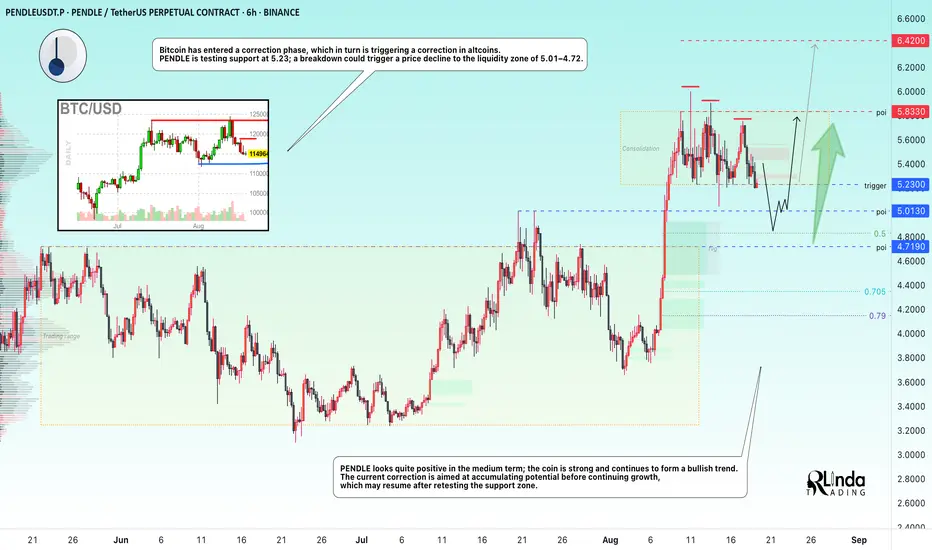
Bitcoin has entered a correction phase, which in turn is triggering a correction in altcoins. PENDLE is testing support at 5.23, and a break of this support level, which is already being tested for the sixth time, could trigger a price decline to the liquidity zone of 5.01 - 4.72
PENDLE looks quite positive in the medium term, the coin is strong and continues to form a bullish trend. The current correction is aimed at accumulating potential before continuing growth, which may resume after retesting the support zone.
Resistance levels: 5.833, 6.42
Support levels: 5.23, 5.013, 4.719
On the weekly chart, PENDLE is consolidating above the strong support level of 5.013. As part of the correction, the market may confirm this support and continue its growth towards the ATH from the mirror level.
Best regards, R. Linda!
Triangle
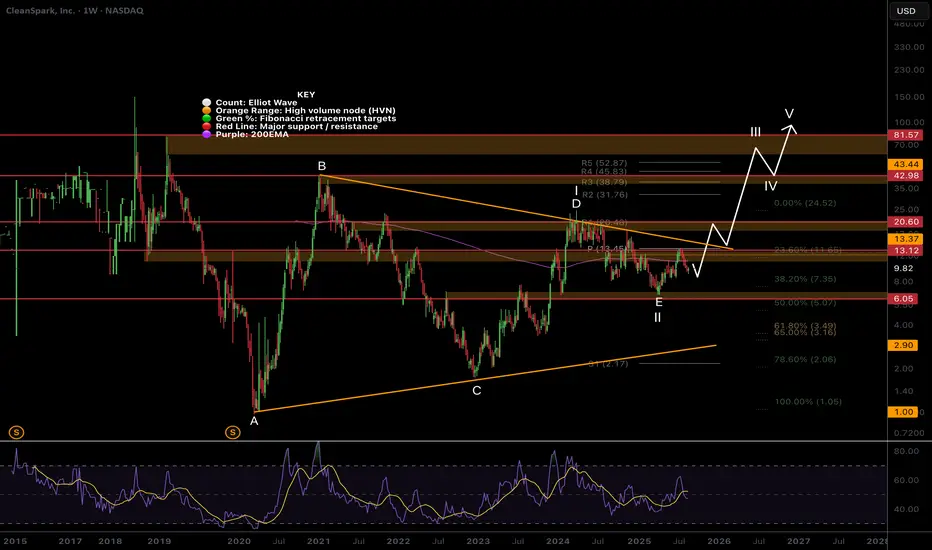
$CLSK Looks like XRP at $0.4 before the move to $3NASDAQ:CLSK is hated right now as much as XRP was when it ranged between $0.4-$0.8 for 4 years before it when ballistic.
CRYPTOCAP:XRP printed a huge macro triangle similar to what I have identified here for CLSK which looks complete at the triangle EQ, where wave E is expected to terminate! This finds confluence with the High Volume Node and 0.5 Fibonacci retracement.
Quadruple resistance lies ahead of the weekly 200EMA, major High Volume Node, weekly pivot point and descending resistance boundary, tested multiple times weakening the point. This built up pressure could provide an explosive move to price discovery.
I have left my alternative motif wave count on their as a secondary count (1-2) with similar targets.
RSI is at the channel EQ so plenty of upside left.
Analysis is invalidated below $6.05.
Safe trading
GBPNZD 22 Aug 2025Reasons for entering the trade:
1. Curve support (4H)
2. Triangle breakout (15M)
3. Bottom of the hypothetical channel (1H)
Entry: 2.31027
TP: 2.31654
SL: 2.30612

XAUUSD Long Thesis: Triangle Support Bounce to Target 3380Hello, traders! The recent history of the XAUUSD price auction has been defined by the establishment of two major pivot points, which have set the boundaries for the current market structure. A significant pivot point low was formed near the 3300 demand zone, which initiated a rally that was subsequently capped by a pivot point high at the 3390 supply zone. This sequence has transitioned the market from a directional phase into a period of balance and consolidation.
Currently, XAU is consolidating within a large symmetrical triangle, a pattern signifying equilibrium and contracting volatility. The price is being methodically squeezed between a descending supply line and an ascending demand line, indicating that energy is building for a significant move. The market is now in a corrective pullback, heading towards the ascending demand line for what is expected to be a critical test of buyers' resolve in this structure.
The working hypothesis is a long scenario based on a successful defense of the triangle's lower boundary. It is anticipated that the price will complete its corrective dip and test the ascending demand line, which originates from the 3315 demand zone. A confirmed bounce from this dynamic line would validate the pattern's integrity and trigger an upward rotation. The take-profit is therefore set at 3380. Manage your risk!

BTCUSD Long Thesis: Awaiting Reversal for a Target of 118000Hello, traders! The market structure for BTCUSD was redefined by a reversal from the prior descending channel. A bullish initiative from the pivot point low near 112000 shifted the balance of power, with the subsequent impulse creating a new high at the 122500 supply zone. This action set the boundaries for the current consolidation phase.
Currently, BTC is consolidating within a large symmetrical triangle, a pattern of contracting volatility. The price auction is being squeezed between the descending supply line and the ascending demand line. The market is now at a critical juncture, testing the integrity of the horizontal demand zone around 113000, the primary area of control for buyers.
The working hypothesis is a long scenario based on a potential liquidity grab. It is anticipated that the price may briefly dip into the 113000 - 112000 demand zone before a sharp bullish reversal. A swift reclaim of the 113000 level would be the key confirmation. Such a reversal is expected to initiate a full rotation towards the upper boundary, with the take-profit set at 118500, a logical target representing a significant area of prior price interaction. Manage your risk!

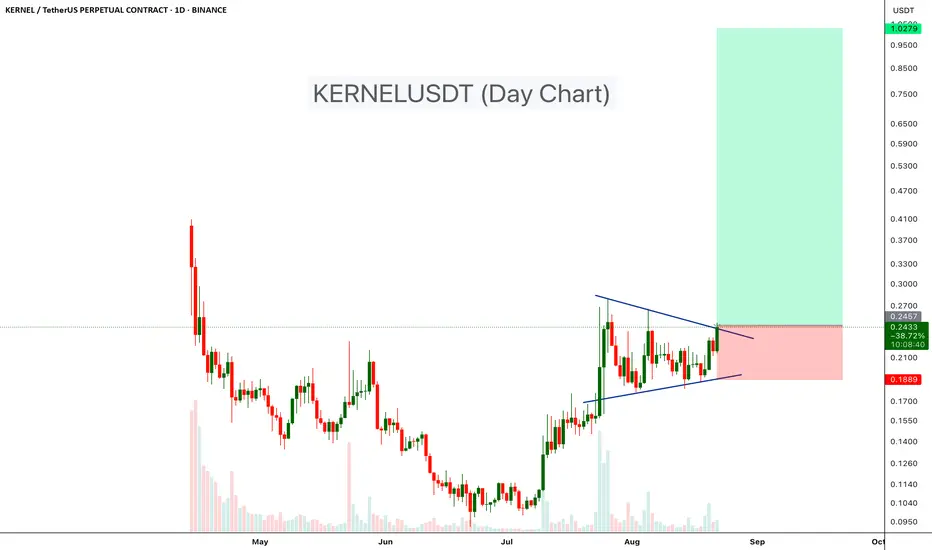
KERNELUSDT – Symmetrical Triangle Breakout!KERNELUSDT has been consolidating within a symmetrical triangle pattern on the daily chart, showing a battle between buyers and sellers after a strong uptrend. Recently, price has started breaking above the upper trendline, which could indicate the beginning of a fresh bullish move.
Pattern: Symmetrical Triangle
Entry Zone: Around current breakout levels (~0.24–0.25 USDT)
Target Zone: $0.5 - $1.00
Stop-Loss: Below 0.19 USDT (recent support)
Cheers
Hexa
Bitcoin will bounce from buyer zone and start to growHello traders, I want share with you my opinion about Bitcoin. The broader market context for Bitcoin has been one of prolonged and volatile consolidation, with price action largely contained between two dominant control zones: a major seller zone capping rallies near 120000 and a foundational buyer zone providing strong support around 112000. After the most recent rejection from the upper boundary, the asset has undergone a significant downward correction, which has taken the shape of a smaller descending triangle. Currently, the price has reached a critical inflection point, as it is testing the apex of this triangle directly at the major horizontal support level of 112000. The primary working hypothesis is a long scenario, which anticipates that the strong historical demand within the buyer zone will absorb the recent selling pressure and initiate a powerful rebound. This rebound is expected to be strong enough to cause a breakout from the descending triangle, signaling a shift in short-term momentum. The scenario further anticipates a brief retest of the broken triangle's resistance line from above to confirm it as new support. Following a successful retest, the path would be clear for a continued rally. Therefore, the tp for this move is logically placed at the 117000 level. Please share this idea with your friends and click Boost 🚀
Disclaimer: As part of ThinkMarkets’ Influencer Program, I am sponsored to share and publish their charts in my analysis.

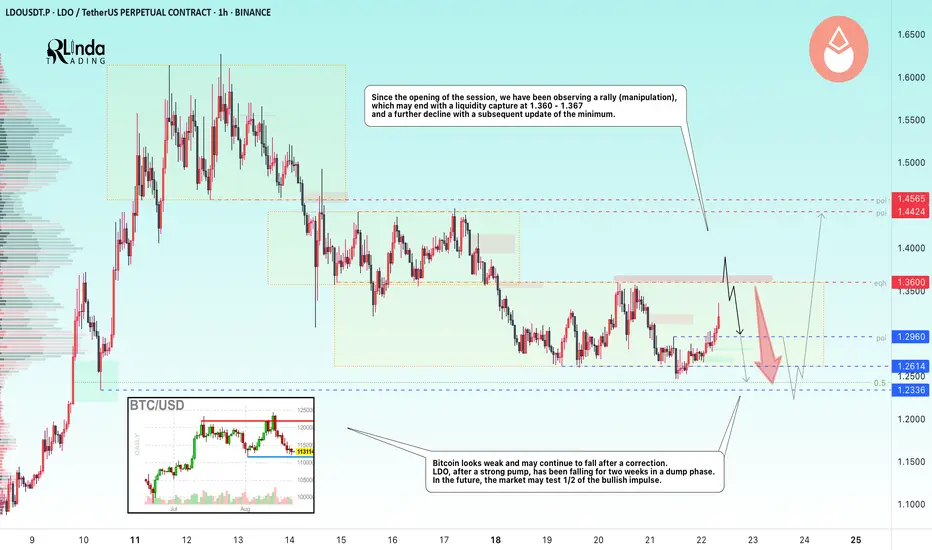
LDOUSDT → Hunting for liquidity ahead of a declineBINANCE:LDOUSDT.P , having failed to reach the zone of interest 1.250 - 1.233, has entered a phase of local rally or manipulation before a possible decline aimed at consolidating potential before long-term growth.
Bitcoin looks weak and, after a correction, may continue to fall to the coveted target of 112 - 110K. After a strong pump, LDO has been falling for two weeks in a dump phase. In the long term, the market may test 1/2 of the bullish momentum and the strong support level of 1.179 before resuming the pump to 1.62 - 1.97.
Since the opening of the session, we have been observing manipulation, the goal of which is most likely the liquidity zone of 1.36 - 1.36. The situation may end with a liquidity grab, a false breakout, and a further decline with a subsequent update of the low.
Resistance levels: 1.36, 1.37, 1.44
Support levels: 1.296, 1.2614, 1.2336
Technically, the price is still consolidating and intrarange trading is likely to continue. A false breakout of resistance could trigger a decline, in which case 1.26 - 1.23 could be considered a target, while a false break of 1.17 - 1.23 could trigger a global rise.
Best regards, R. Linda!
EURNZD: Key Resistance Holds 🇪🇺🇳🇿
It looks like a key resistance that EURNZD reached keeps holding.
I even see some bearish clues on an hourly time frame,
such as a confirmed breakout of a support line of a triangle pattern.
I think that we may see a retracement lower.
Goal - 1.99
❤️Please, support my work with like, thank you!❤️
I am part of Trade Nation's Influencer program and receive a monthly fee for using their TradingView charts in my analysis.

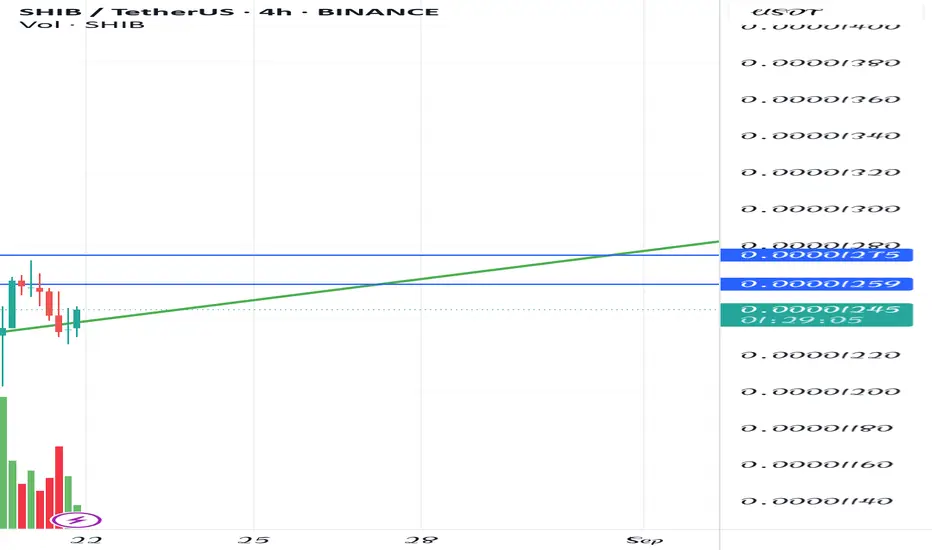
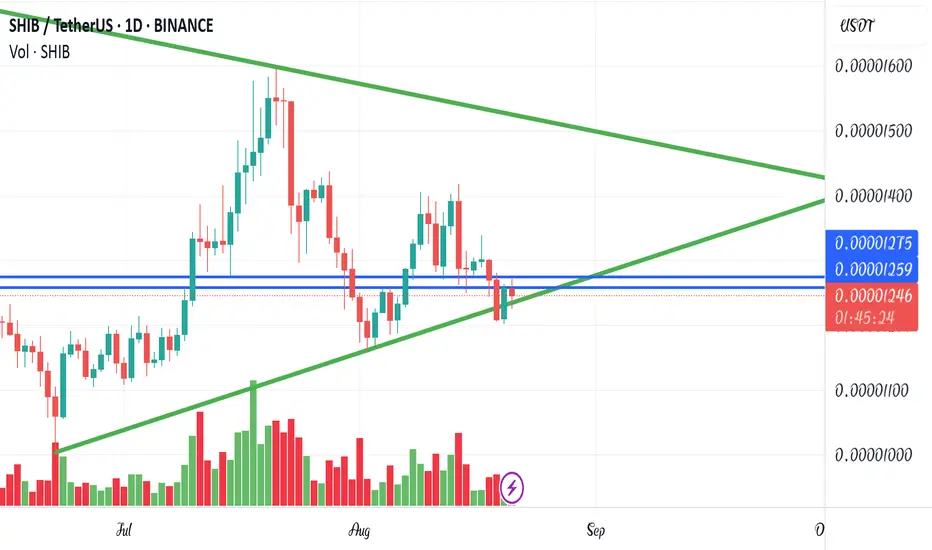
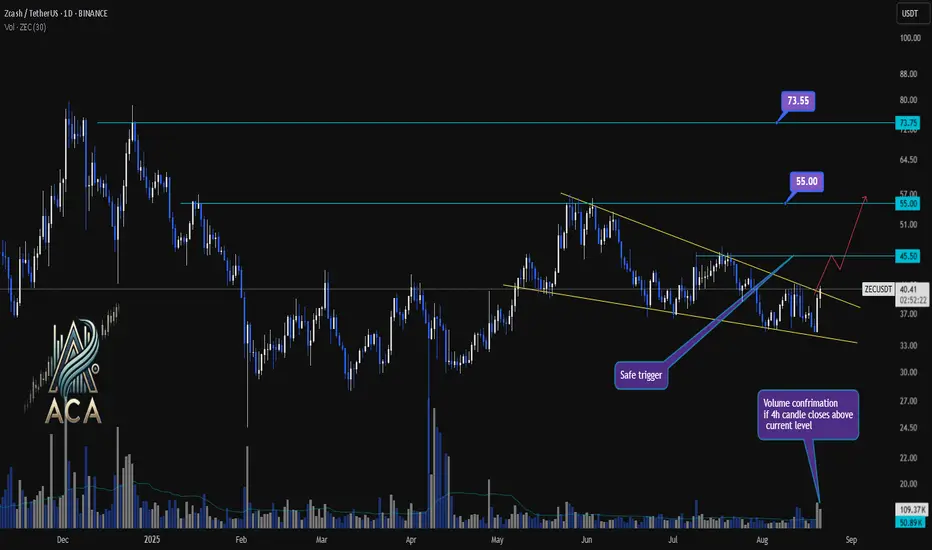
ZECUSDT Daily Chart Analysis | Symmetrical Triangle BO WatchZECUSDT Daily Chart Analysis | Symmetrical Triangle Breakout Watch
🔍 Let’s dissect the ZEC/USDT daily chart, where price action is nearing a pivotal breakout from a symmetrical triangle—often a precursor to major moves when combined with rising volume.
⏳ Daily Chart Overview
Zcash has been consolidating over recent weeks, forming a clear symmetrical triangle pattern bounded by converging trendlines. This pattern, characterized by lower highs and higher lows, signals that volatility is being compressed and a decisive breakout may be imminent.
🔺 Long Setup:
A daily close above the $45.50 resistance, especially with strong volume, will act as a “safe trigger” and confirm breakout validity. If bulls take charge here, the next upside objectives are $55.00 followed by $73.55. Watch for volume confirmation, ideally on a 4H candle close above resistance, to further add confidence to the breakout.
📊 Key Highlights:
- Symmetrical triangle pattern shows growing pressure for a directional move.
- Recent price tested triangle resistance; a close above $45.50 is the bullish trigger.
- Upside targets post-breakout are $55.00 and $73.55, provided volume supports the move.
- Volume spike serves as crucial confirmation—don’t chase without it.
🚨 Conclusion:
ZEC is coiling within a symmetrical triangle, setting the stage for potential breakout action. Bulls are watching $45.50 for a clean breakout trigger, eyeing $55 and $73.55 as next targets. Always wait for strong volume and confirmed closes before acting—symmetrical triangles can break both ways if conviction is lacking.
GOLD → Breakthrough of downward resistance, news ahead...FX:XAUUSD is recovering after a fairly prolonged decline, and there are signs of bullish sentiment on the chart, but caution is advised as important news is ahead...
Gold is in a holding pattern. Its short-term fate depends on today's US economic data and, to a greater extent, on tomorrow's speech by Powell, which will set the tone for the future. The price is recovering slightly after a recent decline, but is trading cautiously.
The market is awaiting the release of S&P Global's business activity indices (PMI), which will assess the strength of the US economy and influence Fed rate forecasts. Another key event of the week is the Fed chair's speech in Jackson Hole on Friday. His comments on future interest rates will determine the further movement of gold and the dollar.
Technically, we are seeing a rebound from the support of a global symmetrical triangle, with bulls still in the market but waiting for further signals. Locally, we are seeing positive dynamics — a breakout of downward resistance and consolidation in the buying zone...
Resistance levels: 3350, 3370
Support levels: 3331, 3315
The conditions for further growth should be a positive fundamental background and the bulls holding the price above key support. A retest of the trading range boundary (0.5f) is possible before growth.
Best regards, R. Linda!

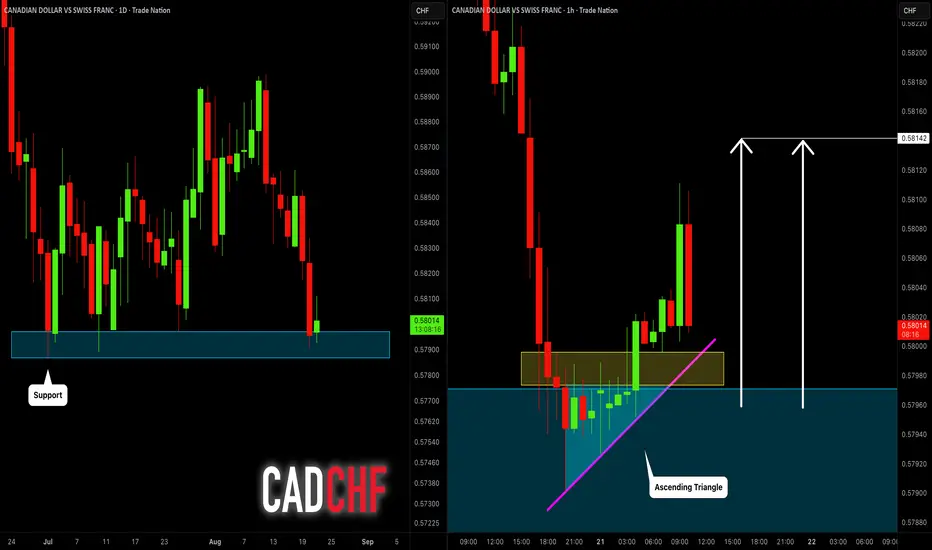
CADCHF: Pullback Will Continue 🇨🇦🇨🇭
There is a high chance that CADCHF will go up from the underlined
support cluster.
The price formed an ascending triangle pattern on that on an hourly time frame
during the Asian session.
Goal - 0.5814
❤️Please, support my work with like, thank you!❤️
I am part of Trade Nation's Influencer program and receive a monthly fee for using their TradingView charts in my analysis.
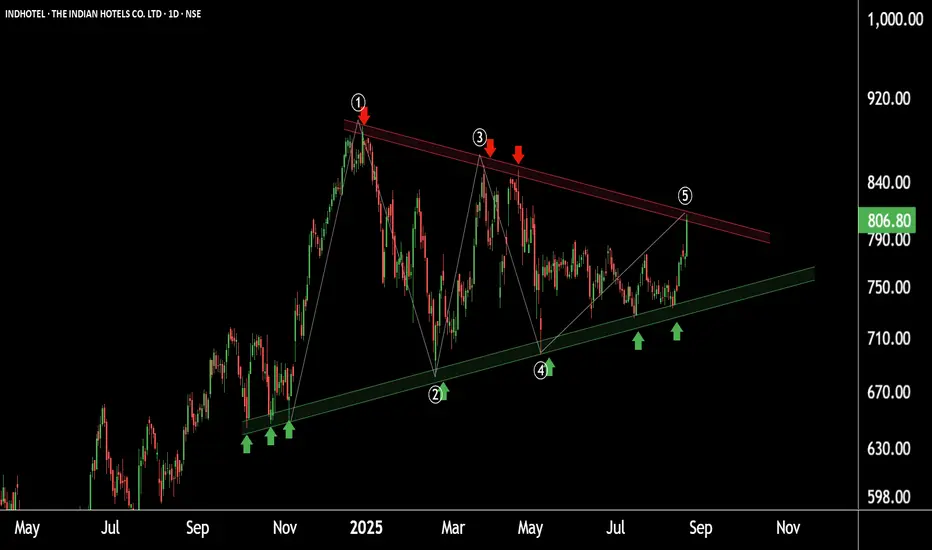
Indian Hotels: Pattern Discovery Signals Potential RallyIndian Hotels is currently forming a Symmetrical Triangle Pattern with:
Support: near ₹730
Resistance Zone: ₹800–810
As the wave structure is now complete, a breakout from this pattern is highly possible.
📈 If the breakout occurs, we may witness new highs in the stock.
THANK YOU !!
HSSEB - ASCENDING TRIANGLE BREAKOUT !HSSEB - CURRENT PRICE : RM0.710
HSSEB is bullish because :
The stock is above 50-day EMA.
The share price is above ICHIMOKU CLOUD
CHIKOU SPAN is above CANDLESTICK
RSI is above 50
Today (20 August 2025) the stock broke out ASCENDING TRIANGLE pattern with high trading volume - indicating strong bullish momentum. The stock may trend higher in near term.
ENTRY PRICE : RM0.700 - RM0.710
TARGET : RM0.780 and RM0.845
SUPPORT : 50-day EMA (CUTLOSS if price close below 50-day EMA)

TSLA (Tesla) LONG SET UPEntry Price 1: $324.00
Entry Price 2: $314.00
Stop Loss: $294.00
Take Profit 1: $340.00 (Close 25%)
Take Profit 2: $354.00 (Close 50%)
Take Profit 3: $368.00 (Close 75%)
Take Profit 4: $384.00 (Close 100%)

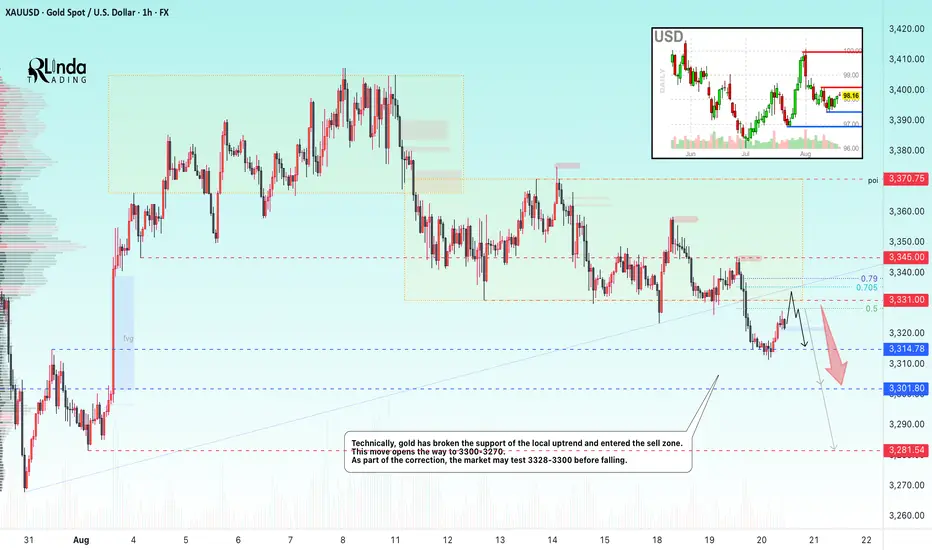
GOLD → Correction and retest of a previously broken level...FX:XAUUSD breaks through the support of the local consolidation “symmetrical triangle” and falls to a minimum of 3311...
Gold remained at a three-week low of around $3,300 in Asian trading on Wednesday as markets awaited the Fed minutes and Powell's speech in Jackson Hole. The dollar is strengthening on expectations that the Fed chair will reject the idea of aggressive rate cuts despite weak labor market and inflation data. The probability of a rate cut in September is estimated at 85%. Strong housing market data and news about negotiations on Ukraine provided additional support to the dollar. Powell's comments on Friday remain the key factor for gold, while current movements are mainly technical in nature.
Resistance levels: 3328, 3331, 3345
Support levels: 3314, 3300, 3328
Technically, a correction is forming after a bearish rally. As part of the correction, the price may test the zone of interest, which is represented by local resistance levels. Distribution could bring the price to 3300-3270.
Best regards, R. Linda!
Pacific Edge PEB BreakoutAnother post noting a breakout on PEB,
Likely to start moving higher, just need a small catalyst to trigger...

GOLD → The market is waiting for a kick (driver). ConsolidationFX:XAUUSD is in a stalemate. A “casino” pattern is forming in the form of a symmetrical triangle. The odds are 50/50, and everything depends on the fundamental background and the emergence of a driver.
Gold is stuck in a symmetrical triangle - consolidation.
Gold is trading around $3330 on Tuesday, remaining in a range with a downward bias amid caution among traders ahead of the Fed minutes.
Technically, it is possible to trade the breakout from consolidation with the price consolidating above a certain level, i.e., post-factum.
Optimism after the meeting between Trump and Zelensky, who promised to end the conflict, is reducing demand for safe assets, but expectations of a Fed rate cut this year are supporting the metal. An additional factor is the confirmation of the US rating by S&P. Powell's speech on Friday will be a key driver, while the dollar has partially recovered after its recent decline.
Resistance levels: 3349.8, 3370.7
Support levels: 3331, 3315, 3301
Volatility has been very low over the past few days, with the market waiting for someone to kick-start movement. Fundamental factors are contradictory, and technically, gold looks uncertainly weak. Based on this, I expect that a retest of the nearest resistance could end with a downward breakdown from consolidation.
Sincerely, R. Linda!

EURCAD → Countertrend correction before growthFX:EURCAD is forming a correction to the support zone against the backdrop of temporary stagnation of the euro, which is the previous extreme from July 1...
EURCAD is forming a countertrend correction within the global bullish trend. The euro is gradually rising amid the fall of the dollar. The Canadian dollar is consolidating below strong medium-term resistance and may continue its decline, which will only support the bullish trend in EURCAD
Technically, the price is entering a liquidity zone, with a point of interest at 1.61 - 1.609, locally at 1.61225, where the upward support line also passes...
Support levels: 1.6122, 1.6100
Resistance levels: 1.618, 1.625
The main focus is on the specified support zones. If, after a false breakdown of the point of interest, the bulls are able to keep the price above the support zone, then in this case we can expect a possible continuation of the trend. Otherwise, the local trend may be broken and the market will go into a deep correction...
Best regards, R. Linda!

Ascending Triangle busted- Bajaj finance 📉 Bajaj Finance Breakdown Alert 🚨
Ascending Triangle busted!
Bearish RSI Divergence + Trendline Break = Trouble brewing.
High volume node - ₹920 could cap any retest.
Next support zone?
👀 ₹840–₹800 range looks like the battleground!

A British Japanese Triangle (GBP/JPY)Setup
Price broke out of a triangle pattern but after a successful test of prior highs at 200 psychological resistance, dropped back to the broken upper trendline of the triangle only to rebound back to the big 200 level.
Signal
The price snapped below its rising trendline on the daily chart as well as a price pivot at 196 - and RSI fell below support from the 50-level before rebounding sharply to form a new multi-week high. A daily close over 200 should confirm the uptrend has resumed.
