BTCUSDT: Failed Recovery Opens Path to 87,000 SupportHello everyone, here is my breakdown of the current BTCUSDT setup.
Market Analysis
BTCUSDT is trading inside a broader ascending channel, but the recent price action shows clear signs of weakness near the upper structure. Price previously attempted a breakout above the 90,000 Resistance Zone, however this move turned into a fake breakout, confirming strong seller pressure in that area. After the rejection, the market shifted into a corrective phase and formed a descending triangle structure, defined by the Triangle Support Line and repeated failures near resistance.
Currently, price is consolidating just below the 90,000 resistance, while gradually sliding along the descending support of the triangle. The 87,000 Support Zone remains the key downside buffer where buyers previously stepped in. The overall structure now suggests that bullish momentum is weakening, and sellers are gaining short-term control as long as price remains below the 90,000 resistance level.
My Scenario & Strategy
My scenario is bearish, as long as BTCUSDT stays below the 90,000 Resistance Zone and continues to respect the descending triangle structure. I expect price to attempt another breakdown toward the 87,000 Support Zone, which aligns with the lower channel support and previously active demand area. A clean break below 87,000 would confirm bearish continuation and open the path toward deeper downside targets.
However, if price once again reclaims the 90,000 resistance with strong volume and holding strength, the bearish scenario would be invalidated and a renewed push toward the upper channel could follow. For now, the market supports a short bias, with the main focus on a potential move toward the 87,000 support area.
That’s the setup I’m tracking. Thank you for your attention, and always manage your risk.
Triangle

ADAUSDT → Correction (hunt for liquidity) before the fall BINANCE:ADAUSDT is pausing in the 0.41 area and entering a correction phase, during which it may test the zone of interest in a bearish market.
Bitcoin failed to overcome resistance at 92K, with economic data intensifying bearish pressure, resulting in another decline. The market is stagnant within the trading range, and any correction could quickly turn into a sharp decline...
ADA is forming a halt in the 0.41 zone and is entering a phase of local correction. The zone of interest is 0.426 - 0.434 (the area of local trend support breakdown). A retest of resistance may end in a false breakout...
Resistance levels: 0.421, 0.426, 0.434
Support levels: 0.409, 0.392
A false breakout of the resistance zone or a retest of the previously broken support of the uptrend may end in pressure from the bears. The correction may be followed by a continuation of the downtrend and the zone of 0.421 - 0.434
Best regards, R. Linda!

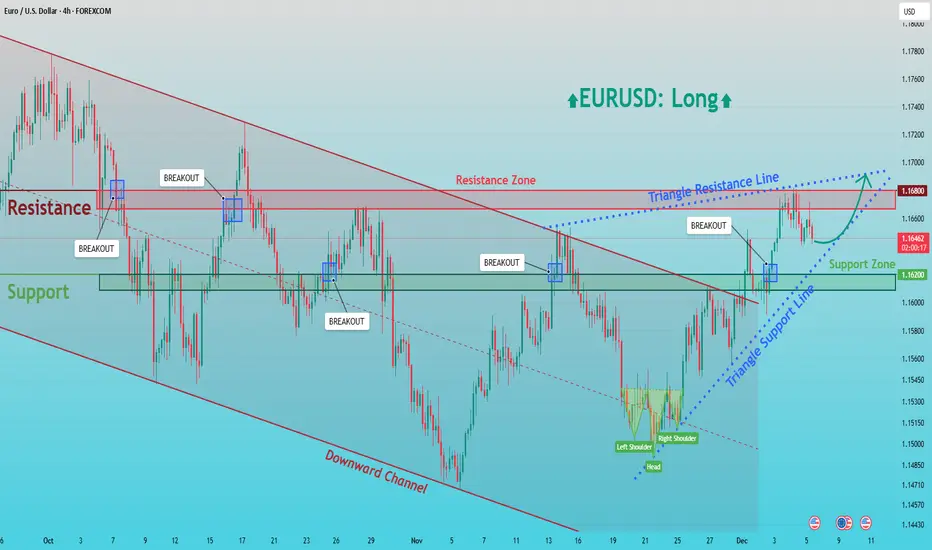
EURUSD: Buyers Push Toward the 1.1680 Triangle Resistance BreakHello everyone, here is my breakdown of the current EURUSD setup.
Market Analysis
EURUSD is transitioning out of a prolonged bearish phase that previously unfolded inside a well-defined downward channel. After forming a major swing low in early November, the pair initiated a recovery and gradually shifted into a corrective bullish structure. Price is now trading inside a developing triangle formation, defined by the ascending Triangle Support Line and the descending Triangle Resistance Line. During the decline, the market repeatedly respected the key Support Zone around 1.16200, which acted as a strong demand area and triggered bullish reactions on multiple occasions. Most recently, EURUSD completed a clear Head and Shoulders reversal pattern near the lower boundary, signaling exhaustion of sellers and the start of buyer control. Following this structure, price broke above the support zone and is now consolidating above it, confirming the zone as a valid demand base.
Currently, the pair is approaching the major Resistance Zone at 1.16800, which also aligns with the descending triangle resistance. This area remains the key upside barrier for buyers and represents a critical decision point for the market.
My Scenario & Strategy
My scenario is bullish, as long as price remains above the 1.16200 Support Zone and continues respecting the ascending Triangle Support Line. I expect EURUSD to maintain upward pressure and attempt a breakout toward the 1.16800 resistance, which is the next major supply area. A clean breakout above this zone would confirm bullish continuation and open the way for further upside toward higher targets.
However, if price reaches the resistance and shows strong rejection, a corrective pullback back toward the 1.16200 demand may occur. Still, the overall bullish structure remains valid as long as the support zone holds. For now, market conditions favor a long bias with focus on a breakout attempt toward the 1.16800 resistance zone.
That's the setup I'm tracking. Thank you for your attention, and always manage your risk.
XAUUSD Long: The 4,160 Support Holds – Path to 4,260 is OpenHello, traders! The price action for XAUUSD is currently developing within a well-defined ascending trend structure, supported by a rising major Trend Line from the lows. The market previously showed multiple rejections from the Triangle Supply Line, each marked by clear breakout attempts followed by corrective pullbacks. These reactions formed a sequence of higher lows, confirming that buyers remain in control of the broader structure.
Currently, after the last strong impulsive move upward, Gold reacted from the Supply Zone around 4,260, forming a short-term corrective phase while respecting the rising Triangle Demand Line near the 4,160 demand level. Price is now compressing between the descending supply line and the ascending demand line, creating a tightening triangle structure that signals growing pressure for a directional expansion. This compression reflects a balance between profit-taking sellers at resistance and aggressive dip-buyers along demand.
My scenario for the further development is bullish continuation as long as price holds above the Triangle Demand Line and the 4,160 demand zone. I expect a rebound from current levels, followed by a renewed attack on the 4,260 Supply Zone. If buyers manage to produce a clean breakout above this resistance, Gold may accelerate toward higher targets with strong momentum continuation. However, if the supply zone holds and price breaks below the demand line, a deeper corrective pullback toward the main rising Trend Line could develop. For now, the structure favors buyers, with the key focus on a breakout attempt toward 4,260. Manage your risk!

$LTC: The Best Positioned AltcoinTo all those who doubted XRP's breakout in November 2024, history is repeating and LTC will be the beneficiary.

EURUSD Uptrend Structure Intact — Path Toward 1.1700 ResistanceHello traders! I want to share my view on the current EURUSD setup. After a corrective decline, the pair formed a solid local bottom around the Support Level near 1.16200–1.16400, where buyers stepped in and stopped the downward momentum. As shown on the chart, price is now trading inside a clear ascending structure, supported by the rising Support Line and guided by a parallel Resistance Line, forming a well-defined upward channel. Inside this structure, the Buyer Zone has played a key role, serving as the base for multiple impulsive breakouts in the past. Several breakdown attempts turned into fake breakouts, confirming that buyers continue to defend this area and maintain short-term trend control. After these rebounds, EURUSD pushed into the upper part of the channel, reaching the Resistance Line and forming a local rejection that caused a pullback back toward the Buyer Zone. Currently, price is hovering near the ascending support line, and as long as EURUSD stays above the 1.16400 support area, the bullish scenario remains intact. If buyers successfully defend this zone and maintain structure inside the rising channel, I expect the market to move toward TP1 → 1.17000, which aligns with the major Resistance Level highlighted on the chart. A clean breakout above this level would open the way for further continuation, potentially driving the pair deeper into the higher resistance zone. However, if the price breaks below the Buyer Zone and violates the ascending Support Line, the bullish scenario becomes invalid, and the pair may revisit lower support levels around the 1.16000 area. For now, the structure remains moderately bullish as long as demand holds and EURUSD continues respecting the rising channel. Please share this idea with your friends and click Boost 🚀

GOLD → Retest of upward trend support. Focus on 4200FX:XAUUSD is trading near $4,200, remaining cautious at the start of the week ahead of the Fed's decision. The trend is bullish, with the dollar stagnating. A long squeeze of support could trigger a rebound...
The Fed is expected to cut rates by 25 bps (probability ≈90%). Weak US data supports dovish expectations
Attention is shifting to the Fed meeting and its forecasts for 2026. The lack of important US data today shifts the focus to geopolitics and general market sentiment.
There is not much news this week, but from a geopolitical point of view, attention is focused on Japan-China and Russia-Ukraine-US relations.
Gold is awaiting signals from the Fed. The decision on rates and geopolitical news will determine the direction of the breakout from the current range.
Resistance levels: 4220, 4256
Support levels: 4200, 4195, 4180
The dollar previously broke through the support of the uptrend, but has been stagnating for the past few days. A break below 99.0 could trigger a decline in the index, which could support the price of gold.
Gold is testing the support of the trading range within the uptrend. Focus on the 4200-4195 zone. A long squeeze could trigger growth amid a weak dollar...
Best regards, R. Linda!

USDJPY → Attempt to return to the bullish trend from correctionFX:USDJPY may exit the correction phase and continue its upward movement within the trend. The global target has not yet been reached.
The dollar is consolidating after breaking the bullish trend structure. The market is trying to keep the price above 99.0. Growth and a retest of 99.5 are possible. This move may support the growth of the currency pair.
The correction may end. The main trend is bullish, and the market continues to follow the trend lines despite the weak dollar.
A breakout of the correction boundary and maintaining the price above 155.4 may trigger a distribution of 157.8.
Resistance levels: 155.4, 157.15
Support levels: 154.45
Local and global trends are bullish. The correction may end as the price continues to storm the resistance of the local bearish pattern. A breakout of 155.4 and consolidation above this zone may support further growth.
Best regards, R. Linda!

BTCUSDT Long: Demand Line Holds — Path Toward 96,500 Opens UpHello, traders! BTCUSDT is respecting the Triangle Demand Line after completing a full bearish cycle inside the descending channel earlier. Sellers maintained control for an extended period, pushing price steadily lower until it reached the pivot point near 88,800, where buyers finally stepped in and broke the bearish structure. This pivot zone became the foundation for a new bullish sequence, with price forming higher lows along the Triangle Demand Line. After the breakout from the descending channel, BTCUSDT entered a consolidation Range, where multiple fake breakouts occurred on both sides. This range acted as a transition phase before buyers regained momentum. Following the range, price made another bullish attempt, but faced resistance near the 96,500 Supply Zone — an area where sellers have shown strong activity in the past.
Currently, BTCUSDT is moving toward the Triangle Demand Line once again, retesting it as support. As long as buyers defend this trendline and price remains above the Demand Zone at 88,800, the bullish structure stays intact.
My scenario: if the trendline holds, BTCUSDT may bounce and continue moving toward the 96,500 resistance, which remains the main upside target for the current bullish leg. A clean breakout above 96,500 would open the path for stronger continuation. However, if price fails to hold the demand line, a corrective pullback toward the lower demand region becomes possible. For now, the market structure remains bullish while price respects the Triangle Demand Line. Manage your risk!

XAUUSD: Triangle Breakdown Setup Points Toward $4,160 SupportHello everyone, here is my breakdown of the current Gold setup.
Market Analysis
Gold has recently moved out of a strong upward channel, where price previously showed consistent bullish momentum supported by higher lows and clean breakouts. After breaking out of the first channel, XAUUSD formed a consolidation range, signaling temporary equilibrium between buyers and sellers. This range acted as a base for the next impulsive bullish leg, which drove price back into a new upward channel. However, after the strong rally, gold formed a fake breakout near the $4,240 resistance area, which coincides with the upper boundary of the triangle resistance line. This false breakout indicated weakening bullish pressure and exhaustion near the top of the structure. Once price failed to hold above the resistance, it rotated downward and began forming a tightening triangle pattern between the descending resistance line and the rising support line.
Currently, XAUUSD is trading inside this triangle structure, with price gradually compressing. The $4,160 support level remains a key reference point, as it previously acted as a major demand zone during the last correction and is now aligned with the triangle’s lower boundary.
My Scenario & Strategy
My scenario is bearish as long as gold stays below the triangle resistance line and continues to respect the lower highs forming within the pattern. If price maintains this structure and fails to reclaim $4,240, I expect a downward move toward the $4,160 support zone.
Therefore, a clean breakdown below the triangle support line would confirm bearish continuation and could open the door for a deeper correction. On the other hand, if price rejects the support and breaks above the triangle resistance, the bearish setup becomes invalid, and buyers may attempt another retest of the $4,240 level. For now, the structure favors a short bias with the main objective being a move toward the $4,160 support level, which remains the next significant target for sellers.
That's the setup I'm tracking. Thank you for your attention, and always manage your risk.

Gold is in a uptrend.Overall Gold trend is to the upside.
But this month is of holidays so it will move slowly. But we have to catch some pips. Right ?

XAUUSD: Buying Pressure Aims for the $4,260 ResistanceHello everyone, here is my breakdown of the current Gold (XAUUSD) setup.
Market Analysis
Gold continues to trade within a broader bullish structure, with price action developing inside a well-defined ascending channel. After the previous impulse move higher, the market entered a consolidation phase below the $4,260 Resistance Zone, where sellers repeatedly defended the level. Earlier, XAUUSD produced a breakout from the upward channel structure and formed a temporary base above the mid-support area near $4,200, confirming that buyers still control the broader trend.
Currently, price is holding above the Triangle Support Line, showing that demand remains active on dips. The recent pullback into the $4,200–$4,190 support area looks corrective rather than impulsive, suggesting that bearish pressure remains limited for now. As long as price stays above this triangle support, the bullish market structure remains valid.
My Scenario & Strategy
My scenario is bullish while XAUUSD holds above the $4,200 Support Zone and respects the Triangle Support Line. I expect price to stabilize in this area and attempt a renewed push toward the $4,260 Resistance Zone, which is the key barrier for continuation.
Therefore, a clean breakout above $4,260 would confirm bullish continuation and open the door for further upside expansion toward higher historical levels. However, if price fails to hold the triangle support and breaks below $4,190–$4,180, this would weaken the bullish structure and could trigger a deeper corrective pullback toward the lower channel boundary. For now, the market maintains a long bias, with the main objective being a renewed test and potential breakout of the $4,260 resistance zone.
That’s the setup I’m tracking. Thank you for your attention, and always manage your risk.

Gold (XAU/USD) – Breakdown & Two Clear ScenariosGold recently moved inside a defined price range between 4260–4160, even forming a bullish triangle pattern, suggesting indecision with a slight bias upward. During today’s session, price has broken below the Previous Day Low (PDL), which now acts as short-term resistance.
From here, we can play two likely scenarios:
📈 Bullish Scenario
If gold reclaims and breaks above the PDL, we may see price retrace toward the Previous Day High (PDH).
Upside potential lies near ~4240, with buyers regaining control.
📉 Bearish Scenario
If the PDL remains as strong resistance and price rejects it, a throwback could lead gold to test liquidity near the 4100 zone.
This area also coincides with the midline of the bullish channel, making it a key support zone for potential buys.
🌐 Fundamental Context
According to Reuters, recent weeks have seen a weakening USD and high market expectations of a Fed rate cut in December, which supports gold as a non-yielding asset.
However, stronger-than-expected U.S. employment data and rising Treasury yields have created periodic pullbacks, showing short-term pressure.
Safe-haven demand remains a factor due to ongoing geopolitical tensions and global economic uncertainty, further boosting gold’s medium-term bullish story.
OANDA:XAUUSD

i will not trade gold unless there will be a break out
Current Price: $4,209.01
Open Price: $4,198.69
High Price: $4,210.59
Low Price: $4,198.51
Gold price will rally!
on my analysis, gold price is on corrective subwave and purging. it could be move up till hit my sell zone for corrective wave 3

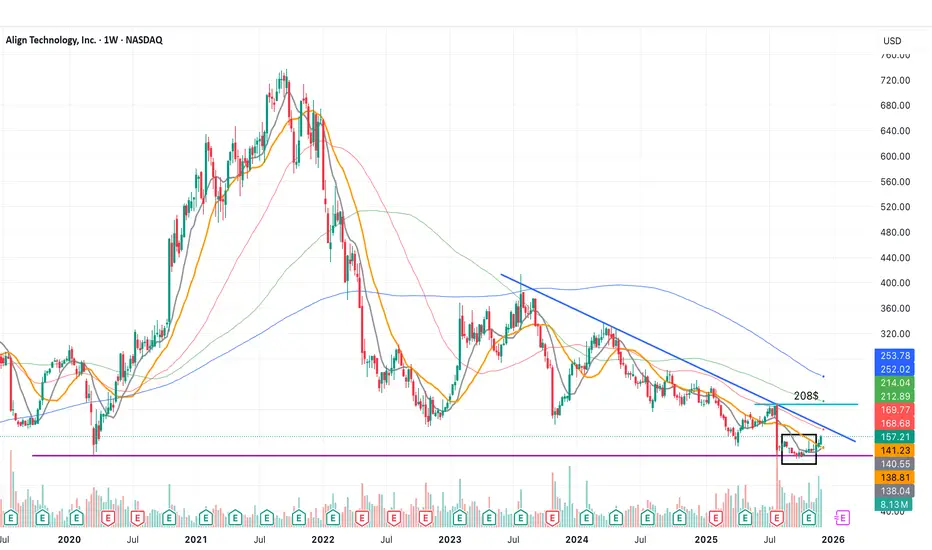
Compression The price is accelerating after sales forecasts for Q4 were raised.
Clear compression with a retest of the previous low, the price is now heading toward the blue resistance around $170, and in case of a breakout, could continue toward $208.
The medical sector has been largely overlooked in recent years in favor of AI stocks, but a renewed interest in 2026 is very likely.
THE BULL RUN IS OVERIf the bears don’t take it by force from 90k, then they would after sweeping buyside liquidity around 97k to 98k.
Patience is Payment.

GOLD → Consolidation above 4220. Bullish structureFX:XAUUSD is trading in a narrow range around $4,200, maintaining sideways momentum ahead of US inflation data. The market confirms a bullish structure...
The probability of a Fed rate cut in December remains at ≈90%.
Mixed US employment data:
– Jobless claims fell to their lowest level since September 2022.
– Layoffs in November reached a two-year high.
The key benchmark today is the PCE index for September (data delayed due to the government shutdown).
Gold is awaiting new signals on inflation. Range trading is likely until the release of PCE data, which may set the direction of movement ahead of the Fed's decision.
Resistance levels: 4238, 4262
Support levels: 4220, 4183
If the bulls hold their ground above local support at 4220, we will have a chance to break through 4238 and retest 4262. However, a breakout of the trading range resistance could trigger a continuation of the rally towards the ATH.
Best regards, R. Linda!

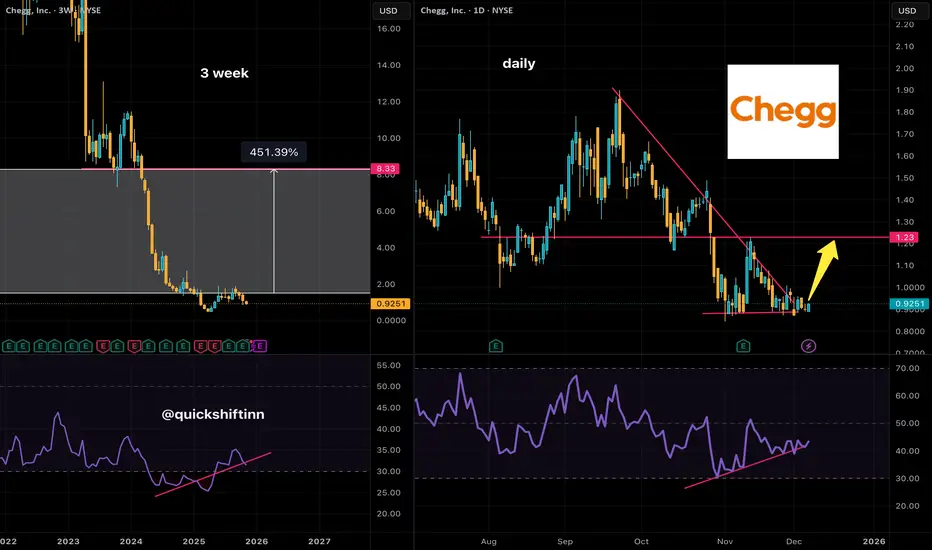
$CHGG high risk / high reward opportunityNYSE:CHGG has been working to carve a bottom for many months now. With a restructuring of the business to
earn cash from legacy business
use cash to fund new growth business
cut costs
Management is taking an active hand to steer the company towards profitability.
Shares are cheap. They were $1.50 as recently as October just months ago, and now trade below $1. Lower time frames indicate a bullish divergence may be building.
Longer time frames illustrate an opportunity to earn multiples on your investment.
I've been building a position with 1/15 2027 call options. This way there is time to let the turnaround story develop (or not lol), and my financial commitment isn't large.
The stock price has been volatile, so I've been buying during big dip days. Breakout or breakdown is imminent. Make a decision!
EURUSD Long: The 1.16200 Support Holds – Path to 1.17000 is OpenHello, traders! The price action for EURUSD is unfolding inside a corrective structure after a prolonged bearish phase that was guided by the descending Triangle Supply Line. The market previously formed a consolidation Range on the left side of the chart before breaking down and continuing lower. Price respected both the descending supply line and the ascending Triangle Demand Line, creating a compression phase that ultimately resulted in a bearish breakout to the downside. After forming a pivot low, EURUSD initiated a strong bullish recovery, breaking back above the former structure and confirming a shift in short-term momentum. The market then formed a clear Head and Shoulders reversal pattern near the Triangle Demand Line, reinforcing buyers’ strength. Following this, price successfully broke through the key Demand Zone around 1.16200, confirming the transition from corrective to bullish conditions.
Currently, EURUSD is retesting this demand area after the breakout, showing signs of support holding. As long as price remains above the 1.16200 demand zone, the bullish scenario remains valid. The next upside objective is the 1.16650–1.17000 Supply Zone, where sellers previously showed strong activity.
My scenario is a clean continuation toward Supply 2 at 1.17000 becomes likely if buyers maintain control. However, a rejection from this supply region could trigger a corrective pullback back toward demand before any further upside continuation. Manage your risk!

Gold is about to break to the upside.Gold was sideways for a while. So we could not find any trade. But it is about to break now.
Get ready...

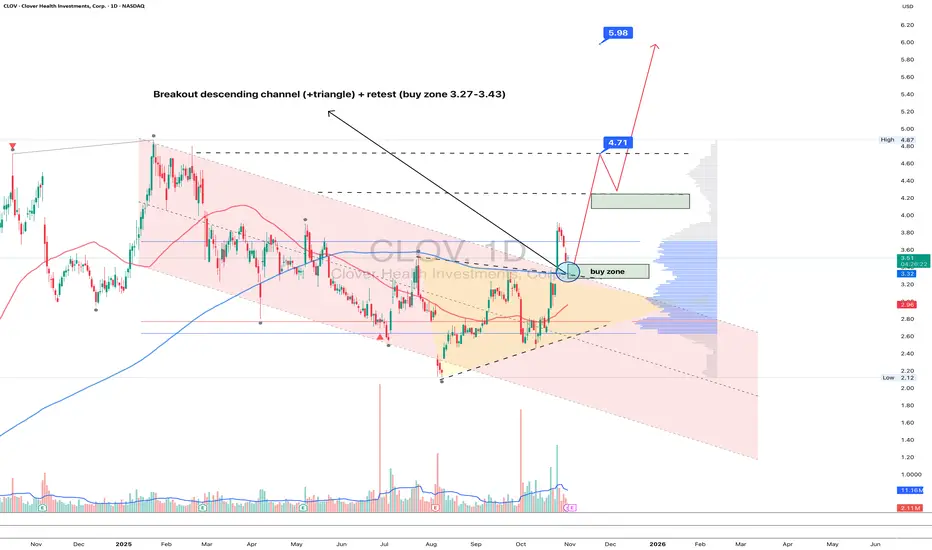
CLOV 1D - Health Is Back in TrendOn the daily chart, Clover Health (CLOV) has broken out of its descending channel and triangle, now pulling back for a retest near 3.27–3.43 - a key buy zone aligned with the MA50. Buyers are clearly regaining control, and the setup looks ready for continuation.
Technically:
– first clean breakout of the downtrend since January 2025;
– volume expansion on bullish candles, suggesting institutional accumulation;
– holding above the former resistance turned support.
Upside targets: $4.71 (local volume peak) and $5.98, offering +70% potential upside if momentum sustains.
From a fundamental perspective, Clover Health is stabilizing its business:
– a leading player in Medicare Advantage, with an expanding senior member base;
– Q3 results show 40% reduction in net loss and +18% YoY revenue growth;
– leveraging AI-driven healthcare analytics to improve efficiency and patient outcomes;
– with high short interest, a confirmed breakout above $4.70 could ignite a short squeeze.
Tactical plan: accumulation near 3.27–3.43, add above 4.70, targets 4.71 → 5.98. Sometimes the healthiest trend is the bullish one.
XAUUSD: Waiting for a Price ExplosionThe current XAUUSD structure still maintains a bullish bias as long as the main demand zone around 4174–4163 remains intact. The compression pattern in the form of a symmetrical triangle on the H1 timeframe indicates an accumulation phase, where market participants are holding the price before the next impulsive move. The previous high at 4264 remains a liquidity magnet, and once that level gets swept, the upside momentum could open wide toward the major supply zone at 4360–4381.
However, this bullish scenario depends on the price's ability to stay above the demand. If a rejection occurs and price fails to defend 4174, the short-term structure may shift into distribution. A valid break below that level could drag the price deeper into the next liquidity pool around 4142–4115, and possibly retest a stronger demand zone beneath it at 4074–4050 before the market decides its next direction.
With that in mind, the market’s focus is now on two key control points: 4264 on the upside as the bullish continuation trigger, and 4174 on the downside as the gate to a deeper correction. As long as the structure holds, the bullish outlook remains dominant, and a breakout above 4264 could drive XAUUSD into the untouched weekly supply peak. On the other hand, failing to sustain the demand zone would open more downside room to sweep remaining liquidity before continuing the long-term trend

GOLD → Retest of consolidation support on uptrend FX:XAUUSD is trading in a sideways range around $4,200, awaiting new labor market data to determine the Fed's policy trajectory after December's rate cut.
Weak US data (a 32K decline in ADP employment and a slight increase in ISM services to 52.6) did not change market expectations. The probability of a 25 bp Fed rate cut on December 11 is around 90%. Attention has shifted to the trajectory of policy easing in early 2026. Key factors will be data on unemployment claims and sentiment on Wall Street.
The fundamental background is relatively positive, and the dollar has entered a correction phase due to expectations of lower rates, which may support the gold price...
Resistance levels: 4238, 4262
Support levels: 4185, 4175
Gold is testing the support levels of the key trading range. If the bulls keep the price above 4185 and form a bullish reversal pattern, then in the short and medium term, we can expect growth to intermediate highs.
Best regards, R. Linda!
