FOMO - The Urge That Costs You TwiceNOTE: This is a post on Mindset and emotion. It is NOT a Trade idea or strategy designed to make you money. I’m posting this to help you preserve your capital, energy and will so you can execute your own trading system with calm, patience and confidence.
So here we are, Gold kissing 4000.
It’s been on a tear and hasn’t looked back.
Relentless. Higher, higher, higher.
Now imagine being the trader who stalked this setup… but missed the entry.
The setup was clean. The context made sense.
But you hesitated. You wanted confirmation.
And now it’s gone.
At first, you tell yourself you’re fine.
You’ll wait for the pullback.
But the longer you watch, the more unsettled you become.
Your legs bounce.
Your breath shortens.
Price rips higher without you.
And the thought slips in…
“I can’t miss this.”
Before you know it, your hand hovers over the button
ready to break your own rules just to feel part of the move.
What’s really happening inside you:
Thoughts:
“Argghh… I knew it. Ok, it’s moving. Wait for the pullback.”
“Urgh… another headline, it keeps moving up… everyone else is in.”
“It’s not pulling back. This is the move I’ve been waiting for. Missing out is worse than losing.”
“I’ll never forgive myself if I just watch this go without me.”
Feelings: Restlessness. Envy. Urgency.
Behaviours: Dropping timeframes, chasing moves, flipping charts, forcing setups.
Body cues: Buzzing energy in chest or stomach, jittery hands, shallow breath, can’t sit still.
The Trigger:
Watching a move take off without you, especially after hesitation stopped you last time. Watching price rise without a look back. Everyone's talking about it. It’s on the newsfeed. ‘Record highs’. ‘Biggest day ever’.
Why it feels so powerful:
FOMO isn’t about the market. it’s about survival wiring.
Your brain equates “missing out” with exclusion, being left out.
So urgency feels safer than patience.
Acting now, even without an edge, feels like relief, because at least you’re doing something.
The real cost:
FOMO makes you chase highs and sell lows.
It costs you twice.
Once when you chase the move and lose.
And again when you lose faith in your own process.
Each time you act on urgency, you train your nervous system to link tension with execution.
That’s how confidence quietly drains away.
How to shift it:
Pause & name it: say out loud, “This is FOMO.” Awareness loosens its grip.
Breathe into it: slow your breath until your body settles. Teach your system that calm not chaos precedes execution.
Anchor: remind yourself the market is infinite. “It takes a second to wreck it… it takes time to build.” Beastie Boys
Reset: ask, “If I hadn’t seen that move, would I still take this setup?” If not, stand down.
Missing a move hurts but chasing it turns one mistake into two.
Discipline pays you back; impulse never does.
The market will always offer another opportunity.
Your edge is keeping your nerve, calm and self-control until it does.
By the way, for those that missed the Non Farm post last week. Turns out that Non Farm has been re-scheduled for this Friday... (but they can always reschedule again). Check this link out for anyone lining up for Non Farm this week.
Trigger

PUMP | #4h #long — Watching for Breakout Confirmation Early signals for a reversal, but not rushing in.
Some clear bullish divergence on the 4h RSI — first positive sign after an extended downtrend. Price can pop from here, but my plan is to wait for a break and hold above the 4h Order Block + MSS zone (red box) before taking any long entry.
Confirmation is key — I only want to get involved if we reclaim this area with momentum.
Scenario:
If we get a strong breakout and close above the red OB + MSS zone, that’s the first entry trigger for a potential trend reversal.
Until then — standing aside, letting the setup prove itself.
Reasoning:
Bullish RSI divergence often marks the beginning of a reversal, but without a structural breakout, the move can easily fail.
Patience pays off in these high-risk, low-liquidity coins.

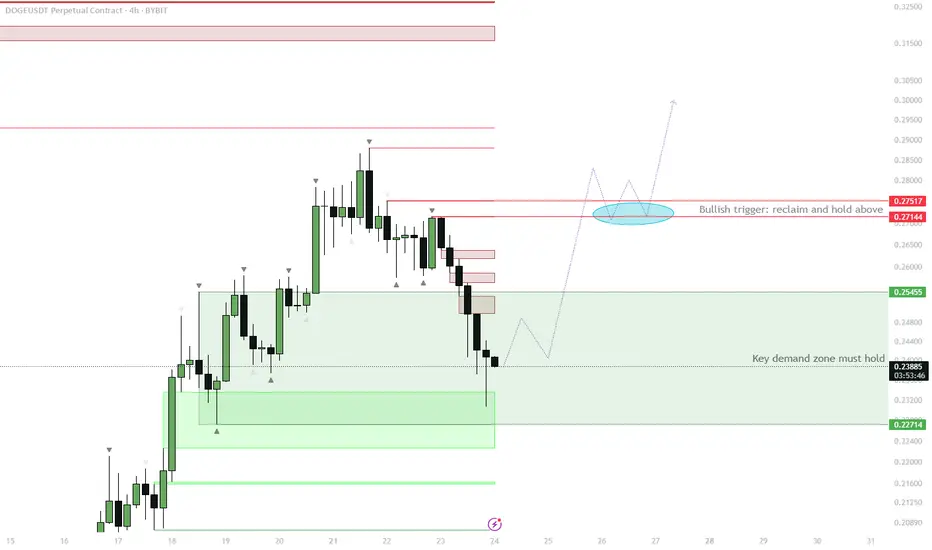
DOGE H4 – Demand Zone Reclaim as Bullish Trigger
Price is currently testing the H4 demand zone (~0.227–0.254).
Watch for price to reclaim the demand zone and close back above 0.254.
If confirmed, expect a move up toward the red resistance cluster at 0.271–0.275.
Consolidation above this area (highlighted in blue) would be a strong signal for continuation.
Invalidation: clean breakdown and acceptance below 0.227 signals failure of demand and deeper retrace.
This setup aims to capitalize on a classic liquidity sweep and demand reclaim. Typically, after taking out the flat open and collecting late shorts/stop losses, strong buying often steps in if demand is genuine. A successful reclaim and consolidation above the previous resistance will set the stage for bullish continuation. If this zone fails to hold, the move is invalidated and lower targets come into play. Waiting for confirmation reduces the risk of a failed bounce.
PEPE – Highest Weekly Close in 6 Months: Eyes on New HighsMajor Breakout Level:
Last week’s candle closed above the 1W S/R (~0.000013845), marking the highest weekly close in half a year.
Bullish Structure:
Price reclaimed and closed above a crucial weekly resistance. This flips the structure bullish, increasing odds of continuation.
Next Targets:
Immediate resistance lies near the 1M S/R (around 0.000020193–0.000020272). Break and close above opens way toward the 1.27–1.618 Fib extensions (0.000029793+).
Invalidation:
Failure to hold above the 1W S/R and a weekly close back below (~0.000013845) would invalidate the breakout, putting risk back toward mid-range support (0.000009697).
The weekly close above key resistance signals strong buyer interest and market acceptance of higher prices, especially after a multi-month consolidation. This “highest close in 6 months” is a classic trend continuation setup. The next natural target is the higher time frame resistance (1M S/R), with Fibs aligning to previous price action. Failure to hold the breakout level would suggest a failed move and likely mean-reversion.

ETHFI Key Reclaim Watch — Only Long Above $1.09 Confirmation✅ Price currently below major 1D S/R — no bullish bias yet
✅ Only looking for a long entry after confirmed reclaim of $1.09
✅ Structure remains bearish until then
Primary Scenario (Bullish):
Enter long only after confirmed reclaim/close above $1.09
Targets: Move to upper range ($2.76) on strength
Bearish/Flat Scenario:
If price fails to reclaim $1.09, no position — stay sidelined
🔔 Triggers & Confirmations:
Only long above $1.09 with confirmation (candle close, volume spike, or strong reclaim)
No trade below $1.09
🚨 Risk Warning:
Structure remains bearish below $1.09 — avoid bottom picking or forced trades

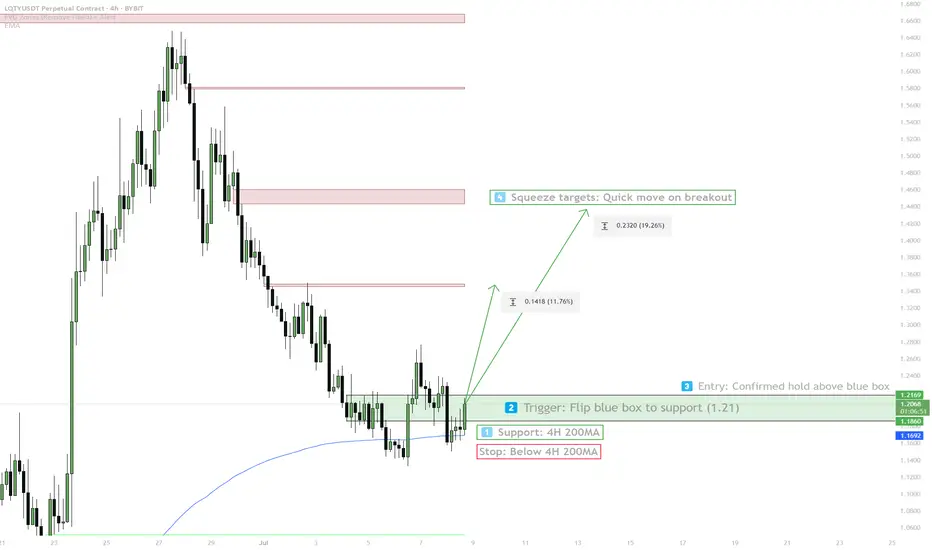
LQTY — 4H 200MA Hold & Squeeze Trigger1. Price holds above 4H 200MA
2. Flip blue box (1.21) to support for entry
3. Entry: Confirmed hold above blue box
4. Squeeze target: Quick move higher
5. Stop: Below 4H 200MA
BTC Range Bound | Breakout Imminent ?👀 Welcome to my Trading View Analysis and Trading Channel Here , we share the latest market analysis, trading signals, and key insights together .
Ready for smarter trades ? ⭐️
⚡️Today , we're going to analyze the BTC( BitCoin) coin together on the daily timeframe and find triggers for our positions .
📊✨ Bitcoin 4H Technical Analysis & Weekly Outlook – May 6, 2025
🔸 BTC is currently trading within a consolidation range between $97,325 and $93,780, indicating a potential accumulation zone before the next major move. 🌀
🔍 Key Technical Levels:
📈 Resistance: Break above $97,325 could trigger a long entry, suggesting bullish continuation. 🚀
📉 Support: Drop below $93,780 may activate a short setup, signaling bearish pressure. ⚠️
📐 Indicators Breakdown:
🔹 EMA 100 & 200: Positioned below price, supporting the bullish bias. 🟢
🔹 EMA 50: Currently sitting above the 4H candle, posing short-term resistance. 🔴
📉 Volume: Noticeable decline, showing market indecision – a common pre-breakout signal. 📊
📌 Key Pivot: A candle close above $94,021 would validate it as strong support. 🧱
📰 Positive Market Developments:
🏦 Morgan Stanley plans to offer spot BTC trading via E*Trade – institutional adoption accelerating. 📈
🏢 Strategy (MicroStrategy) signals further Bitcoin accumulation – corporate trust remains strong. 💼
💰 Over $1.8B flowed into U.S. BTC ETFs last week – investor appetite is growing rapidly. 🧲
📈 Analysts forecast BTC reaching $120K–$200K by end of 2025 – fueled by macro trends & halving cycle. 🌕
💡 Final Takeaway:
🔐 Bitcoin continues to prove itself as a valuable long-term asset, backed by rising institutional interest, robust on-chain fundamentals, and strong technical signals. 🌟
📊 Triggers for both long and short positions are clearly marked on the chart – stay sharp and manage risk! 🎯
I love you all so much . 👀
don't forget about capital management and risk management .
Be careful with your positions . 🥇

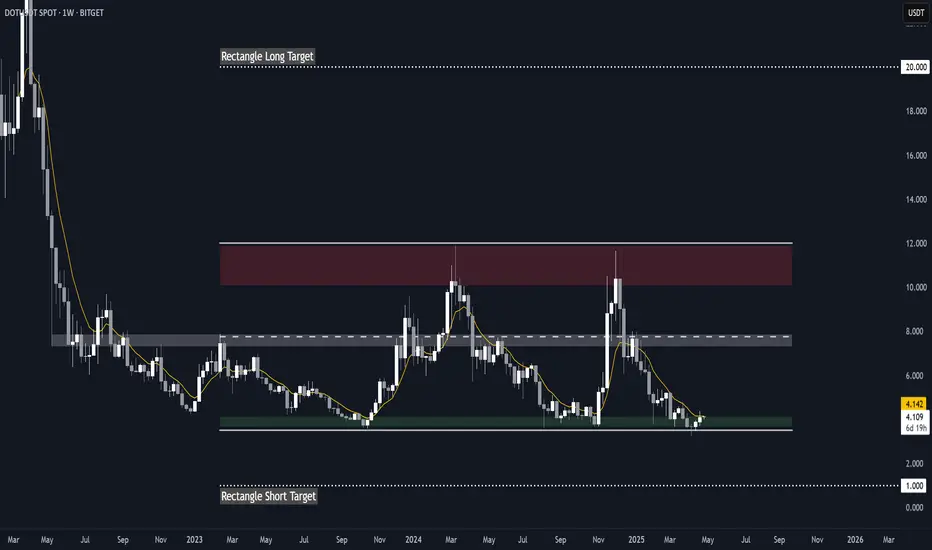
DOT RectangleBITGET:DOTUSDT has been trading in a rectangle since October 2023, with important key levels dating all the way back to May 2022. It also recently broke support, swept liquidity to $3.3 and reclaimed the demand zone, setting itself up for a potential rebound.
Key Levels to Watch
• $3.5-$4.0: Main demand zone
• ~$7.5: Rectangle midline + key S/R dating back to May 2022, could act as a strong resistance
• $10-$12: Main supply zone
Potential targets
Measured rectangle targets
• Breakout: $20
• Breakdown: $1.0
Other Considerations
Another laggard, similar to Filecoin ( ).
While it's still unclear whether these coins are rebounding or heading for a breakdown, they could offer some of the highest R/R potentials for longs, and they have very clear invalidations.
Triggers
• My long trigger for Polkadot would be a break above the 50-day EMA and the demand zone (~$4.0).
• Invalidation (and short trigger) would be a sustained break below $3.5 or a lower low below $3.3.
Alikze »» DOT | Corner pattern in 4H time frame🔍 Technical analysis: Corner pattern in 4H time frame
- It is oscillating in a corner pattern in the 4H time frame.
- According to the hunt of the previous swing, as well as the correction to the green box area and the creation of demand, an upward movement cycle is observed.
- This motivational move can move up to the broken swing of the 4.145 range.
- In case of a break, the next target is the HL ceiling and finally it can continue its growth dynamics until the trigger.
⚠️ In addition, if there is a selling pressure reaction in dealing with the swing, the correction can continue until the green box area.⚠️
»»»«««»»»«««»»»«««
Please support this idea with a LIKE and COMMENT if you find it useful and Click "Follow" on our profile if you'd like these trade ideas delivered straight to your email in the future.
Thanks for your continued support.
Best Regards,❤️
Alikze.
»»»«««»»»«««»»»«««
MEXC:DOTUSDT

NZDUSD - Wait For The Trigger 🏹Hello TradingView Family / Fellow Traders,
On 4H: Left Chart
NZDUSD has been bullish trading within the flat wedge pattern in red and it is currently hovering around the lower bound.
On 1H: Right Chart
📈 For the bulls to take over, we need a momentum candle close below above the neckline highlighted in gray.
📉 Meanwhile, NZDUSD would be bearish short-term and can still trade lower inside the daily support.
📚 Always follow your trading plan regarding entry, risk management, and trade management.
Good luck!
All Strategies Are Good; If Managed Properly!
~Richard Nasr

AUDUSD - Wait For The Trigger 🏹Hello TradingView Family / Fellow Traders,
On Daily: Left Chart
AUDUSD has been bearish but it is currently approaching a robust support zone so we will be looking for buy setups on lower timeframes.
On H1: Right Chart
📈 For the bulls to take over, we need a momentum candle close below above the neckline highlighted in gray.
📉 Meanwhile, AUDUSD would be bearish short-term and can still trade lower inside the daily support.
📚 Always follow your trading plan regarding entry, risk management, and trade management.
Good luck!
All Strategies Are Good; If Managed Properly!
~Richard Nasr

GBPJPY - Wait For The Trigger 👌Hello TradingView Family / Fellow Traders,
On Daily: Left Chart
GBPJPY has trading inside a range in the shape of a rising wedge pattern.
Currently, GBPJPY is approaching the upper bound of the wedge pattern so we will be looking for sell setups on lower timeframes.
On H4: Right Chart
📈 For the bears to take over, we need a momentum candle close below the last major lower in gray.
📉 Meanwhile, GBPJPY would be bullish short-term and can still trade higher to test the upper orange trendline again.
📚 Always follow your trading plan regarding entry, risk management, and trade management.
Good luck!
All Strategies Are Good; If Managed Properly!
~Richard Nasr

NZDCAD - Keep It Simple 👌Hello TradingView Family / Fellow Traders,
On Daily: Left Chart
NZDCAD broke below a previous major low so it is now acting as a local resistance zone, thus we will be looking for trend-following sell setups on lower timeframes.
On H1: Right Chart
📈 For the bears to take over, we need a momentum candle close below the last major low in gray.
📉 Meanwhile, until the bears take over, NZDCAD can still trade higher for an over-extended correction movement.
📚 Always follow your trading plan regarding entry, risk management, and trade management.
Good luck!
All Strategies Are Good; If Managed Properly!
~Richard Nasr

ETH getting ready to drop to some massive supportSure, there is upside to 1780 and it could keep climbing, but I think we're going to see it drop before that occurs. There is a support trend heading in the bearish direction
Then you have two really weak resistance lines developing on short term charts. Which makes me think it's about to see a drop off of those and then head to the bearish support trend.
This is the best part because a lot of trends are leading to the same spot, which is a massive support trend climbing in the bullish direction.
Personally, I see a fast movement down and then the next movement taking the price to 1745-1780 before coming back down to test 1690 again.
Price target is more important, the 1608 target, the 1680 rejection, and the 1700+ line.
I'll likely keep the updated price targets for this chart on my site, but otherwise, you'll need a new chart should the 1608 line fail or should the green trend break, which is a BIG time exit point trigger.

CADCHF - Detailed Video Analysis 📹 From Daily To H1Hello TradingView Family / Fellow Traders. This is Richard, also known as theSignalyst.
📈 Here is a detailed update top-down analysis for #CADCHF.
Which scenario do you think is more likely to happen? and Why?
📚 Always follow your trading plan regarding entry, risk management, and trade management.
Good Luck!.
All Strategies Are Good; If Managed Properly!
~Rich

GBPAUD - Top Down Analysis 📹 From Daily To H1Hello TradingView Family / Fellow Traders. This is Richard, also known as theSignalyst.
📈 Here is a detailed update top-down analysis for #GBPAUD.
Which scenario do you think is more likely to happen? and Why?
📚 Always follow your trading plan regarding entry, risk management, and trade management.
Good Luck!.
All Strategies Are Good; If Managed Properly!
~Rich

AUDCHF - Looking For Buy Setups ❗️Hello TradingView Family / Fellow Traders. This is Richard, also known as theSignalyst.
AUDCHF has been overall bullish trading inside the rising wedge pattern in blue, and it is currently retesting the lower trendline.
Moreover, the zone 0.59 is a strong demand.
🏹 So the highlighted purple circle is a strong area to look for buy setups as it is the intersection of the blue demand and lower blue trendline.
As per my trading style:
As AUDCHF is sitting around the purple circle zone, I will be looking for bullish reversal setups (like a double bottom pattern, trendline break , and so on...)
📚 Always follow your trading plan regarding entry, risk management, and trade management.
Good luck!
All Strategies Are Good; If Managed Properly!
~Rich

GBPAUD - Wait For The Trigger ↘️Hello TradingView Family / Fellow Traders. This is Richard, also known as theSignalyst.
on Weekly: Left Chart
GBPAUD is retesting a resistance zone in green so we will be looking for sell setups on lower timeframes.
on H1: Right Chart
GBPAUD is forming a channel in red but it is not ready to go yet.
🏹 For the bears to take over, we need a momentum candle close below the gray low.
Meanwhile, until the buy is activated, GBPAUD would be overall bullish and can still trade higher inside the resistance or even break it upward.
📚 Always follow your trading plan regarding entry, risk management, and trade management.
Good luck!
All Strategies Are Good; If Managed Properly!
~Rich

AUDNZD - from Daily to M30📹Hello TradingView Family / Fellow Traders. This is Richard, also known as theSignalyst.
📈 Here is a detailed update top-down analysis for AUDNZD.
Which scenario do you think is more likely to happen? and Why?
📚 Always follow your trading plan regarding entry, risk management, and trade management.
Good Luck!.
All Strategies Are Good; If Managed Properly!
~Rich

ETH - Trigger for a Trend-Following Setup ❗️Hello TradingView Family / Fellow Traders. This is Richard, also known as theSignalyst.
📌 on H4: Left Chart
As per my last analysis, we know that ETH is overall bullish trading inside the rising channel in orange.
As mentioned, we are waiting for ETH to approach the lower orange trendline and demand to look for trend-following buy setups on lower timeframes.
📌 on H1: Right Chart
ETH is now in a correction phase trading inside the falling broadening wedge in red.
For the bulls to take over again, to start the next bullish impulse, we need a break above the last major high and red trendline in red.
📉 Meanwhile, until the buy is activated, ETH can still trade lower to test the orange trendline and zone.
Which scenario do you think is more likely to happen first? and why?
📚 Always follow your trading plan regarding entry, risk management, and trade management.
Good luck!
All Strategies Are Good; If Managed Properly!
~Rich

NZDJPY - Trend-Following Setup! 📉Hello TradingView Family / Fellow Traders. This is Richard, also known as theSignalyst.
on DAILY: Left Chart
NZDJPY has been bearish trading inside the falling channel in blue. And it is currently approaching the upper trendline and resistance, so we will be looking for sell setups on lower timeframes.
on H1: Right Chart
NZDJPY is forming a channel in red but it is not ready to go yet.
🏹 For the bears to take over, we need a momentum candle close below the last low in gray.
Meanwhile, until the sell is activated, NZDJPY can still trade higher inside the green resistance.
📚 Always follow your trading plan regarding entry, risk management, and trade management.
Good luck!
All Strategies Are Good; If Managed Properly!
~Rich

GBPJPY - Trend-Following Buy Setup!Hello TradingView Family / Fellow Traders. This is Richard, as known as theSignalyst.
on H4: Left Chart
GBPJPY is overall bullish trading inside the blue channel. So we will be looking for trend-following buy setups on lower timeframes.
on H1: Right Chart
GBPJPY is stuck inside a range around the lower blue trendline acting as a non-horizontal support.
🏹 Trigger => for the bulls to take over, we need a momentum candle close above the last high in gray.
Meanwhile, until the buy is activated, GBPJPY can still trade lower till the green support zone.
📚 Always follow your trading plan regarding entry, risk management, and trade management.
Good luck!
All Strategies Are Good; If Managed Properly!
~Rich

NZDUSD - Now Wait For The Bulls!⏰Hello TradingView Family / Fellow Traders. This is Richard, as known as theSignalyst.
on DAILY: Left Chart
NZDUSD has been trading inside a big range between our support and resistance.
Previously, we were looking for sell setups around resistance. Now since NZDUSD is sitting around the support zone, we will be looking for buy setups on lower timeframes.
on H4: Right Chart
NZDUSD is forming a channel in blue.
For the bulls to take over, we need a momentum candle close above the last major high in gray.
Meanwhile, until the buy is activated, NZDUSD can still trade lower inside the support or even break it downward.
Always follow your trading plan regarding entry, risk management, and trade management.
Good luck!
All Strategies Are Good; If Managed Properly!
~Rich
