APT 1D Analysis - Key Triggers Ahead☃️ Welcome to the cryptos winter , I hope you’ve started your day well.
⏰ We’re analyzing APT on the 1-Day timeframe .
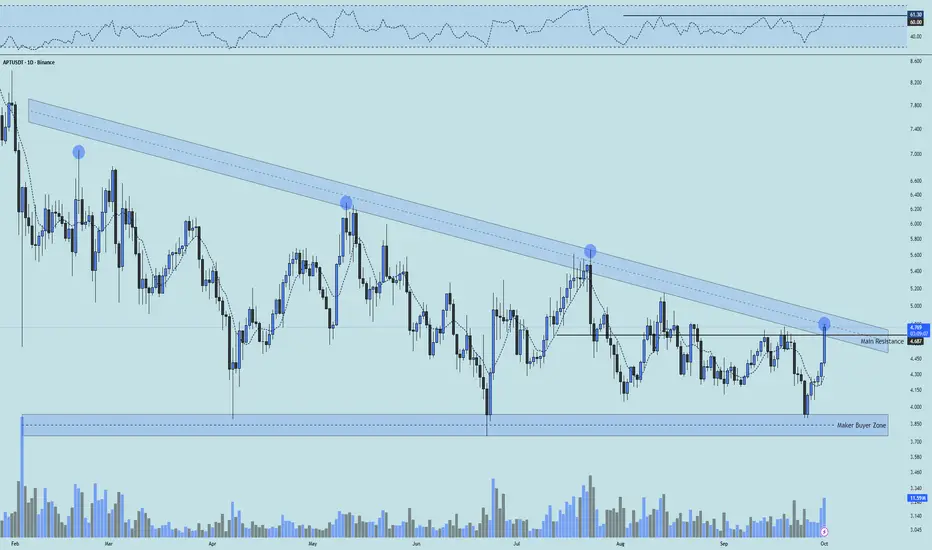
👀 On the daily timeframe for Aptos, we can see it's ranked 36 on CoinMarketCap, and its 24h trading volume is around 16% of its total market cap. This indicates heavy activity and high liquidity. APT is moving inside a triangular range, currently consolidating at the end of this triangle, with signs of a potential breakout. If it breaks and confirms above this structure, the coin could begin a price recovery after 240 days of ranging and selling pressure, pushing toward its higher resistances. The key resistance right now is at $4.7, and a confirmed breakout above this level can send it toward its next resistance zones.
🧮 Looking at the RSI oscillator, it was ranging inside a box between the 30–60 zone. On the 4th touch, the top of the box was broken and RSI crossed above 60. Our main RSI confirmation comes with a daily candle close above the $4.7 resistance, along with RSI stabilizing above 60, which would trigger increased volume, volatility, and even push RSI toward the overbought zone.
🕯 The size, volume, and number of recent green candles after the last touch of the maker-buyer zone have noticeably increased, with 6 bullish candles pushing the price toward the key resistance. Market participants in crypto are waiting to see the reaction here. From a time perspective, the coin spent 240 days in a descending range and completed a proper correction. Now that it's in the final squeeze phase, buying volume has increased well, and if the momentum continues, the coin could see a strong price rally.
💸 On the BINANCE:APTBTC pair, we can see it's at the end of the triangle and has almost pushed above its resistance with a whale candle, though volume is still relatively low. If the price stabilizes above the marked resistance on this pair and we also see rising volume on the USDT pair, a significant outperformance against Bitcoin is likely. This could attract whale attention and encourage rotation from BTC into APT.
🧠 For positioning on Aptos, entering with a reasonable risk makes sense, especially since after 240 days it's showing signs of forming a higher low and potentially a higher high. With a breakout above $4.7, the coin can continue toward its upper resistance levels.
↗️ Long Scenario: Breakout and confirmation above $4.7, with RSI stabilizing above the 60 zone as seen in the analysis, along with a confirmed breakout and support hold on the BTC pair. With increasing long volume and a completed pullback, entering on a secure higher low in multi-timeframe structure would be valid.
📉 Short Scenario (Risky): It's almost unlikely that the coin drops significantly from current levels, but if it does, losing the maker-buyer zone on both USDT and BTC pairs could trigger a deep correction with maximum selling pressure. Keep in mind, short positions in this phase of market compression breakouts are generally illogical since price reversals are very likely in these trends.
❤️ Disclaimer : This analysis is purely based on my personal opinion and I only trade if the stated triggers are activated .
Tringle
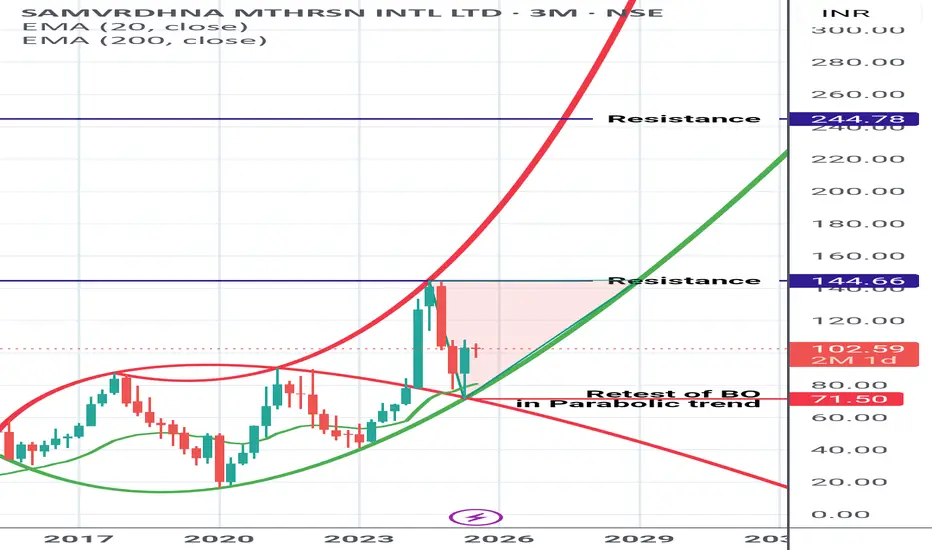
Samvardhna Motherson Getting ready Samvardhna Motherson
Earlier mentioned about Elliptical Pattern Breakout and the Rally in it .
Currently retesting the Parabolic trend support and trading inside the Triangular zone.
View is : Slowly getting ready for big rally. Stay invested.
Purely based on My STUDY . Lets see how it works.
Don't get biased by my views.
I may be wrong too.
Always do your own research.
Shared it for Reference purpose
Wait for Breakout in Silver...MCX:SILVER1! trade at 91600 level. Silver trade in a triangle range last 6 month. You can watch for either up or down side move after breakout...

Atom is going to new highConsidering that a triangle occurs at the end of a complex correction, it seems that the price has completed wave 4 and is at the beginning of wave 5 impulse. In this case, I expect the price to go beyond the end of wave 3. and touch at least $12.7.

SolanaHi guys
on the weekly time frame; If the red downtrend line breaks upwards, we may be ready to complete the flag pattern.
But the situation is not interesting here at the moment.
If the red support area ($104.5) is completely consumed, we expect a reaction from the area of $188.4 or $160.3, and the possibility of continuing the downward trend to the specified price area is strengthened.
If the support area of $104.5 is preserved and the downtrend line is broken upwards, our mentality for an uptrend will be strengthened.
What do you think?

EUR/USD: PAT + VPA 10/02/2024Good afternoon,
Today, my focus will be on identifying long entries for a long position, as we appear to have reached a selling climax.
On the 15-minute time frame, a robust demand zone is evident between 1.0300 and 1.0400. The market has made a significant move towards 1.0300, leaving indications of early buying activity from "Market Makers." A notable reversal occurred on October 1st, followed by the formation of a bullish wedge (which is typically a bearish pattern) that pushed the market below the previous low. Currently, we are beginning to form a triangle on the 15-minute chart, which serves as a critical signal for a potential market reversal, particularly since it has not managed to fill the liquidity above it. This downward movement seems designed to eliminate the remaining sellers and early buyers. Additionally, my strategy, "High Clear," has materialized, suggesting that a liquidity sweep of the recent low was anticipated.
I am now monitoring the fourth leg of the triangle as it approaches the lower congestion line, preparing for a potential breakout with the fifth leg. It is important to note that if a sixth leg forms, it would indicate a continuation of the market trend.
I suspect that the market is attempting to prompt traders to shift to short positions, setting the stage for one final significant rally towards 1.1300. I anticipate that the market could reach this level in the coming weeks, unless we observe the formation of a six-legged triangle.
The Pip Assassin
FX:EURUSD TVC:DXY XETR:DAX

PFC may break again All Time High Level...NSE:PFC trade at 555 level. After breakout you can watch for an Upside move...

oil breaking lower line of triangle after long sideway correction before us election
price breaking lower yellow line on recession fear
after breakout 65 will be first big support level

AXSIt seems that according to the maintenance of the upward trend line (we do not have a LL on the price chart), if the resistance range of $8.7 is completely consumed; The probability of the continuation of the upward trend similar to the scenario is high.
If this specified resistance area is not completely consumed, we expect a downward trend and the bullish scenario is invalid.
At the moment, we do not have a signal for a bearish trend on the price chart. On the other hand, a relatively attractive candlestick pattern tangential to the upward trend line has been formed for us.
What do you think?

Shibainu,,, Poolback completion stage Shiba is placed in a triangle, after the triangle is completed, based on the support and resistance points, I expect an upswing.

Shibainu... 🎯 Target Shiba can grow by 300%.
After exiting the triangle, wait for Shiba's pump to reach the drawn area.

Shiba inu ... tecnicall analysis Shiba is placed in this triangle, I see it as bullish, but there are buy downs in it, we have to wait to see which direction it will go in the end. After leaving the trend lines and the triangle.

Imxusdt , technical analysis In this chart we see a triangle, triangles have very interesting rules and show the exit up or down, now the exit from my hypothetical triangle has been up, it can still go along with the swing.

Indusind bank - Triangle trading set up1. Beautiful, clean & crisp book set up
2. Good RR trade set up - 1:5+ RR
3. Very tight consolidation

EURGBP Watch Price Action to go Long Very good Opportunity Hey fans i hope you doing well just watch the bottom for price action and take the long position thanks

Dogecoin , analyst position Friends, Doge is out of the triangle, it will grow as long as the triangle.

WIPRO- Hourly/Daily/Weekly Timeframe-Channel/Tringle patternNSE:WIPRO
WIPRO has beaten so badly in last few months. The stock is near major support levels. The Sellers are trying to push it however somehow it is holding its levels.
Weekly : It has formed double bottom (355-360 level) at the bottom of the channel. As per weekly chart 370-380 was earlier resistance from where we saw sharp buying. Now it is retesting these levels and holding it from past 2 days. Besides it’s a .5 Fib level as well.
Daily : On 26th June there is a rejection from the bot (Hammer) which indicates 370-373 is strong support levels.
Hourly : From past 3 days it’s consolidating between 378-390 in tringle pattern. On Friday 30th June if we see a bullish price action near these levels it’s the best time to go long with small SL.
For positional traders SL should be around 370.
This is only for educational purpose, please manage your risk accordingly.

HEROMOTOCORP- Daily/Hourly Timeframe-Tringle PatternNSE:HEROMOTOCO
Entire auto sector has outperformed in past few weeks, However HEROMOTOCO is looking a bit weak as per as per the daily chart, it has broke its previous daily swing low.
Stock is consolidating in tringle in hourly chart. In hourly chart buyers are trying to push price higher (Higher lows) however sellers are defending level 2840-2855.
If it breaks either side we may see a momentum, keep eye.
This idea is only for educational purpose, please manage your risk accordingly.

JSW Steels ooks great. JSW looks all set to give a beautiful breakout as Nifty has made high record today and now now just one inch away to touch 19000 level.
Tarde can be initiated in JSW if it closes above at 800 level. Target could depends at one's risk appetite with proper stoploss. Again not a recommendation, Just a view and I might be wrong sometimes.

HATSUN-Tringle Breakout-Daily TimeframeNSE:HATSUN
Stock has consolidated very well from past few days and it has given a breakout from tringle on 26th June.
Good opportunity to go along with SL below the consolidation.
Target: 1040 1100
This is only for educational purpose, please manage your risk accordingly.

Triangle in Nifty50Nifty moving in Triangle pattern. Whichever side it will break.. take entry with SL of breakout candle.

Shibai. Technical analysis The triangle was broken, I expect the growth of the length of the triangle from it.

Dogecoin.🐕 Technical analyst If Dodge breaks this downward triangle, it will go down to 55, but if the triangle changes upwards, it will rise to 10/500.
