TRIPLE TOP FORMING for ARPAThis bearish formation means there could be a breakdown down to the 0.1014 range.
Tripletop

ARPA continuing down trend post its triple topNobody likes a downtrend, I get that. And I really hope and wish my assessment here is incorrect. Unfortunately, the post triple top down trend continues.

Triple Top or Triple Bottom?Technical Analysis:
Triple Top: Line A - Line B
Triple Top Possible: Line X - Line Y
Confirmed Formations:
Triple Top: A-B
Up Trendline (-N-) break during wave (D)
Bounce off trendline (-X-) at point (E).
Notable Mentions:
Trendline (-X-) is 23.6% Fibonacci retracement of 2020 lows to Jan 2022 Highs.
Low volume at peak (C)
Increased volume at point (E) to the downside
Increased volume during the breakout to the downside of triple top A-B
Triple top formed inside trendline (-A-) and (-B-) inside the 5min timeframe. The last wave in triple top A-B did not touch the top of trendline (-A-), some may see this as a failed double bottom or false breakout.
We entered a possible triple top formation inside trendlines (-X-) and (-Y-). This may turn out to be a triple bottom. Confirmation is to be seen after a sustained penetration below trendline (-Y-) or above trendline (-X-).
Bearish: Break and sustain under (-Y-) possible return move (G) and or reversal at point (G).
Bullish: Break and sustain above trendline (-B-) from the A-B triple top and sustain above major uptrend line (-N-)
Please feel free to give your input, I am in the process of learning Technical Analysis and it would be an honor to learn from you.

EURUSD is falling with 🗻🗻🗻Triple Top Pattern🗻🗻🗻!!!EURUSD managed to form a 🗻🗻🗻 Triple Top pattern 🗻🗻🗻.
EURUSD is currently completing the pullback .
I expect EURUSD to drop to the next 🟢 support zone($ 1.076-$ 1.0712) 🟢 after completing the pullback to the 🔴 resistance zone($1.095-$ 1.0915) 🔴 and the neckline.
🔅Euro/U.S.Dollar Analyze ( EURUSD ), 4-hour time frame ⏰.
Do not forget to put Stop loss for your positions (For every position you want to open).
Please follow your strategy, this is just my idea, and I will gladly see your ideas in this post.
Please do not forget the ✅' like '✅ button 🙏😊 & Share it with your friends; thanks, and Trade safe.

Gold Bugs Squished?I've been talking about Gold COMEX:GC1! hitting a major high for my last two Livestreams (catch them Friday at 4pm Eastern after the market close). The current price action warrants a standalone post.
Each Livestream for many months has had at least one person ask what I thought about Gold. It was very simple: Gold was trending UP to test the major Monthly highs. In many of my social market chats about two weeks ago my gold bug friends began getting very excited. I urged caution. Price MUST break the high and confirm the breakout before getting long at this major Resistance Level. Now it looks as of gold price is respecting this monthly high from the last few years.
To be contrarian I had to short Gold (using AMEX:GLD ) based upon a Spike setup from Friday May 5th's high. Last week price pulled back and "should have gone" to retest and break the high. It did not and returned back inside the range. This sets up a short. I also know from taking market sentiment that a lot of traders may have gotten a bit overly optimistic. This could setup for a good pullback to at least the 1850 Level.

AUDCAD - BEARISH TRIPLE TOPHello Traders👋🏻
The AUDCAD Price Reached a Resistance Level ✔️
The Price Failed To Create New Higher High and formed a Triple Top Pattern ✔️
The Neckline is Broken 🔥
If Price Stays Under The Key Zone, AUDCAD Can Continue The Bearish Move 📉
-----
TARGET: 0.89655🎯
___________
if you agreed with this IDEA, please leave a LIKE, SUBSCRIBE or COMMENT!

CADCHF - BEARISH TRIPLE TOP📉Hello Traders👋🏻
The CADCHF Price Reached a Supply Zone ✔
The Price Failed To Create New Higher High📈
Currently, CADCHF Formed a Triple Top Pattern ✔
The Neckline is Broken 🔥
If Price Stays Under The Key Zone, CADCHF Can Continue The Bearish Move 📉
-----
TARGET 1: 0.65795🎯
TARGET 2: 0.65365🎯
___________
if you agreed with this IDEA, please leave a LIKE, SUBSCRIBE or COMMENT!

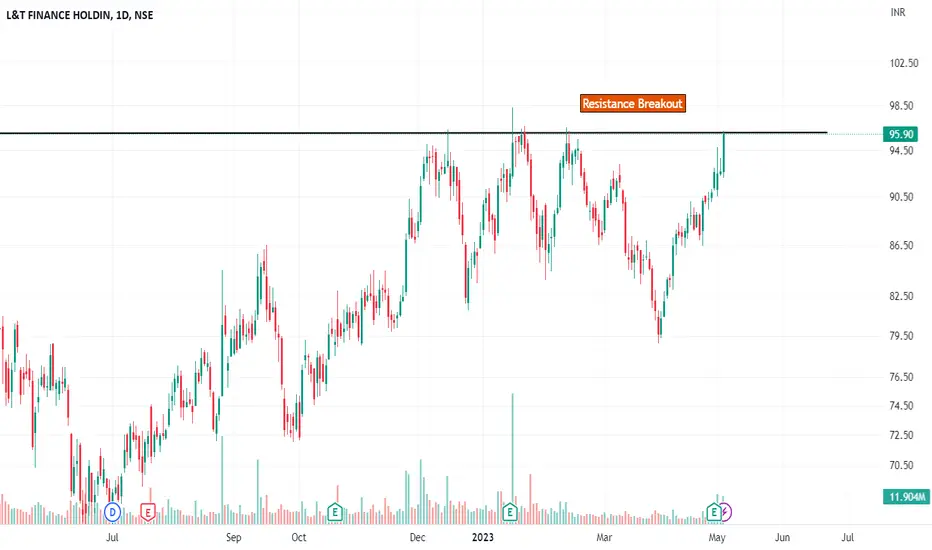
Resistance BreakoutPlease look into the chart for a detailed understanding.
Consider these for short-term & swing trades with 2% profit.
For BTST trades consider booking
target for 1% - 2%
For long-term trades look out for resistance drawn above closing.
Please consider these ideas for educational purpose
The Big ShortThe Big Short came in on the Weekly Chart with a Triple Top RSI Divergence. Currently, there isn't any opportunity for me to engage in the shorting opportunity.
While waiting for a tested strategy like the Bearish 5-0pattern to appear, I will look out for other trading opportunity like buying on the demand zone or a Bullish Shark Pattern in taking the conservative targets.

GOLD | XAUUSD | DECRYPTERS HI people Welcome to Team Decrypters
GOLD FORECAST / GOLD PLAN (OVER ALL SHORT PLAN ):-
We Are Expecting Reversal in GOLD SOON
RETRACEMENT TILL :- 1960 AREA & 1870 AREA
IF we go up first and than come down SURELY we going For Deep Retracement
* * News will Come later to support My IDEA * *
Note:- Even if we hit ATH like 2100 $ $ level , we will expect same Targets (WE ALSO LOOKING TO BUY RETRACEMENT UNTILL 1 MORE UP OR ATH ) What ever comes first we play it
REMEMBER THIS IS TRADING PLAND NOT TRADING SETUP
TRADING SETUP ONLY INITIATED ONCE YOU FIND "CONFIRMATIONS"

It's ONLY ONE Direction, DOWN!!The Bearish 5-0Pattern has been confirmed at 82.91; traders who want to jump in for a shorting opportunity could wait for a retest at that level.
Alternatively, you could wait for a Triple Top Retest at 83.22 on the 1-hourly chart(left).

GBP-USDThe GBP-USD pair currently traded at 1.24450 that is the daily time frame resistance. And also triple top in 4h timeframe.

BBCA >>> Bearish Head and ShoulderBBCA is going to make a downside movement, the target will be 1.618 Fibonacci ratio near the previous gap or 2.24, near the classic target of Head and Shoulder pattern (yellow horizontal line)
#fibomic
#BBCA

📉 4 Common Bearish PatternsIn trading, a bearish pattern is a technical chart pattern that indicates a potential trend reversal from an uptrend to a downtrend. These patterns are characterized by a series of price movements that signal a bearish sentiment among traders.
📍Bear Flag
🔸 A small rectangular pattern that slopes against the preceding trend
🔸 Forms after a rapid price decline (flagpole)
🔸 The pattern is completed when the price breaks below the lower trend line of the flag
📍Descending Triangle
🔸 A bearish continuation pattern that forms with a horizontal support line and a descending trendline
🔸 Forms as the price reaches lower highs, while the lows remain at the same level
🔸 The pattern is completed when the price breaks below the horizontal support line
📍Rising Wedge
🔸 A bearish reversal pattern that forms with a series of higher highs and higher lows
🔸 The pattern forms as the price moves up in a narrowing range
🔸 The pattern is completed when the price breaks below the lower trendline
📍Triple Top
🔸 A bearish reversal pattern that forms with three peaks at the same price level
🔸 The pattern forms as the price reaches resistance at the same level multiple times
🔸 The pattern is completed when the price breaks below the support level, which connects the lows between the peaks
👤 @AlgoBuddy
📅 Daily Ideas about market update, psychology & indicators
❤️ If you appreciate our work, please like, comment and follow ❤️

USDCHF - Waiting for a Breakout...
The USDCHF Price Touched the Weekly Resistance Level 📉
Currently, The price is in Double Top Pattern !
i'm waiting for a breakout in the neckline 🔥
Then! we will see a bearish move 📉
TARGET: 0.92925🎯
.....
if you agreed with this IDEA, please leave a LIKE, FOLLOW or COMMENT!

NZDJPYThis Is JUST An IDEA.
NZDJPY BEARISH TRIPLE TOPS.
IN NZDJPY H2 Timeframe Have BEARISH TRIPLE TOPS PATTERN When saw a bearish candle under the PINK LINE Accepted that and TAKE PROFIT Are GREEN LINES.
Be joyful and give to another one.

Triple Top Pattern on a big cap companyIDX:BBCA is likely forming a Triple top pattern, if the breakout is true then it will go down to its support at 7650. CMIIW

USD?JPY Tripel topSo in this idea there is a triple top that was made on the 4H and nice retest on the 1H so it may be a nice sell opportunity.
Please like and leave a comment if you agree!!!

Procter & Gamble Company – PG• Triple top formation in the first weeks of the year
• Followed by a correction to the price target of USD 143.60, which was the appr. high of the flag
• New flag formation with a price target of USD 124.94
• It looks like the stock will test the last October lows

GBPUSD SellsAs you can see, GU made a triple top over the past few days, price pushed down below the 200ema support to make it a resistance. Price is currently in consolidation, however, I think we will see more sells on this pair. !good bearish 1hr or 4hr should send price down

ITC LIMITED 1HRTOMORROW STOCK🔰
ITC limited is looking good for tomorrow price is in the rangebound and formed triple top if price breaks the resistance it will give upper moment if price reversal from the resistance price will touch the support trade after good confirmation
Have a profitable day
Thank you😊

Learn a Triple Top Pattern | Classic Reversal Pattern You Must
🟢What is the Triple Top Pattern?
A triple top chart pattern is a bearish reversal chart pattern that is formed after an uptrend.
This pattern is formed with three peaks above a support level/neckline.
The first peak is formed after a strong uptrend and then retrace back to the neckline.
The formation of this pattern is completed when the prices move back to the neckline after forming the third peak.
When the prices break through the neckline or the support level after forming three peaks then the bearish trend reversal is confirmed.
🟢Trading the Triple Top
There are some rules when trading the Triple Top chart pattern.
✔️Firstly one should identify the market phase whether it is in uptrend or downtrend. As the triple top is formed at the end of an uptrend, the prior trend should be an uptrend.
✔️Traders should spot if three rounding tops are forming.
✔️Traders should only enter the short position when the price breaks out from the support level or the neckline.
🟢Stop Loss
In the case of a Triple Top chart pattern, the stop loss should be placed at the third top of the pattern.
🟢Price Target
The price target should be equal to the distance between the neckline and the tops, also taking into the account the key levels below.
Like, comment and subscribe to boost your trading!
Hey traders, let me know what subject do you want to dive in in the next post?

EURAUD is going down hardSell everything and your kitchen sink lol. A head and shoulders, and a triple top at the 800ema resistance, if this doesn't go down, then I don't know lol
