These Moves Can Lead The Tron To $0.35Hi friends hope you are well and welcome to the new update on Tron. After the drastic drop from Feb to March 2020 the TRX has started the recovery rally like all other top coins. On daily chart the priceline has formed an up channel for the upward movement and recently on 10th and 11th May we have witnessed strong bearish candlesticks. And at that time the TRX was likely to break down the channel support. But now the candlesticks are moving side with the support and weak bullish candlesticks are appeared signaling that the bears are losing control.
The exponential moving averages:
After the death cross between EMA 10 and exponential moving average 21 on 25th of February the price action was facing a strong bearish trend. Finally on 7th April the EMA 10 crossed up the EMA 21 and formed the golden cross. Since then the price action is using the exponential moving average 10 and EMA21 as strong support. We can see from 10th to 22nd of April the candlesticks had been moving sideways on these EMAs and used these exponential moving averages as support very well then moved up and started the next rally. at this time the price action is again moving sideways on EMA 10 and 21 and using these exponential moving averages as a support. Therefore we need the closing above these EMAs for the next bullish rally.
The simple moving averages:
If we watch the simple moving averages on the daily chart then it can be clearly seen that since the price action has turned bullish in the mid of March 2020 it has easily broken out the 25, 50, 100 and 200 simple moving averages. After breaking out the 200 smple moving average the TRX tried retest the previous resistance as support but could not retained its position and moved down at 25 simple moving average again. At this time 50 SMA is moving up to form the golden cross with 100 in 200 SMAs. Once we will have the golden cross between 50 and 200 simple moving averages then it can produce more powerful bullish rally that can help the price line of TRX to break out the resistance of the channel that has been formed on the daily chart.
Triangle on long term chart:
Now if we switch to the long-term weekly chart then the price action of Tron has formed a triangle. And after hitting at the support it is getting bounced from there. I have also place the volume profile on the complete price action moving within this triangle. that is showing that the traders interest is very low below the support of this pattern. Therefore when the price action moved down where the trader’s interest was very weak TRX turned bullish and now it is likely to make another attempt to break out the resistance of this triangle. If we watch the movement of Bollinger bands then the upper band of the bollinger bands is above the resistance of the triangle. That is very positive sign and that will be helpful for the priceline for the breakout. Because if this bollinger bands would be below the resistance of the triangle then it could play a role of strong resistance to stop the priceline reaching the triangle resistance.
The breakout from key level resistance can lead Tron to $0.35:
Now I would like to show you the long-term resistance and support levels on this weekly chart. In my previous article we have seen that the priceline was at the support of $0.0127. Now it is getting bounced from the support and moving towards the next resistance level of $0.023. On this chart we have a key level resistance at $0.04. This $0.04 resistance level is very strong because since July 2018 when it was broken down the price action is not able to break out this resistance level again.
Once the Tron will be able to break out this key level resistance then there is no significant resistance level between $0.04 to $0.08. And in my point of view once the price action will break out this $0.04 resistance level then TRX will easily break out the next resistance level of $0.08 and then this breakout can lead the price action to hit the previous highest price of $0.35.
Big bullish harmonic move:
Here I would like to recall a very big bullish Shark pattern that has been formed on the monthly chart. I've also shown this pattern in my previous articles as well. I was expecting that after taking bullish divergence from the potential reversal zone of this pattern the price action will breakout all resistance levels on long term. But unfortunately after taking the bullish divergence of 114% the price action again dropped down in the potential reversal zone. But this buying zone level is a very strong support therefore the price action is likely to move up again on the long term and soon it was start a sequence of green bullish candlesticks. I am pretty sure that this bullish Shark pattern will be very much helpful for Tron to reach the previous highest price level of $0.35 that is more than 2000% from here.
Conclusion:
Further bullish movement depends in breaking out the 100 and 200 SMAs and the channels resistance on the daily chart. Once the price action will breakout these resistance levels then TRX can break out the resistance of triangle on long-term weekly chart then it can break out the key level resistance of 4 cents to achieve the highest price of 35 cents on long term.
Note: This idea is education purpose only and not intended to be investment advice, please seek a duly licensed professional and do you own research before any investment.
Tronusd

TRX/USDT - a triangle as a continuation of the trend.Reason for the purchase:
* Level breakdown 0.015.
* There was a level test.
* Moving average is directed to the long.
* The triangle is a pattern of trend continuation.
* A stop-loss can be tied to a level.
* I think there should be another push.
If you have your own opinion or thoughts about current market situation, feel free to write it in comment below !

TRXUSD 50% Profit Booked in 15 Days Check our Trade guys#TRXUSD 50% profit Update:
We opened Trade Of trxusd At 0.0120$ and Now went upto 0.0177$.
So total 48% profit.
#TRX finally hit our All Targets guys and booked 45% Profit.
#TRON went upto $0.0177 congrats guys you can take #PROFIT now.
Please like and follow me for latest crypto updates.
we always Provide Our best and Also only focus on Quality Updates.
Thank you

Tron transition ideaTransition between 2.618 and 1.618 fib levels saw a bullrun prior, will it see a bull run this time? Looking for a breakout
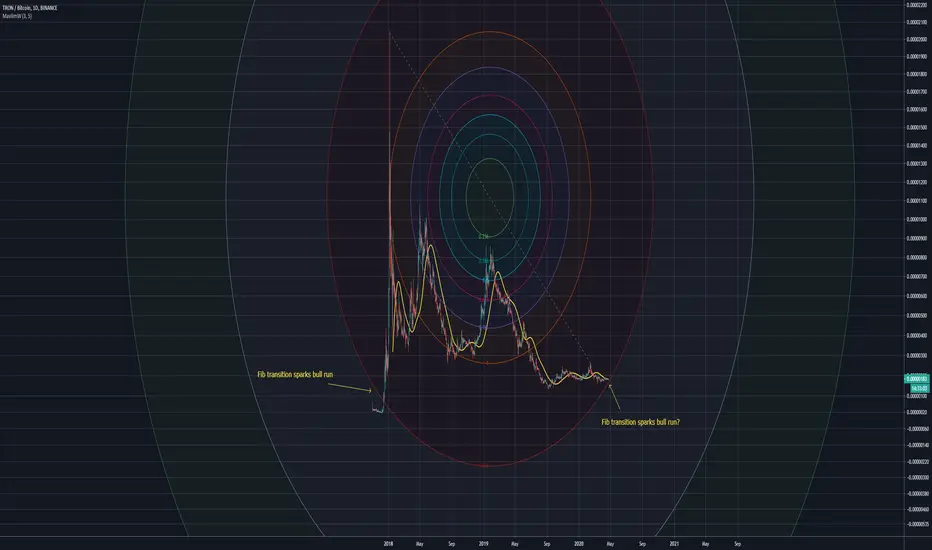
TRON Large Falling WedgeLarge falling wedge formation on TRON, price action can be seen to be mirroring the 1.618 fib ring upon re-entry, price may continue up to the downward trendline before a pullback occurs.

Buttcorn V Sh*tcoin. WEN MOON.Hi all,
I have noticed that the three wick low's of the last accumulation zone seems to be practically half the bars (days) to each of the three wick lows in this accumulation zone.
If this plays out, then we will be walking on the moon.
It is a Sh*tcoin, but... Shitcoins do PAMPPUU.
Thanks for reading,
GK

TRON/USD - exit from the triangle upwards. idea continuation:
The upward channel is being held.
Ema at 4 o'clock timeframe confirms growth intent.
The triangle may help break through the resistance.
The trend channel, EMA, round number 0.013$ is supported.
Buying under resistance is stupid. But if you look at the chart and indicators as a whole, you should buy.

TRON Above .236TRON is showing some bullish signs, like many major alt coins. 4H chart.
Alligator is eating bullishly, (jaw lips and teeth are separated)
Sitting above the .236 fib line from retracement from last top
Trading preciously along 1/1 Gann line, I expect a movement into the 1/2 area.

TRXUSD: Climbing higherTRXUSD looks pretty decent.
Flip S / R and now preparing to assault 0.016 BTC resistance zone.
I'm long here using a wide stop ('coz I'm always caution with alts and their dreadful swings), R:R ratio is 1:2, not bad.
At resistance, shorts looks more rewardable, invalidation - close above $3 at 4h / 1d timeframe.
Information is just for educational purposes, never financial advice. Always do your own research.

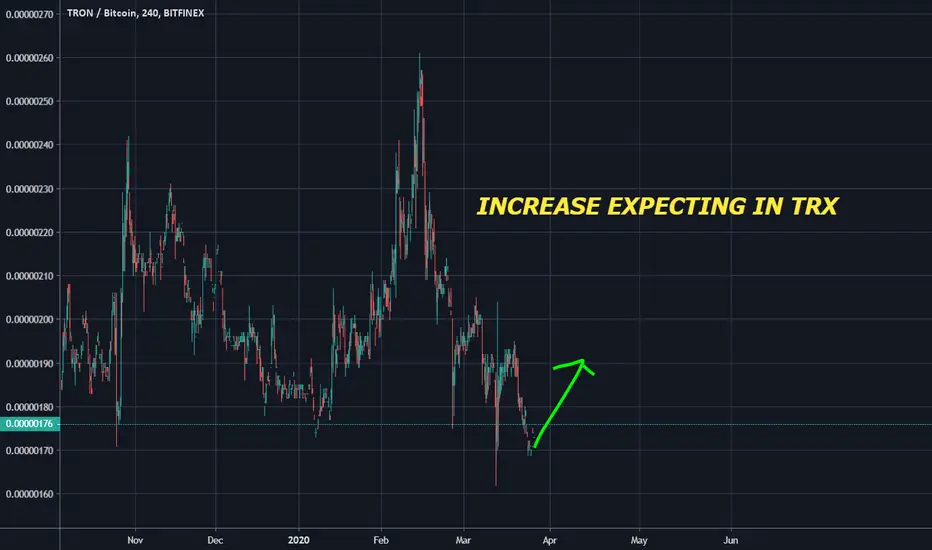
TRON (TRX) ARE ABOUT TO INCREASE TO NEW HIGH LEVELdepens on my trend study, expect TRX INCREASE IN THE NEXT TIME.
This depens on volume and trend data.
# for private signals contact me.
You Should See These Bullish Signals Of Tron (TRX) BreakoutA big descending triangle move:
Since November 2018 the price line of phone is moving within a descending triangle. On weekly chart after the recent strong bearish trend the price line of TRX is again reached at the support of this triangle. And now we have third candlestick that is hitting at the support. The first candlestick that has touched the support of this triangle was very long strong bearish and it has even crossed beyond the support of the triangle but in very next candlestick the price action is retraced back and now Tron is above this support again.
I have also placed the volume profile on the complete price action moving within this triangle. And we can see that the trader’s interest is very low near the support level and even the point of control of this volume profile is $0.0246. Therefore we can expect the move up to the point of control soon.
Priceline did not breakdown the short term daily chart support:
In my previous post that I posted on 8th march 2020 I was expecting that the price action will hit at the support of $0.0127. This is short term daily chart support for Tron. And now we can see that the price action is hitting at this support and so far we don't have even a single candlestick that has been closed below the support level therefore this short term support is still valid.
A bullish Shark is still in play:
In September 2019 I posted an article where I have revealed that the price action of Tron had formed a complete bullish Shark pattern. The formation of this pattern was started on November 2018 and completed on September 2019. Its mean when I posted this article then the price action just had completed this pattern. And in the month of February 2020 the priceline turned bullish and produced more than 114% profit and in very next candlestick the price line dropped down in the PRZ level again.
In case of bullish rally what should be the sell targets:
Now we have to two chart patterns one is the big descending triangle on weekly chart and other one is a very big bullish Shark pattern that is still in play therefore we can set our cell targets according to both patterns. Therefore now we have two types of cell targets.
1. Sell targets according to descending triangle: If we place the Fibonacci retracement tool from the tail of the triangle upto the support of the triangle then we receive the Fibonacci projection area between 0.382 to 0.786 Fib level at $0.0216 to $0.0343. Therefore we can set this bracket as sell targets.
2. Sell targets according o bullish Shark: If we place the Fibonacci retracement tool from C to D leg then we receive the Fibonacci projection area between $0.020628 to $0.033906 this is very close to the targets as mentioned above.
Conclustion:
The Tron likely to failed breaking down the support therefore we can accept a break out or bullish rally from this level. But the support level of triangle where the TRX is moving at the moment is very critical and this support is a market structure for the Tron. If it will be broken down then the situation can be more disastrous therefore we should use the support of descending triangle as our stop loss.

TRXUSD extended the leg to form a bullish SharkIn my previous idea the C to D leg of Tron / Dollar was retraced between 0.618 to 0.786 Fibonacci and was likely to form bullish cypher as below:
But now the D leg is extended bit more upto 0.886 Fibonacci and forming a shark pattern.
Now the price action is entered in potential reversal zone.
I have used Fibonacci sequence to set the targets:
Buy between: 0.013921 to 0.007883
Sell between: 0.020572 to 0.033886
Regards,
Atif Akbar (moon333)

TRX looks ugly as usual I think i ofrgot to post this red level here on trading view. Was posted on twitter before the dump though
#TRX looking as #ugly as ever

TRON can continue to fall!I think we should wait for the price will fall more to the strong Support Level.
Now it's better to look for sell entry.
Thanks for your support!
You can ask your questions in the comments!

TRON / DOLLAR (TRXUSD) DailyDates in the future with the highest probability for price direction reversals

Tron formed bullish BAT and completed bullish setup for breakoutBear Move And Formation Of Wedge:
From Jun 2019 to Sep 2019 after taking more than 70% drop the world's 11th largest cryptocurrency Tron is moving in a falling wedge now, the formation of this chart pattern was started from Oct 15 2019 the in mean while the priceline of TRX has touched 5 times the support of this wedge and hitting 3rd time on the resistance of the wedge and the upper bands of the Bollinger bands as well, here we can expect the down move for price correction again maximum upto the support of this wedge or it may hit the support or lower bands of Bollinger bands and move up again and then it may take a powerful bullish divergence to have a powerful breakout.
Moving Averages:
On 17 Nov the exponential moving average with time period of 10 crossed down the exponential moving average 20 and formed the death cross which leaded the price action more than 36% down but now we can see on the same day chart the EMA 10 has crossed down priceline and lifting it up and likely to form golden cross with EMA 20 very soon.
Oscillators:
The moving average convergence divergence (MACD) gave strong bullish signals on 21 Dec 2019 with bull cross and Stochastic had already given bull cross before MACD on 18 Dec 2019 the reletive strength index (RSI) was also oversold up til 18 Dec 2019 and then turned bullish but now all indicators are turning weak bullish and they will be turned strong bullish soon when the price correction period will be ended and it can take time until the price action hits the wedge's support or lower bands of Bollinger bands and turns bullish again.
The Cloud Reversal:
On 1st Dec the Ichimoku cloud was turned bearish now it is turning bullish after 24 days, the conversion line has crossed up the base line and has given bull signals but sofar the lagging span is unable to cross up the priceline therefore this bullish cloud reversal is not 100% confirmed unless the lagging span does not cross up the price line we just need to wait and see once it will move beyond the price action upwards then this bullish cloud reversal will be confirmed.
The Harmonic Move:
If we see on 3 day chart then it can be clearly seen that the price action of Tron has formed a perfect bullish BAT pattern let have a look how perfect this pattern is formed:
After initial leg (X to A) the A to B leg is retraced between 0.382 to 0.50 Fibonacci and then B to C leg is projected between 0.382 to 0.886 of A to B Fibonacci projection and last leg (C to D) is retraced between 0.786 to 0.886 Fibonacci and now the price action is moving in potential reversal zone of this BAT pattern now we can expect bullish divergence at any time which will lead the priceline between 0.382 to 0.786 Fibonacci projection of A to D leg atleast, but if after this bullish divergence the candles sticks will be closed above the 0.786 Fibonacci projection then it can also lead to the long term bullish move.
However for mid term trade we can set our targets as below:
Buy between: $0.014140 to $0.013032
Sell between: $0.016840 to $0.020867
Regards,
Atif Akbar (moon333)

Tron (TRX) A Journey To Break Out Key Level Resistance $0.039Formation of BAT:
On September 2019 the price action of Tron started the formation of bullish BAT pattern this pattern was completed on December 2019.
After completion of BAT it was expected that TRX will take the bullish divergence from the potential reversals zone of this bullish BAT and it will soon enter in the Fibonacci projection area of A to D leg from 0.382 to. 0.786 Fibonacci level. Then on 4th January the TRX started moving up and first the priceline crossed up the 0.382 and then 0.786 Fibonacci projectionl. After crossing the 0.78 Fibonacci level it was expected that the priceline will use the 0.786 projection as a support and it will move up from here but unfortunately it has crossed down the 0.786 Fibonacci projection and again entered in the projection area between 0.382 0.786 level. Now the priceline is using 0.382 Fibonacci level as a support and now it is being consolidated at this level.
Simple moving averages are still in golden cross:
On daily chart the price action first crossed up the 100 simple moving average on 16th of January and retested this moving average as a support and moved up again and crossed up 200 SMA in the meanwhile both moving averages with the time period of 100 and 200 formed a bull cross on 1st March 2020. This golden cross was formed first time after the death cross of 9 September 2019. The movement of the priceline was powerful than the movement of the moving averages therefore the price line did not have the support of the moving averages with its movement and went very far away from SMAs therefore it was expected that soon the priceline will again drop on these moving averages and now we can see that the price line of TRX has dropped down and using 100 and 200 simple moving averages as support. Even tough we have seen a strong bearish trend from 16th of January up to 27th of February but these moving averages are still in golden cross that is very positive sign that these moving averages will not let the price action cross down and will provide strong support.
Formation of new harmonic pattern:
Now with the recent down trend the price action of Tron has completed another harmonic pattern and this time it has formed a bullish Shark pattern and entered in the potential reversal zone of this bullish Shark.
Let's dig this pattern deeper to see how perfect this pattern is formed.
After initial leg (X to A) the A to B leg is retraced between 0.382 to 0.618 Fibonacci and then B to C leg is projected between 1.13 to 1.618 of A to B leg's Fibonacci projection (here I have ignored some extra spike) and final (C to D) leg is retraced between 0.886 to 1.13 Fibonacci as required for perfect perfect bullish Shark pattern.
After the completion of this bullish Shark pattern we have another strong support of the potential reversal zone and now it will be difficult for the price action to break down the support of this PRZ level. Now from here it is expected that soon priceline will be entered in the Fibonacci projection of C to D leg from 0.382 to 0.786 Fibonacci level.
The push that the price action of Tron will have from this potential reversal zone can help the TRX to continue the bullish rally wich was started since Dec 2019.
Long term resistance and support:
On long term weekly chart we can see that Tron has strong support at $0.01277 and this support is not broken since November 2018. Now we can see recently TRX has formed a double bottom on this support and after the completion of double bottom it has hit the first resistance at $0.023 and this is also a very strong resistance because in the previous history of Tron it has been working as a support since Feb 2018. Once this resistance will be broken out then we can see that the price action move up to hit the next resistance level at $0.031 and after this resistance level we will have key level resistance at $0.039. Once this key level resistance will be broken out then the TRX can become more strong bullish to achieve the higher price ever in the history of the Tron.
But if the priceline will breakdown the 200 simple moving average the it can move back to previous support level to retest it.
But if the priceline will breakdown the 200 simple moving average the it can move back to previous support level to retest it. I will keep posting more updates on Tron.

TRON/USD, The price can move up!We have Mirror Level, which can reflect the price and it may start to increase.
The best Buy Zone is under the arrow.
Wait that the price will reach 0.020003.
I hope you like my forecast.
I need and wait for your comments and likes!

Technical Alert : TRON/USDT at EMA50Daily chart:TRON/USDT at EMA50.
0.1820/0.1710 Fib support zone.
Disclaimer:
We are not registered or licensed in any jurisdiction whatsoever to provide investing advice or anything of an advisory or consultancy nature,
and are therefore are unqualified to give investment recommendations.
Always do your own research and consult with a licensed investment professional before investing.
This communication is never to be used as the basis of making investment decisions, and it is for entertainment purposes only.

TRX/BTC IdeaWe are currently retesting after breaking out of a descending triangle. If we can hold this 200 support area then i expect to push towards the upside.

TRX +80 % Cup and handleWe already had 3 cases of Cup and handle before but only two that worked very well.
You can see on the graph the conditions for it to work.
At this price I sell all TRX after buying for 0.013. It made me a gain of 70%. Now I'm going to buy at 0.0185 a little closer for a gain of over 80%.
Risk 8% for target 80%
Ratio: 10

ETH IS JUST GETTING STARTEDIgnore the fud, people saying we need a large pullback. We have had 2 daily closes over the weekly resistance. We might wick below but I believe we are at the start of a bullrun. Weekly close will paint a better picture. Oh and lets not forget I gave signal at the black level.

TRXUSD Bullish case, longs on pullback, very busllishHi Traders
pls check details watching the video
Good Luck
