#TRU/USDT Forming Falling Wedge ?#TRU
The price is moving in a descending channel on the 1-hour timeframe. It has reached the lower boundary and is heading towards breaking above it, with a retest of the upper boundary expected.
We have a downtrend on the RSI indicator, which has reached near the lower boundary, and an upward rebound is expected.
There is a key support zone in green at 0.0100. The price has bounced from this level multiple times and is expected to bounce again.
We have a trend towards consolidation above the 100-period moving average, as we are moving close to it, which supports the upward movement.
Entry price: 0.0105
First target: 0.0109
Second target: 0.0116
Third target: 0.0123
Don't forget a simple principle: money management.
Place your stop-loss below the support zone in green.
For any questions, please leave a comment.
Thank you.
Trust

#TRUST Bottom is likely in #TRUST Bottom is likely in 📈
✅Inverse Head & Shoulder spotted
✅Falling wedge breakout & retest
✅Double bottom
Momentum & trend is shifting on my lines!
Pump potential: 20%+ 📈
SWING Setup valid above yellow zone.
(double bottom also TBC)

TRUST Update📊 TRUST Update
TRUST is testing the red resistance zone 🔴
If it breaks out above, it could confirm a bullish setup 📈
The first target would be the green line level 🟢

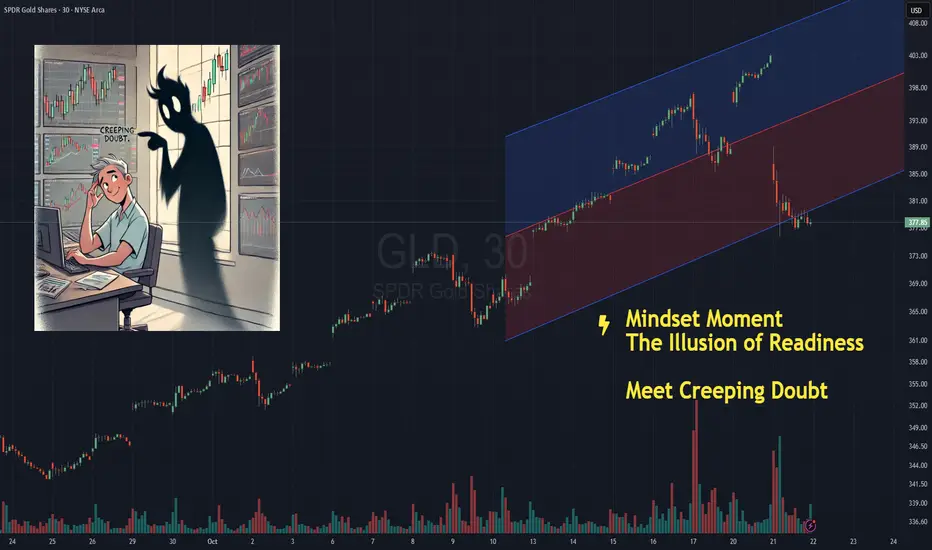
The Illusion of Readiness - Creeping DoubtNOTE – This is a post on mindset and emotion. It is not a trade idea or strategy designed to make you money. My intention is to help you preserve your capital, energy, and focus - so you can trade your own system with calm and confidence.
You know that feeling before you click buy or sell .
You pause…
You check your levels again.
Re-measure your stop.
Recalculate your size.
Zoom in, zoom out.
Add one more confirmation just to be sure.
You tell yourself it’s discipline.
That you’re waiting for the “perfect” setup.
But there's no denying it…
You can feel it
Creeping doubt entering your trading room
Listen. The truth is you already know your plan.
You’ve tested it.
You’ve seen it work.
You are ready.
But your mind doesn’t trust that yet.
So it creates the illusion of readiness
a loop of micro-adjustments and checks that feel productive…
when really, they keep you safely on the sidelines.
It’s control in its most subtle form.
A way of saying,
“I’ll act when I feel completely certain.”
Except in trading that feeling never comes.
Every tweak strengthens the belief that you’re not ready.
Every delay tells your system,
“Not yet… not safe.”
The work isn’t in waiting for confidence.
It’s in acting through the uncertainty
and building trust in motion.
Next time you find yourself double-checking for the fifth time, pause and ask:
“Who is in the driving seat here?”
Take a deep steadying breath and then follow your plan.
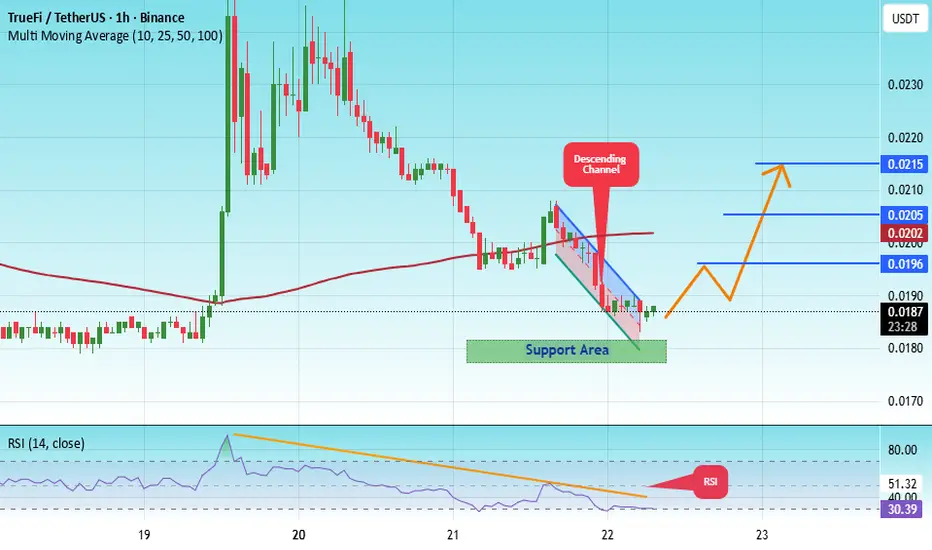
#TRU/USDT Forming Falling Wedge ?#TRU
The price is moving within a descending channel on the 1-hour frame, adhering well to it, and is heading for a strong breakout and retest.
We have a bearish trend on the RSI indicator that is about to be broken and retested, which supports the upward breakout.
There is a major support area in green at 0.0178, representing a strong support point.
We are heading for consolidation above the 100 moving average.
Entry price: 0.0186
First target: 0.0196
Second target: 0.0205
Third target: 0.0215
Don't forget a simple matter: capital management.
When you reach the first target, save some money and then change your stop-loss order to an entry order.
For inquiries, please leave a comment.
Thank you.
The Tension Between Trust and ControlNOTE – This is a post on mindset and emotion . It is not a trade idea or system designed to make you money. My aim is to help you protect your capital, energy, and composure, so you can trade your own system with clarity and confidence. This is a shorter post than normal with a challenge embedded. If you choose to follow, let me know how you get on.
Imagine the scenario
BTCUSD - you’re in.
The trade has moved your way and you KNOW you ought to trail
Afterall...
You’ve built the system and you have rules to follow
You’ve tested them.
They have an edge. You know you ought to trust the edge
And yet… in the middle of a live trade, your hand drifts toward the mouse.
You want to tweak the stop.
Take profit early.
Do something .
You tell yourself it’s prudence.
But what’s really happening is a tug-of-war between trust and control .
Your system says: Stay put. Let it play out.
Your instinct says: Take it and run.
The more you interfere, the more you teach your brain one thing:
“I can’t trust myself.”
That interference doesn’t protect you.
It keeps you trapped in a loop of doubt and micromanagement
In reality, it erodes self-trust, trade by trade.
So here’s your challenge:
Sit through 30 trades, a statistically significant data set. Follow your rules with a position size that is big enough so you pay attention but not so big to cause you to interfere. Once you’ve entered - follow your rules to a T. No adjusting. No tinkering. By all means, makes notes in a journal.
When the urge to step in comes up for you, pause and ask:
💭 What emotion is this?
Notice it.
Name it.
Then let the system do its job, while you practice doing yours: staying disciplined.

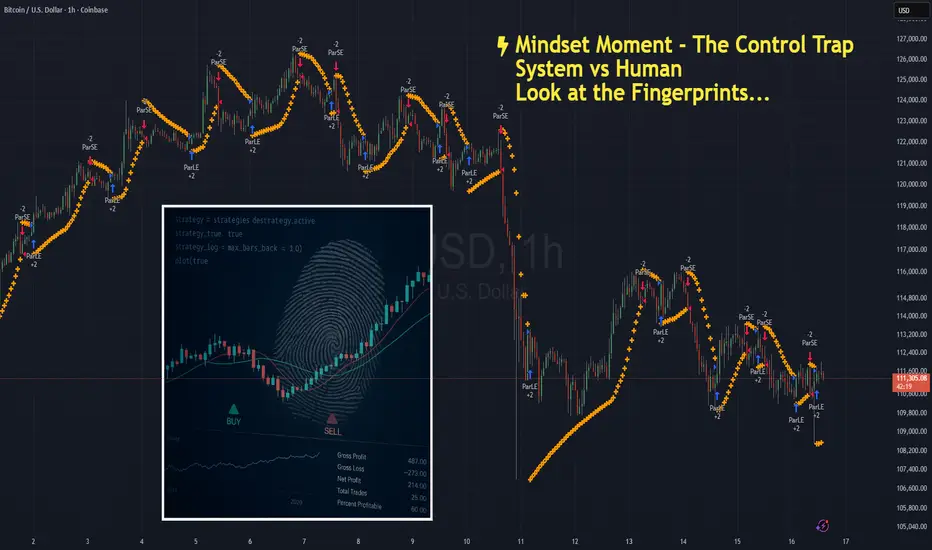
The Control TrapNOTE – This is a post on mindset and emotion. It is not a trade idea or strategy designed to make you money. My intention is to help you preserve your capital, focus, and composure so you can trade your own system with clarity and confidence.
You’ve spent months - maybe years designing your system.
You know its logic.
You’ve backtested the data.
You trust the probabilities.
And yet… mid-trade, something shifts.
The candles stall.
The pullback looks deeper than usual.
You feel the muscles in your stomach tighten.
Your hand hovers over the mouse.
Maybe I’ll just move the stop a bit tighter.
Maybe I’ll exit early, just this once.
Maybe I’ll skip this signal - it doesn’t look right today.
It feels like precision.
Like prudence.
Like control.
But look closer.
Every time you interfere, you reinforce the belief that you can’t trust yourself.
And that belief quietly eats away at your confidence - trade by trade, decision by decision.
What’s really happening:
When you second-guess your own rules, it’s rarely about the system.
It’s about safety.
Your mind is trying to avoid the discomfort of uncertainty - that raw, restless sensation that comes with surrendering control to probabilities.
Your body feels it first.
The quickened pulse.
The micro-tension in your shoulders.
The eyes darting to every tick, searching for reassurance.
You’re not refining your edge - you’re soothing anxiety.
The irony is that this constant adjustment creates the very instability you’re trying to avoid.
The more you step in, the more you teach your brain that it can’t be trusted to hold steady.
And so the cycle repeats - tighter control, lower trust, higher stress.
How to shift it:
Next time you feel the urge to tweak or touch the trade - pause.
Notice the emotion under the surface.
Is it fear? Doubt? A need to be right?
Let yourself feel that pull without acting on it.
Remind yourself:
“I built this system for a reason. My job now is to execute, not interfere.”
Try sitting through one trade, fully hands-off.
Let the outcome be what it is.
And observe what happens inside you, not just on the chart.
That awareness is where emotional control begins.
Trading well isn’t just about the quality of your system
It’s about the quality of your state while running it.
If this article resonated, check out the post I’d written on System Hopping. Link below:
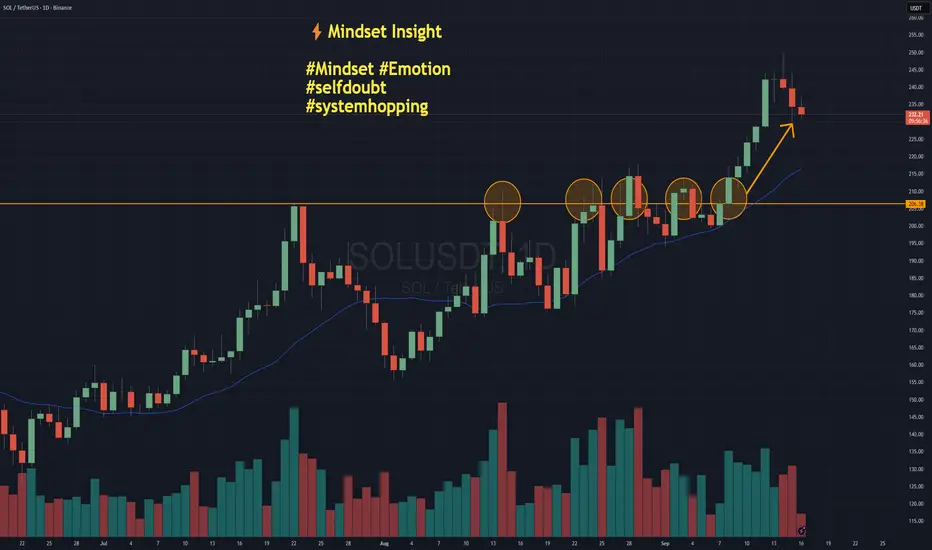
System Hopping - The Hidden Cost of Self-DoubtNOTE – This is a post on Mindset and emotion. It is NOT a Trade idea or strategy designed to make you money. If anything, I’m taking the time here to post as an effort to help you preserve your capital, energy and will so that you are able to execute your own trading system as best you can from a place of calm, patience and confidence.
Here’s a scenario:
You take a loss.
Then another.
Suddenly, the system you trusted yesterday feels broken today.
On this chart of Solana, imagine you were trading a breakout system. You may have had four false breaks that didn’t really follow through before the market finally broke higher. When do you give up on the idea or the system altogether?
How self-doubt shows up:
You start thinking: “Maybe another system would have worked better…”
You switch, tweak, reinvent mid-cycle.
You lose patience with the method you worked so hard to design.
You are in danger of system hopping.
Emotional side:
Self-doubt often disguises itself as “rational analysis,” but underneath it’s uncertainty, frustration, even a tightening in the chest. You hesitate to pull the trigger, second-guess your plan, or overcorrect with a brand-new approach.
It’s rarely your system that’s broken.
It’s the lack of trust in yourself to see it through.
Shift your mindset
Every system has drawdowns. If you abandon yours too soon, you never let it prove itself. So the task really is to find a way to collect the data without blowing out / over extending yourself.
Practical tips … the How:
Write down your system rules and keep them visible, so you trade what’s planned, not what you feel.
Track results over a proper sample size (50–100 trades) before judging performance.
Make sure you are position sizing sensibly. This is an art in and of itself. The key being - do not risk what you can not afford on any one trade / series of trades. Paper trade if you need to to start with just to collect the data on the system.
Journal emotions separately from trade outcomes — so you see when doubt is about you, not the system.
Set a “no system changes” rule during drawdowns. Only review at scheduled intervals.
Closing thought:
Your edge doesn’t come from finding the perfect system.
It comes from trusting a good one long enough to let it work.
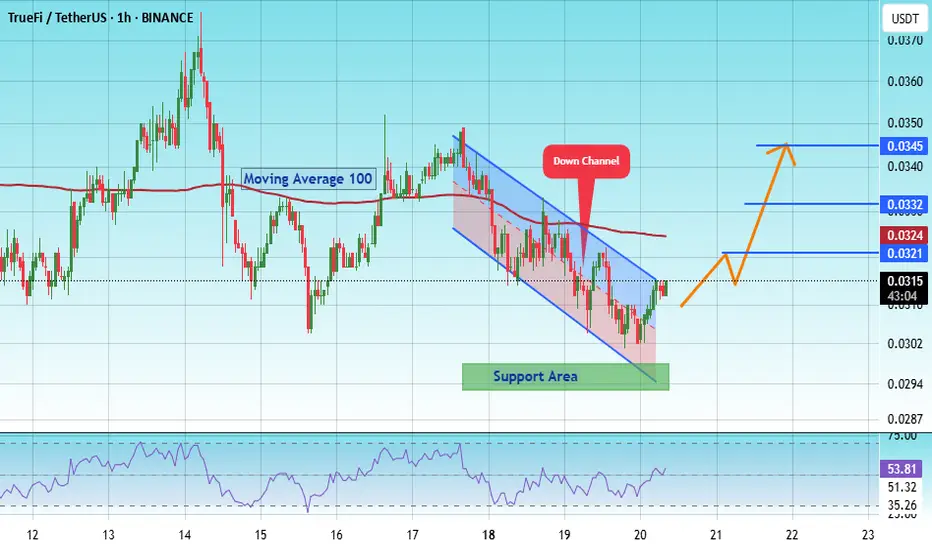
#TRU/USDT Forming Falling Wedge ? #TRU
The price is moving within an ascending channel on the 1-hour frame, adhering well to it, and is on track to break it strongly upwards and retest it.
We have support from the lower boundary of the ascending channel, at 0.0295.
We have a downtrend on the RSI indicator that is about to break and retest, supporting the upside.
There is a major support area (in green) at 0.0298, which represents a strong basis for the upside.
Don't forget a simple thing: ease and capital.
When you reach the first target, save some money and then change your stop-loss order to an entry order.
For inquiries, please leave a comment.
We have a trend to hold above the 100 Moving Average.
Entry price: 0.0314.
First target: 0.0321.
Second target: 0.0332.
Third target: 0.0345.
Don't forget a simple thing: ease and capital.
When you reach your first target, save some money and then change your stop-loss order to an entry order.
For inquiries, please leave a comment.
Thank you.
TWT ( trust wallet token)Twt usdt daily analysis
Time frame daily
Risk rewards ratio >3 👈👌
Target 1.13$
Twt is one of the good tokens in market
But trust wallet team are not very active. I hope trust wallet team find new way to extend their goals.
I can help them if they want 😏 😌

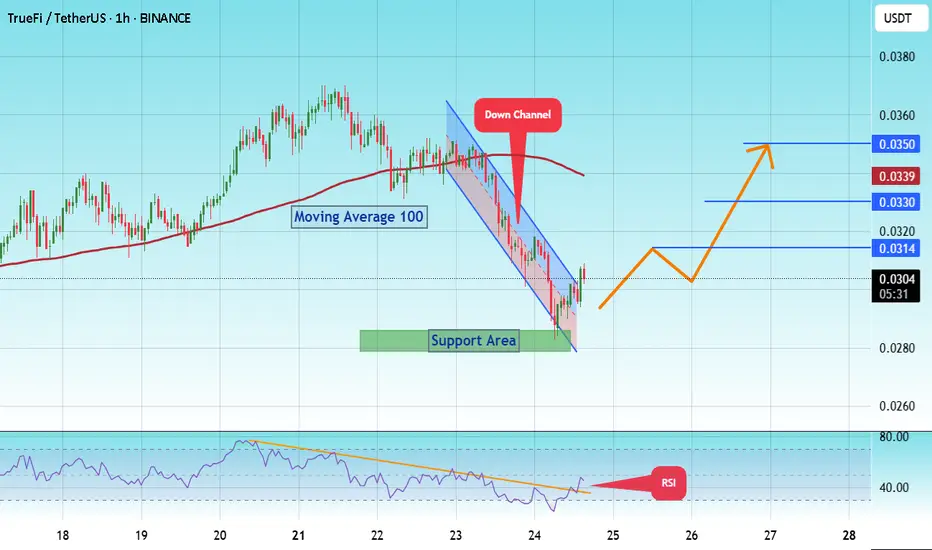
#TRU/USDT Low Risk vs High Rewards#TRU
The price is moving within a descending channel on the 1-hour frame and is expected to break and continue upward.
We have a trend to stabilize above the 100 moving average once again.
We have a downtrend on the RSI indicator that supports the upward break.
We have a support area at the lower limit of the channel at 0.0285, acting as strong support from which the price can rebound.
We have a major support area in green that pushed the price upward at 0.0280.
Entry price: 0.0300
First target: 0.0314
Second target: 0.0328
Third target: 0.0350
To manage risk, don't forget stop loss and capital management.
When you reach the first target, save some profits and then change the stop order to an entry order.
For inquiries, please comment.
Thank you.
#TRU/USDT#TRU
The price is moving in a descending channel on the 1-hour frame and is adhering to it well and is heading to break it strongly upwards and retest it
We have a bounce from the lower limit of the descending channel, this support is at a price of 0.0350
We have a downtrend on the RSI indicator that is about to break and retest, which supports the rise
We have a trend to stabilize above the moving average 100
Entry price 0.0438
First target 0.0511
Second target 0.0553
Third target 00630

#TRU/USDT Ready to go higher#TRU
The price is moving in a descending channel on the 30-minute frame and sticking to it well
We have a bounce from the lower limit of the descending channel, this support is at 0.0780
We have a downtrend on the RSI indicator that is about to be broken, which supports the rise
We have a trend to stabilize above the moving average 100
Entry price 0.0795
First target 0.0810
Second target 0.0836
Third target 0.0863

Trust Stamp ($IDAI): Strategic Developments Signal Potential UpsI spend time researching and finding the best entries and setups, so make sure to boost and follow for more.
Trade Setup:
- Entry Price: $6.71
- **Stop-Loss:** $5.03
- **Take-Profit Targets:**
- **TP1:** $18.83
- **TP2:** $34.58
Company Overview:
Trust Stamp ( NASDAQ:IDAI ) is a global provider of AI-powered identity solutions, specializing in biometric and cryptographic technologies for secure identity verification across various sectors, including finance, government, and healthcare.
Recent Developments:
- Strategic Partnership: On January 6, 2025, Trust Stamp announced a strategic transaction with Qenta Inc., resulting in a 10% ownership stake in QID Technologies LLC, a newly formed subsidiary. This partnership is projected to generate up to $4.3 million in revenue receipts in 2025, enhancing Trust Stamp's market position and revenue streams.
- Reverse Stock Split: Effective January 6, 2025, Trust Stamp implemented a 1-for-15 reverse stock split to meet NASDAQ's minimum bid price requirement. This move is expected to attract institutional investors by stabilizing the stock price and reducing volatility.
Technical Analysis:
- Current Price: $7.42
- Support Levels: Immediate support at $6.50, aligning closely with the activated entry price of $6.71.
- Resistance Levels: Initial resistance at $10.00, with significant resistance near TP1 at $18.83.
- Moving Averages: The 50-day EMA is trending upwards, indicating positive momentum.
- Relative Strength Index (RSI): Currently at 65, suggesting moderate bullish momentum with room for further upside.
Market Sentiment:
The recent strategic partnership and corporate restructuring have positively influenced market sentiment, with increased trading volumes and investor interest.
Risk Management:
The stop-loss at $5.03 limits downside risk to approximately 25% from the entry point. TP1 offers a potential gain of 180%, while TP2 presents an opportunity for a 415% return, indicating a favourable risk-to-reward ratio for this trade setup.
Conclusion:
Trust Stamp’s innovative identity solutions and recent partnerships position it for significant growth.
Awaiting a pullback to $6.71 for an optimal entry point into this promising trade setup.
Strict adherence to stop-loss and take-profit levels is essential to managing risk and volatility.
When the Market’s Call, We Stand Tall. Bull or Bear, We’ll Brave It All!

TRUST - Much more high to put in yetTRUST looks like a great coin that has a really nice strong, positive trajectory ahead. It's strength looks like its coming from a very strong, solid foundation from Elliot Waves with the first impulse of higher degree of trend 1 being put in. The long, slow, churn we've seen of late is very typical of an Elliot wave 4. So, it we can see a higher high that will give us confirmation that we're on the road to complete wave 5 of 1, which by all accounts is likely to match the distance travelled of 1. Good luck and follow for more.

#TRU/USDT#TRU
The price is moving in a descending channel on a 30-minute frame and is expected to continue upwards
We have a trend to stabilize above the moving average 100 again
We have a descending trend on the RSI indicator that supports the rise by breaking it upwards
We have a support area at the lower limit of the channel at a price of 0.1200
Entry price 0.1200
First target 0.1250
Second target 0.1300
Third target 0.1370

#TRU/USDT#TRU
The price is moving within a bearish channel pattern on the 12-hour frame, which is a strong retracement pattern and was broken to the upside.
We have a bounce from a major support area in green at 0.0900
We have a tendency to stabilize above the Moving Average 100
We have a downtrend on the RSI indicator that supports the rise and gives greater momentum, and the price is based on it to rise after it was broken upward.
Entry price is 0.1250
The first target is 0.1800
The second target is 0.2100
The third goal is 0.2472

MPW Medical Properties Trust concerning float short of 34.96% Medical Properties Trust, a real estate investment trust specializing in acquiring and developing net-leased hospital properties since 2003, currently has a concerning float short of 34.96% as of June 20.
This high short interest signals significant bearish sentiment among investors.
For the first quarter of FY2024, MPW reported a stark decline in total revenue, dropping to $271.3 million from $350.2 million in the previous year. The company also faced a staggering net loss of $736 million, or $1.23 per share. This substantial loss was primarily due to $693 million in impairments related to the Steward Health Care System.
Adding to the company's woes, Prospect Medical Holdings, one of MPW's largest and struggling tenants, revealed it had received a subpoena last year from the Justice Department. This development further underscores the potential risks and challenges facing Medical Properties Trust.
I'm looking at purchasing the $3 strike price puts expiring on January 17, 2025, currently priced at $0.40.

#TRU\USDT#TRU
The price is moving in a descending channel on a 4-hour frame.
The price is moving within it and is adhering to it to a large extent.
We have a support area in green and bounced from it at the 0.0800 level.
We have a tendency to hold above moving average 100.
We have a downtrend on the RSI indicator that supports the rise and is about to break higher
Entry price is 0.1000
The first target is 0.1190
The second goal is 0.1377
the third goal is 0.1554

#TWT/BTC 12h (Binance) Falling wedge breakout and retestTrust Wallet Token pulled back to support and entered oversold territory in sats, looks like a great reward opportunity for a bounce towards 200MA daily.
⚡️⚡️ #TWT/BTC ⚡️⚡️
Exchanges: Binance
Signal Type: Regular (Long)
Amount: 9.2%
Current Price:
0.00002342
Entry Targets:
1) 0.00002335
Take-Profit Targets:
1) 0.00003096
Stop Targets:
1) 0.00002081
Published By: @Zblaba
$TWT BINANCE:TWTBTC #TrustWallet #BSC trustwallet.com
Risk/Reward= 1:3.0
Expected Profit= +32.6%
Possible Loss= -10.9%
Estimated Gaintime= 1 month

LTCN Litecoin Grayscale Trust LTCN is about ready to pop. The inverse head and shoulders measured move would bring it to around $10 then a small correction before a massive rally to $35 and beyond, all depending on what Litecoin does. I believe Litecoin will be thousands of dollars in the next bull run as its is one of the very few that are not securities and are commodities. If that happens and Litecoin goes parabolic to 2 3 4 $5000 dollars then the Litecoin Trust will explode. There could be a massive premium at that point to making one share of the trust cost $7000 or more. 1000x-2000x totally possible. Litecoin is poised for a massive rally I believe. Its going to outperform every single other crypto out there this next real run. Besides maybe your random dog coin that could go up 100000000% but as soon as someone cashes out $5 the price drops by 60%. But for real I think this is a good play.
This is definitely not financial advice, this is just what I think and my opinion. Do your own research and so what is best for you. Thank you.

🔥 TWT Huge Bullish Hedge Opportunity: Oversold SignalA couple of weeks ago I made an analysis on TWT where I discussed that TWT had likely more selling to come, but that there was a major support which could keep TWT from falling further.
At the moment, TWT is currently slightly bouncing from the diagonal support, as well as being severely oversold on the 3D timeframe.
Seeing that the overall direction is relatively bearish, this can be considered as a counter trend hedge trade. The trade has a massive risk-reward ratio of 41.4, which can lead to some amazing gains if the target is hit.
You could take earlier profits at 1.00 and 1.85 if you're more risk averse.

Ethereum Bulls to Target $2,100 on Easing Recession Fears Cryptocurrencies have also been seen by some investors as a speculative hedge against inflation and the Fed's plans to curb inflation could weigh on the broader cryptocurrency sector.
On Friday, ETH joined the broader crypto market in a bullish session, gaining 6.28% to end the day at $1,996.
US economic indicators and staking statistics supported an ETH return to $2,000.
However, the technical indicators remained bullish, signaling a return to $2,100.
BIAS SHORT- and MIDTERM BULLISH
Stong Supports 1594 D-POC AND 1034
NEXT WEEK IS IMPORTANT
A PULLBACK TO 1034 WITH LOW VOLUME MEANS THE BULLS
WILL DISTIBUTE THEIR POSITIONS AND MOBILIZE TO ATTACK THE BEARS VERY AGRESSIVELY
A PULL BACK WITH HIGH FAT THICK LONG VOLUME MEANS BEARS
GONNA TAKE FULL CONTROL OF THE MARKET AND SEND ETHEREUM TO THE DEEPEST LEVELS POSSIBLE
LOSING OF 1034 MEANS CRYSTAL CLEAR ABSOLUTE BEAISH TREND
ON THE SAME TIME THIS ZONE IS A LOW VOLUME AREA: IF VOLUME IS INCREASING IN THIS AREA AND THE BULLS DO NOT ANSWER AGGRESSIVELY AND QUICK, we will ceate a midtem sideways and consolidating area: WHAT DOES THAT MEAN?
WELL THE BULLS TRY TO TAKE PARTIAL POFITS OR COMPENSATE THEI LOSSES WHILE SELLERS AND BEARS WILL ACCUMULTAE MORE CAPITAL AND LIQUIDITY TO PRESS DOWN THE COIN
THEN 1034 WILL BECOME THE FIST BUT VERY STRONG RESISTANCE!
MY 8Q STRATGY: 6Qs ae bullish 2Qs neutral: bUT THE MOST IMPORTANT AND LAT CONFIRMATION IS BEARISH
I CALL THIS BULL/BEAR TRAP DESTROYER!!!
AND SEE YOURSELF THE PAST RESULTS!!!! AMAZING HUH?
WELL UNTIL THIS LAST CONFIRMATION IS RED I TRADE THE BEARISH SETUP: GOING SHOT NEAR OF THE HIGH
AND PUTTING A VERY TIGHT STOP AT AROUND 2180USD!
WHY?
BECAUSE THE 2093 THE CONFLUENCE WEDGE LINE IS VERY IMPORTANT TRIGGER
THAT ALMOST WORKS AS SUPPORT AND RESISTANCE!
BREAKING ABOVE 2096+ pullback and holding above this area+ High volume means BULLISH SET UP. Better: Use divergence if pullback
(SEEL PULLBACK SCENARIO in PINK)
You must have highe highs and higher lows and then take the move after the 2nd HH and HL
Stop. I give more rooms to trae and try to myake it very difficult for the maket to hit me.
You Stop. DEPENDS ON YOU RISK AVERSION ;CAPITAL SIZE;ACCOUNT SIZE;LOT SIZE
But I recommand ALWAYS TO WORK WITH STOPS !!!ALWAYS!!! AS PROTECTION YOUR CAPITAL IS THE MOST IMPORTANT LAW AND RULE OF SUCCESSFULL TRADING!!!! EVER!NEVER!
A mixed start to the day saw ETH slip to an early low of $1,876. Steering clear of the First Major Support Level (S1) at $1,858, ETH rallied to a late afternoon high of $2,000. ETH broke through the Major Resistance Levels to end the day at $1,996.
US Jobs Report Eased Recession Jitters but Leave Fed Rate Hikes Subdued
It was a busy Friday session for the global financial markets. The all-important US Jobs Report drew interest ahead of next week’s US CPI Report.
Nonfarm payrolls jumped by 253k in April versus a forecasted 180k increase. In March, nonfarm payrolls rose by 165k. Significantly, average hourly earnings were up 4.4% year-over-year versus 4.3% in March. Economists forecast average hourly earnings to increase by 4.2%.
As a result of the better-than-expected NFP number, the US unemployment rate fell from 3.5% to 3.4%. Economists forecast the unemployment rate to rise to 3.6%.
The Jobs Report eased recessionary fears, supporting riskier assets. However, market bets on a 25-basis point Fed interest rate hike in June remained subdued. According to the CME FedWatch Tool, the probability of a 25-basis point June interest rate hike rose from 0.0% to 8.5%. The Jobs Report did wipe out bets of a June rate cut, with the chances of a rate cut falling from 9.2% to 0.0%.
While the combination of easing recessionary fears and subdued bets of another Fed rate hike delivered support, sentiment could change on Wednesday. The US CPI Report has to show softer inflation to keep the Fed hawks silent.
