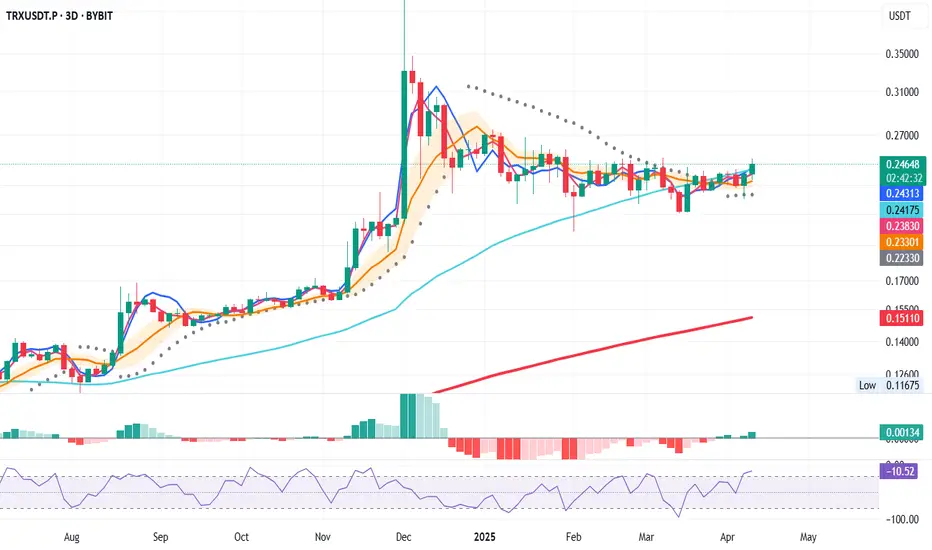
TRX/USDTThe coin has a macro bullish structure. After a correction, it’s been in accumulation for 127 days. Upside targets are 0.33–0.44
TRX

Tron Eternal Uptrend ContinuesThis is good news for the overall market. Tron continues to grow.
If we give a closer look to this chart, we can notice a rounded/cup pattern developing after the last correction and this is a strongly bullish development.
The action is moving above the base (blue line) of the pattern and this is what makes this chart structure super bullish.
Support was found also on the middle trendline of the long-term rising channel. The uptrend that has been present since November 2022.
TRXUSDT is set to continue growing long-term.
It is true that Tron is its own economy and has a real working product, or else the chart wouldn't look like this. A chart like this says that something positive is happening behind the scenes. All conditions for this trading pair and Cryptocurrency project continue to be green.
Namaste.

WELCOME TO THE BEGINNING OF ALT COIN SEASON!Traders, Hodlr's and Soon to be Liquidity (late retail buyers),
This is likely the moment we have been waiting for. Last week in our weekly VIP market update we discussed just a few things that would really show us if we just saw the bottom of the alts and if it was now time to start seeing some new local HH's and then HL's showing us a shift in trend. I had posted a few trades pointing this out. We have now at this point accomplished what we were looking for to see if we would be starting Alt coins season.
We have been watching a few things. The first being Bitcoin Dominance or CRYPTOCAP:BTC.D as this is a great chart to watch and look for reversals prior to looking at the chart of the specific alt coin against BTC to see if it also is showing it could have a rally or a pullback based on your bias on this BTC.D chart. For instance if I were to want to see maybe when XRP would likely start breaking out say that this BTC.D chart is in fact correct and the triangle trend line will end up being the top for btc dominance at around 64.4% of the total market I would go to BITSTAMP:XRPBTC to give myself some insight on confluence of market movements.
Being that we are now here at the point that I believe we will start to see money flow into alts based on this chart and others such as CRYPTOCAP:TOTAL2 , CRYPTOCAP:TOTAL3 and CRYPTOCAP:TOTALDEFI and the specific BTC pairings that I am holding by looking up the ticker of my alt coin/BTC and studying that chart I will honestly say that I am in the 90%/10% bullish on alts to bearish.
I hope this information helped you in your journey to get more information and come up with your own analysis to base your investment decisions and you become prosperous for doing soo!
Stay Profitable Folks,
Savvy!

TRXUSDT TRXUSDT Price Action Analysis (1H Timeframe)
🔹 Overall Trend: After a strong rally, the price is in a correction phase, currently trading at 0.2291. The key resistance at 0.2300 must be broken for a bullish continuation.
🔹 Bullish Scenario:
A breakout above 0.2300 with confirmation could push the price towards 0.2345 and 0.2435.
If this happens, the bearish structure will be invalidated, increasing bullish momentum.
🔹 Bearish Scenario:
Failure to break 0.2300 may lead to a pullback towards 0.2250 and 0.2205.
Losing 0.2205 could open the way for a deeper drop to 0.2160, a critical support zone.
🎯 Conclusion: Watch key levels closely; a confirmed breakout above 0.2300 signals a buy opportunity, while losing 0.2250 strengthens the bearish outlook.

ALTCOINS | ALTSeason | Buy Zones PART 3⚜TRX
TRX has been really strong over the past few days, continuously making higher lows which is early signs of a bullish sentiment. Though, I would want to see the price hold the highlighted support zones before making any decisions. A close UNDER would likely lead to a lower drop.
In that case, I'd be willing to buy at 0,22:
⚜GRT
GRT I'd be looking to buy very low, between the two following prices:
⚜RNDR
Render has bounced from the first buy-zone, but it seems likely we'll retest again soon since the bounce did not equate to a reversal:
⚜MAKER
Optimistic longer term on this coin. Strong decline, lower buy likely here:
⚜AAVE
Strong short-term bearish sentiment, weighted heavier towards the lower zone:
Make sure you don't miss part 1 and part 2 !!

TRXUSDT – Bullish System Trigger (3D Chart)
📅 April 13, 2025
Today’s 3D bar close offers a strong bullish signal, aligning multiple system indicators in favor of a long entry.
Here’s what the system confirms:
✅ Price closed above the 50 MA – bullish structure
✅ MLR > SMA > BB Center – solid confluence
✅ Price > PSAR – trend shift confirmed
✅ Above the 200 MA – long-term trend support
Entry Strategy
- Open long at the 3D bar close
- Stop-loss below the latest PSAR dot for system integrity
📌 Note: This is a system-based entry — not a prediction.
Be careful with TRX !!!As you can see, the price has now formed an ascending wedge , which is promising. The price could rise to $0.27 after breaking this wedge...
Give me some energy !!
✨We spend hours finding potential opportunities and writing useful ideas, we would be happy if you support us.
Best regards CobraVanguard.💚
_ _ _ _ __ _ _ _ _ _ _ _ _ _ _ _ _ _ _ _ _ _ _ _ _ _ _ _ _ _ _ _
✅Thank you, and for more ideas, hit ❤️Like❤️ and 🌟Follow🌟!
⚠️Things can change...
The markets are always changing and even with all these signals, the market changes tend to be strong and fast!!

Liquidity Grab Ahead? Why TRX (Tron) May Retrace Soon TRX (Tron) is currently trading near a significant resistance zone, aligning with the upper boundary of a descending channel on the 4-hour timeframe 📉. This area is likely to hold liquidity in the form of buy stops resting above the previous range highs. Given the broader downtrend and the strong resistance overhead, the price may retrace as it taps into this liquidity pool.
This setup presents a compelling short opportunity, with the expectation that TRX will reject this level and move lower, targeting support zones below. Traders should remain cautious and monitor price action closely for confirmation before entering a position ⚠️.
Disclaimer: This analysis is for informational purposes only and does not constitute financial advice. Cryptocurrency trading involves significant risk, and you should consult with a financial advisor before making any investment decisions. Always trade responsibly! 🚨

TRXUSDT 1D LONG [UPdate]In line with the expectations I outlined in my main TRXUSDT 1D LONG review the price interacted perfectly with the key liquidity block and turned around confidently.
To feel safe in this position, I move the stop order to breakeven and continue to wait for my targets to be reached!
Targets:
$0.2509
$0.2580
$0.2679
$0.2815

TRX bullish soon!CRYPTOCAP:TRX -@trondao
TRON is dedicated to building the infrastructure for a decentralized internet. 🌐
#TRX is currently rejecting a strong demand zone marked in blue.
For the bulls to take over and initiate the next upward impulse phase, a break above the last major high marked in green at $0.252 is needed.🚀

Trading opportunity for TRXUSDTBased on technical factors there is a Buy position in :
📊 TRXUSDT
🔵 Buy Now
🪫Stop loss 0.1850
🔋Target 0.3200
📏 R/R 2
💸RISK : 1%
We hope it is profitable for you ❤️
Please support our activity with your likes👍 and comments📝

TRXUSDT 1D LONGStudying the market, I have not traded much lately. Daily manipulation, as daily news very often breaks formations and trends within the day.
Therefore, I decided to look at 1D TF and I really liked the situation with TRX
Most likely, the price is in the final stage of reaccumulation before aggressive growth.
I am waiting for the testing of the bullish POI to start looking for an entry point into the position and work out such targets:
$0.2509
$0.2580
$0.2679
$0.2815
Risk for stop order -1%

TON the sell is not over. Keep in view $0.18TON the sell is not over. Keep in view $0.18
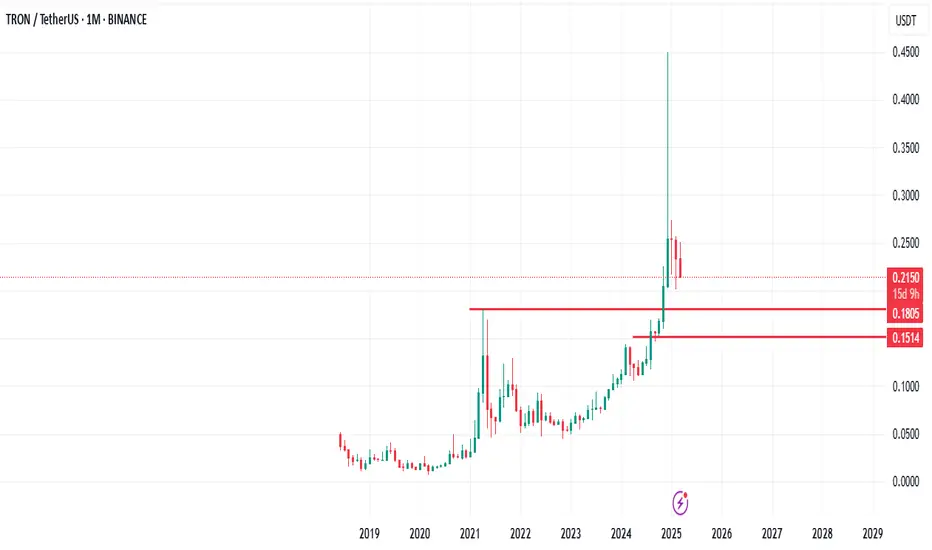
Have you bothered to look deep into TRX monthly chart?
I feel $0.18 is solid place for TRON to cool off its selling pressure long term.
I look forward to this shit happening for me to load my shopping cart
TRX - asset Punchingasset Punching a slant on a third touchdown.
the target after the breakthrough is the minimum (marked with a blue unit).
I suspect that bad news about this asset is coming.
if you like the idea, please "Like" it. This is the best "Thanks!" for the author 😊 P.S. Always do your own analysis before a trade. Put a stop loss. Fix profits in installments. Withdraw profits in fiat and please yourself and your friends.


Will Tron Correct 11% and Hit $0.20 Strong Support?Hello and greetings to all the crypto enthusiasts, ✌
Let’s dive into a full analysis of the upcoming price potential for Tron 🔍📈.
Tron is positioned within a parallel channel, nearing a key resistance level. Given its relative strength in the current market compared to other altcoins, I foresee a potential correction of up to 11%. This could lead the price to $0.20, a significant psychological support zone with strong technical backing.📚🙌
🧨 Our team's main opinion is:🧨
Tron is approaching key resistance, with an 11% drop likely to $0.20 support.📚🎇
Give me some energy !!
✨We invest hours crafting valuable ideas, and your support means everything—feel free to ask questions in the comments! 😊💬
Cheers, Mad Whale. 🐋

TRXUSD Another 2 months of consolidation is possible.Last time we looked at TRON (TRXUSD) was almost 6 months ago (September 25 2024, see chart below) when we called for a 1D MA50 (blue trend-line) buy:
The immediate rally that followed, hit our 0.2100 Target in less than 2 months, even breaking above the long-term Channel Up. Since then, the Bullish Leg deflated and settled sideways on a trade within the 1D MA50 (blue trend-line) and 1D MA200 (orange trend-line).
This is an Accumulation Phase and on the current 2023 - 2025 Bull Cycle, it is not the first time we've seen one. In fact the Higher Lows Zone had such phases since its start but the most notable and most similar to the current one is the one between March - August 2024.
Always supported by the 1W MA50 (red trend-line), this Accumulation Phase displayed the same kind of 1D MACD Bullish Divergence and once it formed its first Higher Highs trend-line and rebounded on the 1D MA200, it entered the Parabolic Rally Phase.
If the symmetry holds, then we might see TRX hit 0.6000 by September 2025.
-------------------------------------------------------------------------------
** Please LIKE 👍, FOLLOW ✅, SHARE 🙌 and COMMENT ✍ if you enjoy this idea! Also share your ideas and charts in the comments section below! This is best way to keep it relevant, support us, keep the content here free and allow the idea to reach as many people as possible. **
-------------------------------------------------------------------------------
💸💸💸💸💸💸
👇 👇 👇 👇 👇 👇

TRX at the Edge: Bounce or Break?TRX is trading at 0.2256, presenting a mixed picture with both bullish and bearish signals. The 50-period moving average (MA) is above the 200-period MA, pointing to a longer-term uptrend, but the price is currently below both MAs, reflecting recent weakness. The Relative Strength Index (RSI) sits at 45, which is neutral territory, while the Moving Average Convergence Divergence (MACD) shows a bearish crossover, suggesting potential downward pressure. Key support levels are at 0.221 and 0.2141, with resistance at 0.232 and 0.240. The price is nearing the support at 0.221, which could trigger a bounce if it holds firm. A break below might see it drop to 0.2141, whereas a push above 0.232 could target 0.240. If TRX lingers between 0.221 and 0.232, it might consolidate until a decisive breakout occurs.
Looking at the broader market, Bitcoin’s current mixed signals could impact TRX, as it often follows Bitcoin’s lead. However, Tron’s growing network activity and adoption might offer some independent support, potentially softening the blow from any market-wide pullbacks. Volume remains steady for now, but a noticeable increase could signal the next move, keep an eye out for a surge on either a bounce from support or a breakdown below it.
For trading: Set alerts at 0.221 and 0.232 to track potential reversals or breakouts. It’s smart to wait for confirmation, like a 4H candle closing outside these levels, before jumping in. Given the market’s volatility, use stop-losses to manage risk, and stay tuned to Bitcoin’s price action and any Tron-related news, as these could steer TRX’s next steps.

TRON is going to the MOON? TRX Weekly forecast & Trading IdeasMidterm forecast:
While the price is above the support 0.17000, resumption of uptrend is expected.
We make sure when the resistance at 0.27260 breaks.
If the support at 0.17000 is broken, the short-term forecast -resumption of uptrend- will be invalid.
Technical analysis:
A trough is formed in daily chart at 0.20100 on 02/03/2025, so more gains to resistance(s) 0.24740, 0.25800 and maximum to Major Resistance (0.27260) is expected.
Take Profits:
0.24740
0.25800
0.27260
0.30099
0.33299
0.45000
__________________________________________________________________
❤️ If you find this helpful and want more FREE forecasts in TradingView,
. . . . . . . . Hit the 'BOOST' button 👍
. . . . . . . . . . . Drop some feedback in the comments below! (e.g., What did you find most useful? How can we improve?)
🙏 Your support is appreciated!
Now, it's your turn!
Be sure to leave a comment; let us know how you see this opportunity and forecast.
Have a successful week,
ForecastCity Support Team

TRXUSD - Large Slanted W Pattern IdeaUsing the peak in the middle as the middle of the W pattern we can assume there will be a right hand side of the W implying the bulls are coming
I'm not sure how high it will go but 7 sounds interesting
I often see this pattern and believe we are still waiting for an alt season for these older coins
Daily timeframe

TRX/USDTAs part of the correction, work was done on liquidity and the complete filling of the weekly FVG. Growth targets:
Target 1 = 0.27
Target 2 = 0.32
Target 3 = 0.40

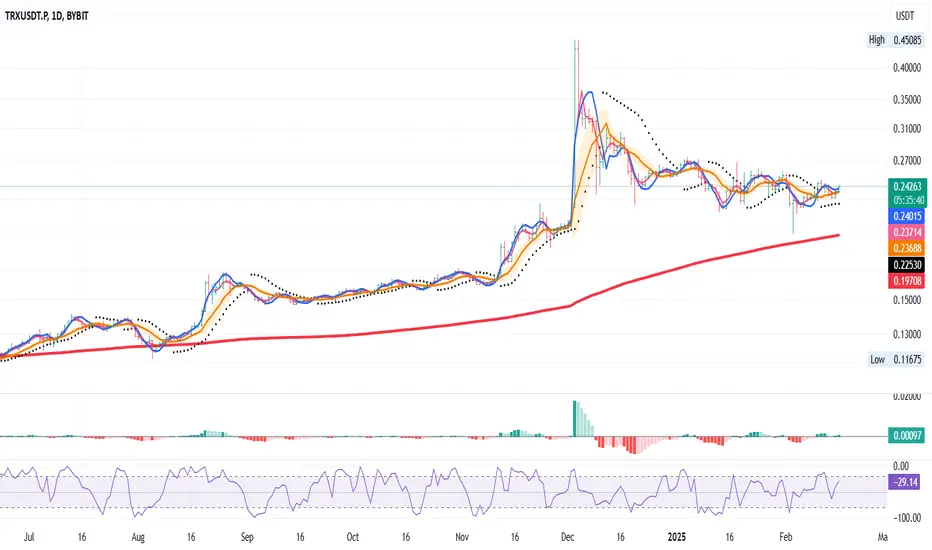
Long Entry Signal for TRX/USDT - Trading System Confirmation
Based on our custom trading system rules, we have a confirmed entry signal for TRX/USDT today:
MLR Crosses SMA: The Moving Regression Line (MLR) in blue has crossed above the Simple Moving Average (SMA) in pink, indicating a shift towards a bullish trend.
MLR Crosses BB Center Line: The MLR has also crossed over the Bollinger Bands Center Line in orange, further confirming the bullish momentum.
PSAR Flips: The Parabolic SAR (PSAR), shown by black dots, has flipped to green, signaling a bullish trend as it follows the MLR.
Price Above 200-period MA: The current price is above the 200-period Moving Average in red, confirming a long-term bullish trend.
Entry Strategy:
Action: Enter a long position on TRX/USDT based on these signals.
Risk Management:
Trailing Stop: Immediately set your trailing stop at the current PSAR level, which will adjust dynamically with price movements.
Standard Exit Strategy:
Exit: Monitor for when the MLR crosses back below the SMA. This crossover will signal a potential end to the bullish trend and an opportunity to exit the position.
This signal presents a potential trading opportunity according to our system's parameters. Remember, always consider additional analysis and risk management practices before making trading decisions.
That is it
Disclaimer: This idea is for educational purposes only and should not be considered financial advice. Always do your own research or consult with a financial advisor before trading.
trx next bull**TRX Next Bull: Riding the Wave of Innovation and Growth**
As one of the most dynamic cryptocurrencies in the digital asset space, **TRON (TRX)** continues to capture the attention of investors, developers, and blockchain enthusiasts worldwide. With its mission to decentralize the web and empower content creators, TRX is poised for its next bull run—a surge driven by technological advancements, strategic partnerships, and an ever-expanding ecosystem.
### Why TRX Could Be the Next Big Winner:
1. **Scalability and Speed**: TRON's high throughput and low transaction fees make it a preferred platform for decentralized applications (dApps), DeFi projects, and NFT marketplaces. Its ability to process thousands of transactions per second positions it as a leader in scalability.
2. **Growing Ecosystem**: From gaming and entertainment to finance and social media, TRX powers a diverse range of use cases. The rise of TRON-based dApps like BitTorrent, Sun Network, and JustLend showcases its versatility and adoption potential.
3. **Strategic Partnerships**: TRON has consistently forged alliances with global brands and institutions, enhancing its reach and credibility. These collaborations are instrumental in driving mainstream adoption and utility for TRX.
4. **Community Support**: Backed by a passionate and engaged community, TRX benefits from grassroots support that fuels innovation and adoption. This strong network effect amplifies its influence in the crypto sphere.
5. **Regulatory Clarity**: As regulatory frameworks around cryptocurrencies evolve, TRON's compliance-focused approach ensures it remains at the forefront of legitimacy and trust.
6. **Bullish Market Sentiment**: With increasing interest in blockchain technology and cryptocurrencies, TRX stands ready to capitalize on favorable market trends. Analysts predict renewed investor confidence could propel TRX to new heights.
### What to Watch For:
- **Upcoming Upgrades**: Keep an eye on TRON’s roadmap for enhancements such as improved consensus mechanisms or Layer-2 solutions.
- **Adoption Metrics**: Monitor user growth, transaction volumes, and dApp activity to gauge momentum.
- **Market Catalysts**: Major announcements, institutional investments, or integrations into real-world industries could ignite the next bullish phase.
The future looks bright for TRX as it cements its role in shaping the decentralized internet. Whether you're a seasoned investor or a newcomer exploring opportunities, TRX’s next bull run might just be the perfect time to join the revolution. Stay informed, stay agile, and get ready to ride the wave of innovation with TRON! 🚀
