$TRX Steady Support Hold – Breakout on Horizon?BINANCE:TRXUSDT CRYPTOCAP:TRX Steady Support Hold – Breakout on Horizon?
Current trend: TRX is consolidating post-pump, defending the 0.285 support zone after a clean rejection at 0.303 resistance—low volatility with bullish doji tails showing accumulation strength 🛡️.
Hold support? Affirmative; volume on greens and price stability confirm buyers in control, unlikely to breach without BTC dump.
Breakout above resistance? High setup if 0.303 flips—expect 4-6% pop to retest highs 🚀.
Dip risk? Minimal to 0.28, cushioned by 50 EMA confluence.
Target: Near-term 0.31 on confirm; longer 0.32 with volume.
Indicators monitoring: Stochastic (rising from oversold), EMA stack bullish, and OBV uptick 📊.
#TRXTrading #CryptoConsolidation #AltcoinPioneers
Trxusdt

$TRX Steady Support Hold, Breakout Setup Forming?BINANCE:TRXUSDT CRYPTOCAP:TRX Steady Support Hold, Breakout Setup Forming? 📊⚡
TRX's 1H trend leans bullish, firmly testing and bouncing off main support at ~0.292 amid decent volume—clear buyer defense!
Strong chance to maintain here, with breakout above 0.30 resistance eyeing 0.31 target next. Deeper dip risk low (monitor 0.29), but use tight stops.
Tracking RSI ~54 (neutral uptick), 20 EMA as dynamic support, and MACD histogram gaining steam.
TRX momentum building! 🚀
#TRX #CryptoTrading #AltcoinRise

$TRX Resistance Probe – Upside Break or Rejection?BINANCE:TRXUSDT CRYPTOCAP:TRX Resistance Probe – Upside Break or Rejection?
TRX's 1H showing steady bullish grind, tapping resistance at 0.294 after rebound from support ~0.288—breakout eyes 0.300 quick, but failure risks retrace to 0.285 on fading volume.
Solid uptrend persists.
Key indicators: RSI at 62 (bullish room), 50MA ascending, MACD positive. 🚀📊
#TRX #Tron #AltcoinPioneers

Tron/TRX on the Verge of a DropThe first expected level is the blue one, where breaking it makes the orange zones and the green trend line important, with a higher likelihood of reaction on the trend line. During the reaction for an upward move, if it hits the purple zone and lacks the strength to break it, there's a chance of continued decline. And when the price crosses the yellow zone, it signals that the uptrend is beginning. BINANCE:TRXUSDT

TRX's situation+ Target PredictionFinally, the price broke the wedge, and the price experienced a significant drop. I think is the time for TR to rise again to 0.73 after more correction . STRONG SUPPORT 0.26.
Previous analysis
Give me some energy !!
✨We spend hours finding potential opportunities and writing useful ideas, we would be happy if you support us.
Best regards CobraVanguard.💚
_ _ _ _ __ _ _ _ _ _ _ _ _ _ _ _ _ _ _ _ _ _ _ _ _ _ _ _ _ _ _ _
✅Thank you, and for more ideas, hit ❤️Like❤️ and 🌟Follow🌟!
⚠️Things can change...
The markets are always changing and even with all these signals, the market changes tend to

Will #TRXUSDT Slide Down Further or Recover? Must Watch Yello Paradisers! Are you actually watching what’s developing on #TRXUSDT? Because if you’re not, you could be caught completely off guard by this sneaky bearish setup unfolding right now. Let’s break down #TRON Setup:
💎#TRX has been trading inside a textbook Ascending Channel, but that structure is breaking down fast. After losing the ascending support, the price is now retesting it as resistance — and it’s not looking good for the bulls. Adding to the pressure? The 50 EMA, which is now acting as dynamic resistance, reinforces the potential for further downside.
💎Current price of #TRXUSD is $0.30, and this level is absolutely critical. If this rejection holds and we get a clean fail from this zone, the bearish scenario becomes highly probable. Momentum is already leaning bearish, and this breakdown could trigger a deeper flush.
💎If the rejection confirms and sellers take control, we could see price cascade down toward the Support Zone at $0.26, and if that level gives way, a much more aggressive drop into the Strong Demand Zone around $0.18 becomes likely — where bigger buyers might finally show up.
💎However, this bearish structure gets invalidated if #TRX can reclaim and close above the $0.3696 resistance. A breakout above that level would trap late bears and flip the narrative bullish, with room to squeeze higher toward the $0.42 region.
Trade smart, Paradisers. This setup will reward only the disciplined.
MyCryptoParadise
iFeel the success🌴

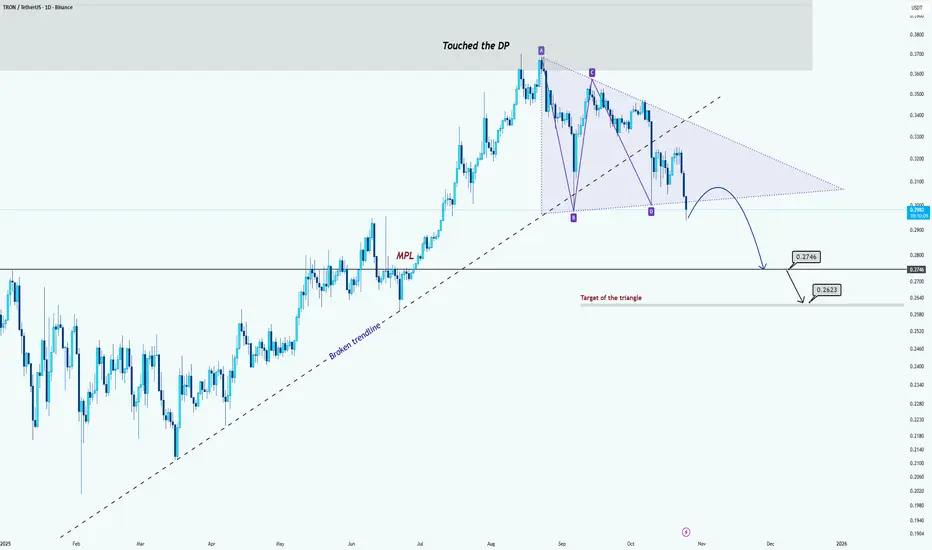
TRON Consolidating Before Potential Drop Toward 0.27–0.26 ZoneHi guys!
TRON touched the Decision Point (DP) and has been consolidating inside a descending triangle pattern. After the triangle’s support line was tested several times, the price broke below the broken ascending trendline, confirming weakness in bullish momentum.
Currently, the market seems to be forming a short-term correction before continuing its downward movement.
If this scenario plays out, the next potential bearish targets will be around 0.2746 and 0.2623, which also align with the target zone of the triangle pattern.
As long as TRX remains below the broken structure, the overall sentiment stays bearish. A daily close above the triangle’s upper boundary would be required to invalidate this setup and shift bias back to the upside.
Trx soon 10% gain toward 0.35$Hi the support and resistances on the chart are based on the previous data and weekly candlesticks if BINANCE:TRXUSDT holds this last support the potential of 10% gain is logical toward 0.35$

TRXUSD (daily)After the recent drop, price has retraced to the 0.382 Fibonacci level, forming what appears to be a wedge pattern. The PRZ (Potential Reversal Zone) also aligns with a strong support area for a potential bullish move. If price respects the pattern, there's room for upside. However, as always, this market tends to defy technical expectations.

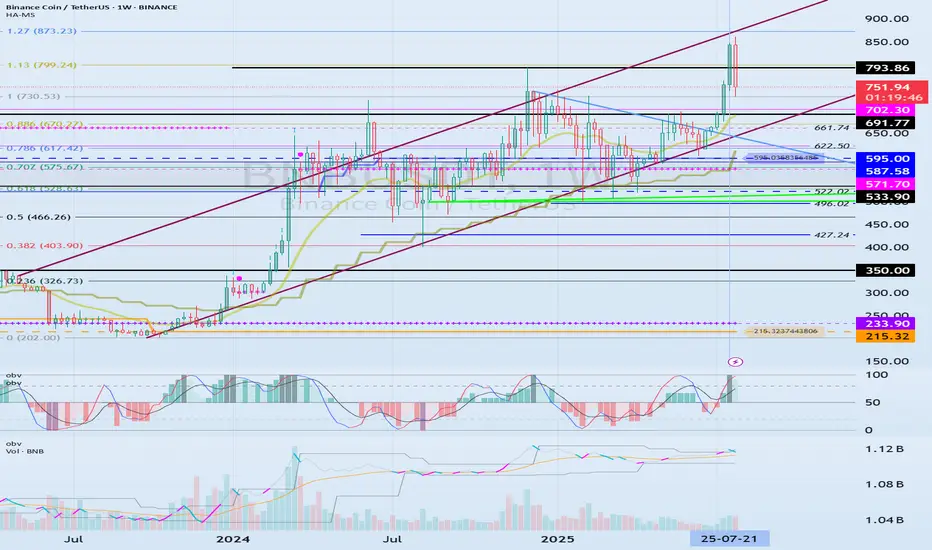
$TRX \ TRON
TRX maintained its 5.5-year rising trend line, breaking through the 2018 ATH level of 0.30 after 7.5 years and successfully retesting it.
Following the completion of the structural transformation with the major 2018 ATH major resistance line, which was previously broken and retested, it will begin its run after a short accumulation period.

TRON/USDT: Watching Head and Shoulders FormationHi guys!
I’m watching TRON/USDT on the 1-hour chart, and we’re nearing the end of a compression phase (highlighted in the chart). The price has been consolidating, and I believe a breakout could happen soon.
What stands out to me is the Head and Shoulders pattern forming . I’ve marked the Left Shoulder, Head, and Right Shoulder on the chart. If the price breaks the neckline, I’m expecting a bullish move to follow (around 0.3466 ).
I’m also keeping an eye on the descending trendline. If the price breaks above this trendline, it could strengthen the case for an upward move.
In short, if the price breaks the neckline and the trendline, I’m expecting a bullish move to around 0.3466. If these breaks happen, I’ll be watching for further upside potential.

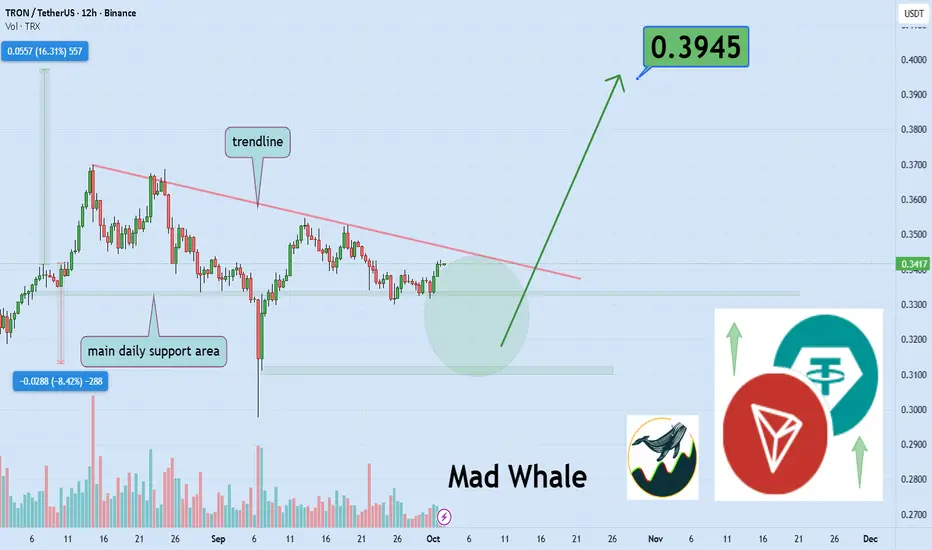
Traders watch TRX for 16% rebound to $0.3945Hello✌️
Let’s analyze Tron’s price action both technically and fundamentally 📈.
🔍Fundamental analysis:
TRON’s first perpetual DEX, hit $30M TVL as Proposal #789 cut network fees by 60%.
These moves could boost TRX demand across derivatives and micro-transactions, though risks remain.
📊Technical analysis:
BINANCE:TRXUSDT is testing a key daily support, with the daily trendline poised for a breakout; if confirmed, a potential 16% upside toward $0.3945 could unfold. 📈🚀
📈Using My Analysis to Open Your Position:
You can use my fundamental and technical insights along with the chart. The red and green arrows on the left help you set entry, take-profit, and stop-loss levels, serving as clear signals for your trades.⚡️ Also, please review the TradingView disclaimer carefully.🛡
✨We put love into every post!
Your support inspires us 💛 Drop a comment we’d love to hear from you! Thanks, Mad Whale
TRX/USDT – Long-Term Buying Opportunity?1. Quick Market Recap
Since the double top near 0.37 in mid-August, TRX has been under pressure. A strong spike down early September briefly shook the market, but buyers stepped in quickly, recovering the price back into the 0.35 zone.
However, momentum faded, and the coin started to roll back again.
2. Key Question
Is this pullback simply a healthy correction in a broader bullish trend, or the start of a deeper breakdown?
3. Why I Lean Toward a Buying Opportunity
• The overall trend remains bullish despite the correction.
• The quick recovery from the September spike showed strong buyer interest.
• Supports at 0.30 and 0.2750 align with attractive long-term accumulation zones.
4. Trading Plan
• If price breaks below 0.33, I will watch for a retest of the 0.30 support — a strong level that held earlier this month. For me, this is a medium to long-term entry opportunity.
• If the correction extends deeper toward 0.2750, I plan to DCA (dollar-cost average) into the position.
• My medium/long-term target remains 0.50, aligning with the bullish structure of TRX.
5. Final Note
Corrections in bullish markets are often where the best opportunities appear. TRX fits this pattern well, and in my opinion, it’s shaping up as a solid candidate for accumulation with a 0.50 target 🚀

TRXUSDT The chart BINANCE:TRXUSDT was deep spike but this is exit seller from game and entry again byers. We can buy in supports (0.3330 to 0.3450) but for hold in.
Please control risk management for your trades.

TRX: Justin Sun’s Play | September 08, 2025.Sergio Richi Premium ✅
CRYPTOCAP:TRX #Crypto #Tron 🪙 — TRX: Justin Sun’s Play | September 08, 2025.
Price (Sept 8, 2025) : $0.3323
Asset Overview:
Tron (TRX) is a high-throughput blockchain platform focused on decentralizing the internet through dApps, smart contracts, and content sharing. Founded in 2017, it supports fast, low-cost transactions (up to 2,000 TPS) and powers ecosystems like DeFi, NFTs, and stablecoins (e.g., $79B USDT supply).
TRX is used for fees, staking, and governance, positioning Tron as a scalable alternative to Ethereum.
Key News (Sep 1-7, 2025):
• Treasury Boost: Tron Inc added 312.5M TRX (~$110M) to holdings, doubling to $220M for grants, liquidity, and AI/DeFi growth—echoing MicroStrategy's BTC strategy.
• Ecosystem Hype: High engagement outpaces rivals; WLFI token unlock ties to Sun spark interest.
Institutional Accumulation:
• Tron Inc leads as a "MicroStrategy of TRX," filing for $1B securities to accumulate TRX (never sell) via Nasdaq listing/reverse merger with SRM Entertainment.
• XRP whales shifting to TRX pre-ETF hype; VanEck offers TRX ETP for exposure.
Market Maker Wintermute
💡 Entry & Exit:
Entry: $0.3323 (spot long)
🎯 Take Profit: $0.6646 (+100%)
My View:
After the correction, Tron is looking solid for continuing its uptrend.
Big players holding long positions on TRX/USDT are showing strong metrics, and market maker Wintermute doubled its investment in Tron over the past week, which boosts confidence for further growth.

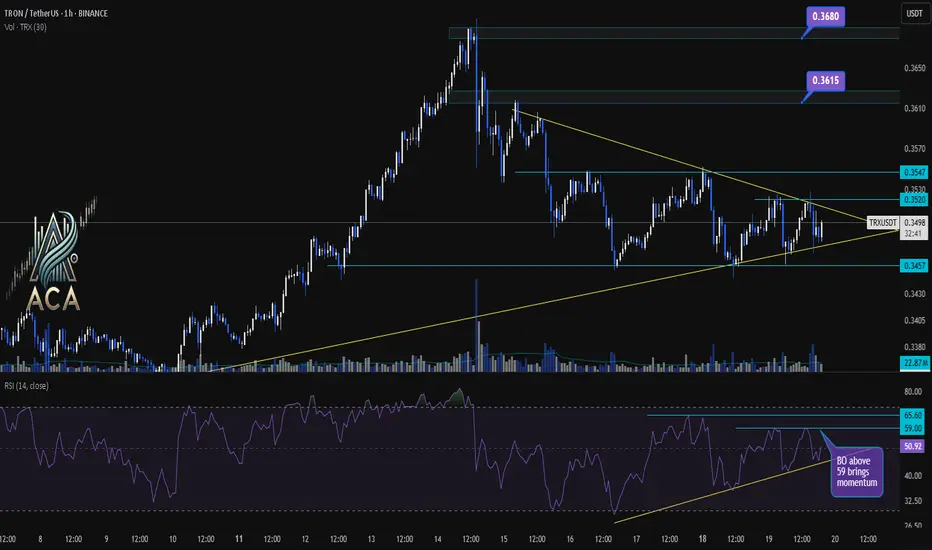
TRXUSDT 1H Chart Analysis | Eyeing the Breakout for MomentumTRXUSDT 1H Chart Analysis | Eyeing the Breakout for Momentum
🔍 Let’s break down TRX/USDT price action and identify setups that could unlock the next move, with a spotlight on RSI dynamics and key breakout levels.
⏳ 1-Hour Overview
The chart is currently forming a tightening symmetrical triangle, signaling a squeeze ahead of an expected breakout. Price action is consolidating between the local support at $0.3457 and resistance near $0.3520–$0.3547.
📈 RSI Insights
- The RSI sits around 48, reflecting short-term indecision and neutral momentum.
- There’s a clear RSI trendline forming higher lows, indicating underlying strength building up.
- Watch closely: An RSI breakout above 59 is flagged as a momentum trigger, historically driving stronger moves.
📊 Key Highlights:
- Chart pattern: Tightening triangle points to an imminent volatility expansion.
- Price structure: Breakout (BO) above $0.3520 or, more convincingly, $0.3547 opens up higher targets.
- Bullish targets: $0.3615 and $0.3680—these mark the next resistance zones if upside momentum takes over.
- RSI dynamics: Trendline support on RSI signals hidden demand; BO above 59 on RSI can fuel upside moves.
🚨 Conclusion:
TRX is at a make-or-break juncture. A decisive breakout above $0.3520 or, even better, $0.3547 could unlock a rally to $0.3615 and $0.3680. Keep a close eye on the RSI—trendline holds and a thrust above 59 can serve as early confirmation of buyer strength.
TRX/USDT Breakout Robbery – High Voltage Bullish Target Ahead🔥 TRX/USDT “TRON vs Tether” — Bullish Heist Operation 🔥
💎 Attention Money Makers & Market Robbers 💎
The vault is open and the TRX/USDT crypto bank is loaded! We’re rolling in with the Thief Trader Layering Strategy — stacking multiple buy limit orders like C4 charges on key price floors. This isn’t just trading… this is a high-voltage robbery plan ⚡🏴☠️
📈 Entry Plan (Infiltration):
No fancy timing here — any price level is a potential entry zone. We’ll be scaling in with precision to bait the market makers and ride the bullish tide.
🛑 Stop Loss (Escape Route):
0.3300 — the ultimate safe exit door. Breach that, and we vanish into the shadows before the cops (market reversal) arrive 🚔💨
🎯 Target (The Loot):
0.3610 — High Voltage Electric Resistance ⚡ + Overbought Fence Level 🚧. This is where the market will be too hot for the bears to touch.
💡 Tactical Notes:
We’re hunting in the bullish zone — only go long.
Stack positions smartly to trap weak hands and squeeze shorts.
The closer we get to target, the more the tension rises — exit like a ghost if volatility explodes.
📢 Trader Alert:
The market is charged with momentum ⚡. Keep your alerts active, and be ready to hit the green button before the crowd catches on.
❤️ Support the Crew:
Smash that Boost so the robbery squad gets stronger. Every click fuels more heists, more wins, and more profits 🤑💼💣
TRX/USDT Bullish Robbery Plan — We enter quiet, exit loud, and leave the market in smoke 💨🚀

Important Area: 0.30771-0.33084
Hello, fellow traders!
Follow us to get the latest information quickly.
Have a great day!
-------------------------------------
(TRXUSDT 1D Chart)
TRX is one of those coins (tokens) that has a lot of users, yet feels neglected.
For TRX to maintain its uptrend, the price must remain above the 0.30771-0.33084 range.
The circled areas represent important support and resistance zones.
When the M-Signal indicator on the 1W chart rises near the 0.30771-0.33084 range, a price decline below that level is highly likely to trigger a downtrend.
-
Thank you for reading to the end.
I wish you successful trading.
--------------------------------------------------
- This is an explanation of the big picture.
(3-year bull market, 1-year bear market pattern)
I will explain in more detail when the bear market begins.
------------------------------------------------------

TRX | TRON Goes BananasTRON Goes Full Banana Mode : Breaking Records and Throwing Peels at XRP!
TRX is up 500% since our first signal , so it’s officially time to party! order some lambos buy some bananas and let’s celebrate like crypto maniacs🎉🚀🍌
Currently priced at $0.38, it’s up a whopping +70% in just 24 hours. That’s the kind of growth that makes even Bitcoin blush. Speaking of records, TRON hit an all time high of $0.43 today, December 4, 2024, but it’s cooled off a bit, sitting just 10% shy of that milestone.
With a circulating supply of 86.29 billion TRX tokens (maxed out at the same number, like an all-you-can-eat buffet that’s finally closed), TRON isn’t playing around. Its 24 hour trading volume? A casual $5.50 billion, mostly on Binance, which is practically TRX’s second home. TRON now claims 0.90% of the entire crypto market, flexing a $33.60 billion market cap!
After altcoins like DOGE, XRP, HBAR, and XLM strutted their stuff, TRX stormed onto the scene and stole the show. Yesterday, it rocketed from $0.23, smashed through its 2018 ATH like a Kool-Aid man, and set its sights on $0.43.
This price explosion wasn’t just luck or hype. TRON’s ecosystem has been buzzing with activity. It’s dominating Tether transactions, launching flashy projects like Sun.Pump (sounds like a cryptocurrency gym), and riding on the relentless promotional energy of founder Justin Sun. He’s been spending cash like a kid in a candy store, including a hefty investment in Donald Trump’s crypto project and yeah the 6.2 million dollar BANANA was the main factor!
Speaking of Sun, he stirred the pot on Twitter by cryptically declaring, “TRX = XRP.” Bold move, Justin. For context, XRP skyrocketed after Trump’s election win and SEC Chair Gary Gensler’s dramatic exit. At one point, it gained over 420% in a month. XRP also hit a multi-year high this week near $3 and climbed to become the third-largest cryptocurrency by market cap.
TRX’s comparatively “modest” monthly surge of 135% isn’t as flashy, but hey, breaking an all-time high is still a flex. TRON’s market cap is about 5x smaller than XRP’s for now, but in crypto, anything can happen. With this much drama, who needs Netflix?
Always take profits, enjoy your trades, and celebrate your wins

tron (TRX)trx usdt daily analyses
time frame 4 hours
risk riwards ratio > 3.5 (woooow)
****** ( My condolences to those who lost their lives in the California fires.) *******
there is no volume in the market yet.
RSI is in the bottom of chart
price is in the down side of triangle and sellers couldn't break the support line ( 0.225$)
I set LS on the down of another support line on 0.195$
if we hear a good news about cryptocurrency market or tron , maybe a pump happens and good benefit for traders.
be careful for stop hunters. in this situations

TronTrx usdt Daily analysis
Time frame hourly
Short time Target 0.278 $
Risk rewards ratio >3.5 👈👌
This short time analysis is in the big Daily analysis that you can see in my forecasts before

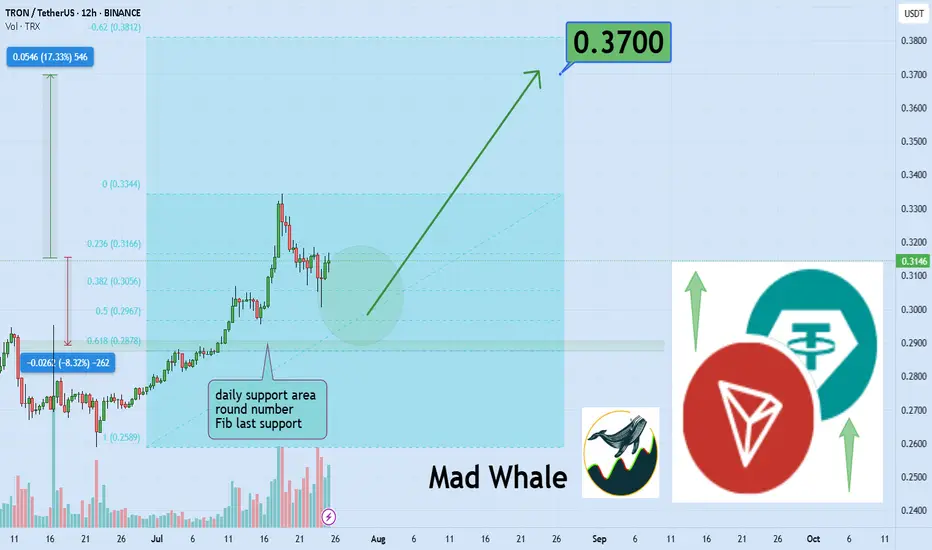
TRON Eyes 17 Percent Surge Toward Explosive 0.37 Breakout TargetHello✌
Let’s analyze TRON’s upcoming price potential 📈.
BINANCE:TRXUSDT is currently approaching a key daily support zone that aligns with a notable Fibonacci retracement level 🧭. This technical confluence suggests a potential short-term rebound, and I’m watching for a possible move of around 17% toward the 0.37 target 🎯.
✨We put love into every post!
Your support inspires us 💛 Drop a comment we’d love to hear from you! Thanks , Mad Whal
An Example of Trading a Coin (Token) You're Hesitant to Trade
Hello, fellow traders!
By "Following," you'll always get the latest information quickly. Have a great day today.
-------------------------------------
There are coins (tokens) that are showing positive trends, but are reluctant to trade.
BNB and TRX are two such coins.
(BNBUSDT 1W chart)
(TRXUSDT 1W chart)
What these two coins have in common is that their representatives are Chinese.
These two coins are consistently making efforts to expand globally.
BNB is ranked first among exchange-traded coins, while TRX is steadily making efforts to expand into the US market to expand globally.
Despite this, some are reluctant to trade due to concerns about being an exchange-traded coin and being a Chinese coin.
To mitigate this risk, it's best to increase the number of coins (tokens) that ultimately generate profits.
In other words, by selling the amount of the original purchase price, you retain the number of coins (tokens) that represent profit.
This way, even if the price plummets, you'll always be in profit, allowing you to seize new opportunities.
For coins (tokens) that demonstrate long-term growth potential, increasing the number of coins (tokens) that represent profit is recommended. While these coins (tokens) appear to have potential for long-term growth, they currently carry some risk.
This also applies to coins that are considered worth holding for the long term, such as BTC and ETH.
Therefore, coins (tokens) that have a large user base and are considered to have future value, such as XRP, ADA, SOL, and DOGE, still carry some risk.
-
Thank you for reading to the end.
I wish you a successful trading experience.
--------------------------------------------------