TRXUSD formed BAT pattern | A good long opportunityPriceline of Tron / Dollar has formed a bullish BAT and almost entered in potential reversal zone to hit the sell targets soon insha Allah.
Volume profile is showing less interest of traders within potential reversal zone.
MACD is still strong bearish and stochastic did not give any bull cross sofar therefore I would suggest to wait for MACD to turn weak bearish or for stochastic bull cross signal then buy.
I have defined targets using Fibonacci sequence:
Buy between: 0.015435 to 0.015338
Sell between: 0.015667 to 0.016016
Regards,
Atif Akbar (moon333)
Trxusdtechnicalanalysis

TRX/USDT BreakoutHello friends,
TRX has formed a bullish wedge.
I suspect a breakout before we take a larger move downward towards the Inverse cup and handle target.
Thank you for taking time to view this chart.
Not trading advice do your own research before you trade.
Cheers!

TRXUSD forming bullish butterfly a good long opportunity.Priceline of TRON /DOLLAR is forming a bullish butterfly and soon it will be entered in potential reversal zone.
I have defined targets using Fibonacci sequence:
Buy between: 0.017486 to 0.017260
Sell between: 0.017657 to 0.018077
Regards,
Atif Akbar (moon333)


TRXUSD hit the channel's support a good long opportunityPriceline of TRON / US DOLLAR hit the down channel's support.
RSI is oversold.
MACD turning bullish.
I have defined sell targets using Fibonacci sequence as below:
Sell between: 0.020495 to 0.021725
Regards,
Atif Akbar (moon333)


TRX dumped as Justin Sun got sicked, where to buy TRX ?TRX dumped hard this morning after Justin Sun announced to cancel lunch with Warren Buffet due to kidney stones. On a macro view, technically, TRX has finished a rising wedge pattern and a pullback.
TRX is facing 61.8% Fib. retracement, which is strong and universal support. If this support can't hold the price, TRX will lose 50% value from this price. On the other hand, TRX might test higher resistances which are the Fib. levels.
Ideal buy zone, supports, and resistances are as shown in the chart.

7-8% Retracement before continuing upwardTRXUSDT on a beautiful move the last couple of days following bitcoin's success. Heavily over bought at this stage, expect to see a healthy retracement down to 0.03400, around 7-8% to test support.
Be patient, have fun trading :) DOLLARCLUB


TRX Position RecommendationBINANCE:TRXUSD on the daily time frame has been on a long term trend line (Uptrend) from its initial days. Breaking its biggest down trend in its entire lifetime on 20 Dec 2018, It is getting close to the same lifetime uptrend after a long time.Also the chart signifies in the last 80 days people believe BINANCE:TRXUSD worth more than 0.022 Cents, making this region as a support zone. Being close to support zone & the uptrend line,the Stop Loss & the Targets make a good Risk/Reward Ratio (At least 3.77 for first TP). I believe these are sufficient reasons for a Chartist to take a position.
Stop Loss & the Targets are clear in the chart. please zoom for clarification. Aqua lines with numbers are important lifetime Fibonacci levels.
Remember Money management is one of the essential keys to success in Trading.
Good Luck ;) .


TRXUSD - 1D Chart AnalysisAfter 2 failed attempts (on the 20th and 21st of January) of changing it's direction, the price of Tron has bounced back from the 20 days Moving Average and it has registered 3 consecutive days of growth, continuing it's bullish trend.
Another important thing to mention is that the price of Tron has failed to break yesterday the Resistance Level of 0.0275 but it seems that today it may give it another try.
This scenario is also supported by the technical indicators, as it follows :
* The RSI is 61 but is has been around this level for some time already and the price has been increased;
* The "fast" line of the Stochastic is above the "slow" one and there is no sign for a possible intersection or change in the price direction, at least for now;
* The MACD looks like is about to cross the Signal, meaning that we might get a confirmation for the price increase anytime soon;
* The trading volumes are not impressive but we have to consider that today can be the 4th consecutive day in which these ones will end up on "green"
Out of all the possible scenarios, the one which seems to have the biggest chances to get caught off is the one in which the price will continue it's range movements with a possible target price for the next following days of 0.0300$

TRXUSD - 1D Chart AnalysisAlthough most of the cryptocurrencies have experienced oscillating developments over the last few weeks, caused mainly by the decline of the market capitalization, TRON seems to be one of the ones which had trading volumes above the average and it also managed to recover the losses registered in November.
Therefore, the bullish trend which has started on the 17th of December continued with the price which crossed the 20 days Moving Average and remained between it and the upper standard deviation of the Bollinger Bands until today.
At this stage, we have a contradiction of the technical indicators as it follows:
* The RSI at the level of 70, meaning that the price is considered "overbought' and it can have a correction anytime soon.
* On the other hand, the Stochastic is between the "neutral" area and the "overbought" one but the "fast" line is still above the "slow" one and there are no reasons to expect a trend change, at least for now.
* The MACD has indicated the increase on the 4th of January and it's position is still about the Signal, meaning that the growth has big chances to continue.
What is important to know is that all these 3 indicators had similar positions on the 23rd of December, day in which the price has started to move sideways for 11 days, period which was followed by another increase.
If the market will follow the same pattern, a target price which can be considered realistic is 0.0274$.

TRXUSDT, LongI see two possible variants of TRXUSDT movement. I expect TRX to go as the red variant shows, but there is still a possibility to go a bit lower before turning upwards.

TRXUSD - BUY COMING UPTRXUSD IS IN A GOOD PLACE I BELIEVE
THIS IS GEARING UP FOR A BIG PUSH UP
JOIN IN
FOLLOW, COMMENT AND LIKE


TRX continues to have trouble with 385!TRX is trying to break out from this range it's been stuck in for weeks but it cannot properly close above the 385 level. We did break and close above it earlier in the month but that was short-lived as we returned back below after just 2 days above.
We are currently sitting on top of a demand zone, which has held strong in the past so if we are expecting some movement in TRX, now is the time as BTC continues to trend sideways. A break below this support area could see us test the lows once more, which could make a lot of bulls panic out of their longs. Breaking above resistance will cause a lot of short liquidations, which could see TRX potentially even test 2 supply levels above.
Thanks guys


TRXUSD to continue the Downtrend, but may bounce over 300 pipsTorn is going south for the moment, however it is likely that it will bounce back up and maybe go through the resistance of the downtrend.
Do you think TRX has still something to offer or is an outdated coin?

TRXUSD Break the Trend line and goes up for next Profit zoneTRXUSD Break the Trend line and goes up for next Profit zone

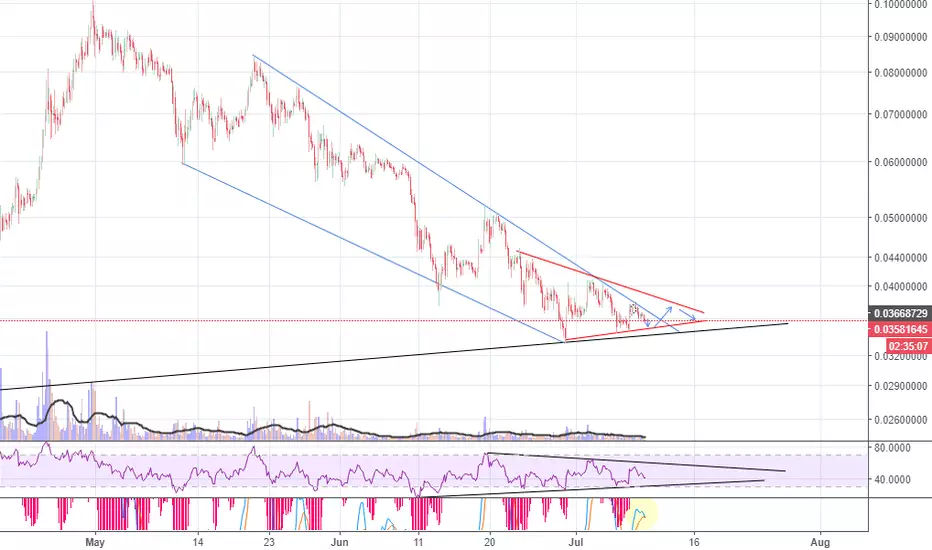
Bullish Signs in TRX Hi Guys,Let's Look at TRX chart
We have 2 Bullish wedge.First one started from May and second one from Jun.You can see first one in main idea chart and second one bellow.
In a more exact look to chart we can find two triangle two,first one in the end of trend (red line) and important one is a long term one that i coint on it as a symmetrical triangle,you can see in chart bellow.
This kind of triangles usually have result in way of market consolidation but we have cases that these triangles had reversal result.in this case with all these bullish signs i think we will bounce in favor of one of these formations.Before that with signs that i see in indicators we can make another impact to our bottom lines like blue arrow in chart or more to black line.
But like always we need BTC to push market in correct way and don't ruin the party,so if you want to enter trade in this coin don't forget a tight stop loss or at least stop around $0.0335.
Good Luck
(Buy Tron) TRXUSD Technical Analysis for April 5, 2018Hello Traders,
Time to buy Tron (TRX) with stops at 8 cents.
