TESLA FREE SIGNAL|
✅TESLA reacts strongly from discounted demand after liquidity sweep, forming bullish displacement. Expect continuation toward premium as imbalance fills and buy-side strength holds.
—————————
Entry: $431.55
Stop Loss: $417.14
Take Profit: $451.76
Time Frame: 4H
—————————
LONG🚀
✅Like and subscribe to never miss a new idea!✅
Tesla Motors (TSLA)

The "Stealth" Bear—Efficient Selling, Low Confidence
Verdict: WATCHING (Possible Setup)
Tesla has flipped to a bearish bias, and interestingly, the selling is "cleaner" than the buying on Gold. However, the Neural Brain is refusing to execute the trade right now.
1. THE PHYSICS: Efficiency Score (0.57)
Status: Highly Efficient Decline
The Data: For every $1 the price drops, it travels roughly $1.75 in total path.
The Meaning: The selling pressure is surprisingly organized. Despite the choppy look of the chart, the math shows high structural integrity in this downward move. It is not panic selling; it is orderly distribution.
2. THE MIND: Conviction (GAINING)
Status: Bearish Turn
Bias: BEARISH. The price is effectively BELOW CLOUD, flipping the system's bias to the downside.
Conviction: GAINING. The math engine is locking onto this downtrend, calculating an increasing probability of lower prices.
3. THE STRATEGY: "WATCHING (Possible Setup)"
Status: Stalking the Trade
Confidence: 19% (Low). This is the deal-breaker. While the move is efficient, the statistical confidence hasn't crossed the actionable threshold (usually >70%).
Action: WAIT. The system sees a potential short forming but determines it is too early to strike.
Verdict: Add to watchlist. Do not short until the Confidence metric spikes to confirm the breakdown.

TSLA Tesla Options Ahead of EarningsIf you missed buying TSLA before the rally:
Now analyzing the options chain and the chart patterns of TSLA Tesla prior to the earnings report this week,
I would consider purchasing the 460usd strike price Calls with
an expiration date of 2026-1-30,
for a premium of approximately $4.40.
If these options prove to be profitable prior to the earnings release, I would sell at least half of them.

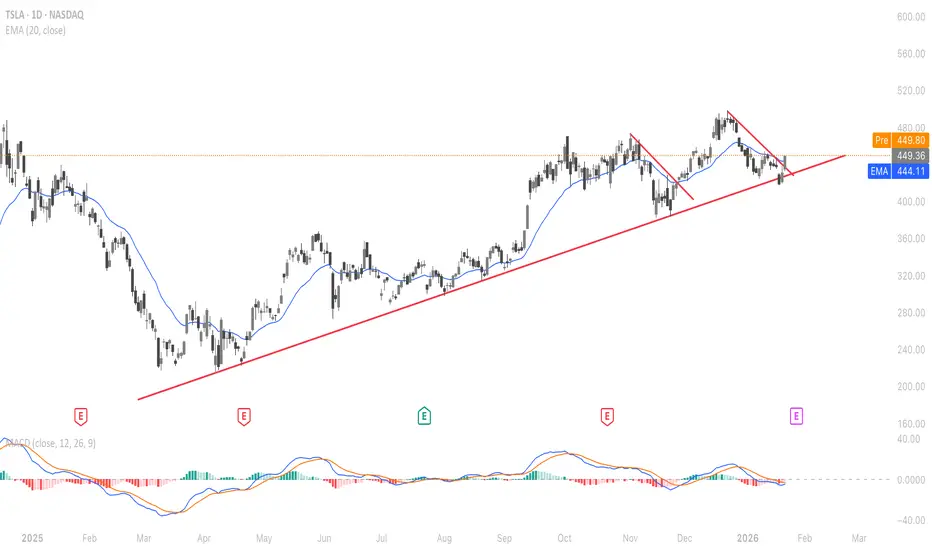
When Price Returns to the Balance ZonePreviously, Tesla had a clear impulsive rally that pushed price into the 490–500 USD area. This was a leadership-type move, where active capital drove price decisively away from its balance zone. But like any healthy trend, the market can’t move in a straight line forever. As short-term momentum faded, price began to correct, broke the short-term bullish structure, and rotated back toward an area where trading activity had previously been much heavier.
At the moment, TSLA is hovering around the 449 USD level, very close to key moving averages. This is not a zone where the market is making a decision—it’s a zone where the market is asking a question. The question is not “will price drop further,” but rather: are buyers still willing to defend the trend now that price has returned to a more reasonable, accepted level?
The way price reacts around the 440–445 USD area will be highly informative. This zone is a confluence of prior consolidation and medium-term moving averages—an area where real participation usually has to reveal itself. If price holds this region and starts to show constructive reactions, the market is implicitly saying that the uptrend still has value. If, on the other hand, this area is decisively broken, the question shifts lower, toward the 420–425 USD zone, where demand previously appeared with more conviction.
What matters most right now is that there are no signs of a panic-driven breakdown. This pullback looks more like a process of “rebalancing” than a structural shift. If buyers step back in, the 460–465 USD area will be the first meaningful test. Only if TSLA can clearly reclaim this zone does a recovery start to carry real weight. Beyond that, the 480–490 USD region remains an area where the market would need to prove a great deal if the bullish narrative is to continue.
Placing TSLA in a broader context, this behavior makes sense. Rate-cut expectations are still present, but no longer strong enough to fuel the kind of extreme enthusiasm seen earlier. Capital is still flowing into growth stocks, but it has become more selective—favoring fair value rather than chasing price. For Tesla, no structurally negative news has emerged; as a result, the current pullback appears far more technical in nature than fundamentally driven.

TSLA Trading at Key Gamma Level (435) — Volatility DecisionNASDAQ:TSLA 📊 | Price + Gamma Alignment
435 is the key.
🧲 Gamma Flip / HVL: 435
Above = controlled, range behavior
Below = volatility expansion
🔴 Resistance: 449 → 460
🟢 Support: 435 → 431 → 420
GEX still positive, but dealer support weakening.
Acceptance below 435 opens downside.
Trade price — let gamma explain why 🎯

TSLA(daytrading)bearback to retest
2 option to watch
1 hit sma50 in h1 also hit sma 200 h1
2 hit 0.5-0.615 fibonacci, resistant

TESLA LOCAL SHORT|
✅TESLA retraces into a premium supply zone after a corrective bounce. Weak bullish momentum and rejection from imbalance suggest sellers may defend this area, favoring a pullback toward lower liquidity. Time Frame 6H.
SHORT🔥
✅Like and subscribe to never miss a new idea!✅

TSLA Outlook : Momentum Still Favors the UpsideTesla continues to show strong price behavior, with momentum and structure still pointing higher. The move highlighted on the chart reflects controlled buying pressure and healthy continuation rather than signs of exhaustion. At this stage, the focus remains on staying aligned with the dominant flow and letting price confirm the bias, instead of trying to anticipate early reversals. As long as this momentum remains intact, the upside outlook stays firmly in play.
Disclosure: We are part of Trade Nation's Influencer program and receive a monthly fee for using their TradingView charts in our analysis.

Stock Market Forecast | BTC TSLA NVDA AAPL AMZN META MSFTStock Market Forecast | CRYPTOCAP:BTC TSLA NVDA AAPL AMZN META MSFT
SP:SPX CME_MINI:ES1! CME_MINI:NQ1!
Weekly stock market analysis covering the S&P 500 (SPY), Nasdaq 100 (QQQ), Bitcoin (BTC), and major large-cap stocks. In this video, we break down technical charts, key support and resistance levels, sector rotation, market sentiment, dark pool activity, earnings, and macroeconomic data to identify high-probability market scenarios for the week ahead.
Timestamps are included below so you can jump directly to specific tickers and chart analysis.
0:00 Intro & Market Overview
0:58 Sector & Sentiment Data
2:10 MAG 7 ETF / Dark Pools
5:12 ARK / Innovation & Small Caps
6:34 Earnings & Economic Calendar
8:44 S&P 500 (SPY)
12:12 Nasdaq 100 (QQQ)
15:22 Bitcoin (BTC)
22:15 Tesla (TSLA)
25:00 Meta (META)
26:30 Amazon (AMZN)
28:00 Microsoft (MSFT)
32:58 Google (GOOGL)
36:27 Apple (AAPL)
39:38 Nvidia (NVDA)
42:40 Outro

TESLA: Short Signal Explained
TESLA
- Classic bearish formation
- Our team expects pullback
SUGGESTED TRADE:
Swing Trade
Short TESLA
Entry - 449.13
Sl - 454.75
Tp - 438.67
Our Risk - 1%
Start protection of your profits from lower levels
Disclosure: I am part of Trade Nation's Influencer program and receive a monthly fee for using their TradingView charts in my analysis.
❤️ Please, support our work with like & comment! ❤️

$TSLA Earnings Surprise? Sub $400 perhapsWell... Hope everyone has been good since I've last seen everyone. I'm doing alright, thanks for asking. Had my first profitable year trading options and it feels fantastic. With that said, lets start the new year with a bang! I've got this bar pattern here, a direct bearish match. Invalidation with a close above the gap at $475. Any close below the gap fill will be considered bearish into Earnings where the pattern matches up for a mean drop sub $400 by the end of the first week of February. I'll be looking forward to catching this $70 move if possible.

Tesla (TSLA) Shares Jump After Musk’s Davos RemarksTesla (TSLA) Shares Jump After Musk’s Davos Remarks
This year’s Davos Forum has drawn attention not only because of developments around Greenland and Donald Trump’s proposed Peace Council, but also due to the appearance of Elon Musk, who has previously criticised the event. The world’s richest man made bold statements regarding Tesla’s Optimus humanoid robots, which became a key talking point.
According to Musk’s vision:
→ Tesla plans to begin selling Optimus robots to the general public by the end of 2027, with an estimated price of $20,000–$30,000, making them cheaper than a car.
→ In the long term, Optimus robots could account for up to 80% of Tesla’s total company value, while the robotics market — where robots may eventually outnumber humans — could generate trillions of dollars in market capitalisation.
These comments acted as strong bullish catalysts, and Tesla (TSLA) shares rose by more than 4% yesterday.
Technical View on TSLA
When analysing Tesla’s share price on 30 December, we:
→ updated the ascending channel that has been in place since summer 2025;
→ highlighted signs of market weakness;
→ suggested that TSLA could decline towards the lower boundary of the rising channel.
Indeed, the lower boundary was reached as early as 8 January. More recent chart data suggests that bulls are now regaining control:
→ a bullish engulfing pattern has formed (marked by the arrow) just below the channel’s lower boundary;
→ yesterday’s session opened with a bullish gap and closed near the highs;
→ trading volumes have been increasing on bullish candles, indicating strengthening demand.
As a result, it appears reasonable to expect that bulls may succeed in pushing TSLA back into the main ascending channel, potentially resuming the move towards the psychological $500 level. Whether this scenario plays out will largely depend on the outcome of Tesla’s quarterly earnings report, scheduled for release on 28 January.
This article represents the opinion of the Companies operating under the FXOpen brand only. It is not to be construed as an offer, solicitation, or recommendation with respect to products and services provided by the Companies operating under the FXOpen brand, nor is it to be considered financial advice.

Tesla Rebounds From Daily SupportTesla is bouncing off daily support, keeping a bullish bias intact.
As long as price holds above $420, the pullback looks constructive and favors further upside.
TSLA — Strong Trend, No Edge Yet | Stand Aside (Edge Filter)Tesla remains in a strong uptrend, but current price is mid-range with no asymmetric edge.
Edge Filter signals stand aside — patience beats prediction here.
Chart Context
Higher-timeframe trend is clearly bullish
Price recently expanded and is now digesting gains
No meaningful compression at support or rejection at resistance
This is trend strength without location.
Edge Filter Read
NO EDGE — STAND ASIDE
Momentum exists, but risk/reward is neutral at current price.
This label is intentional:
Not every strong chart is a trade.
What I’m Waiting For
Edge returns when price moves into one of two zones:
Compression near support → long bias
Rejection near highs / resistance → short bias
Until then, patience is the position.
Why This Matters
Most losses happen between levels, not at them.
The Edge Filter is designed to keep you out of low-quality trades, not push you into action.
Indicator Used
Quant Labs — Edge Filter (Community Edition)
An open-source framework for identifying where edge exists — and where it doesn’t.
Risk Note
This is a contextual read, not a signal.
Always wait for confirmation and manage risk accordingly.

TSLA D1 Institutional Buy/Sell Levels by ProjectSyndicate 🔱 TSLA DAILY SNAPSHOT — EXECUTIVE SUMMARY (NEW WEEK | JAN 2026)
✨ Dip-accumulation reversal setup is the focus — but upside is capped until overhead sell-side is cleared
🧲 Fresh overhead sell-side liquidity / fresh supply: 495 plus key level 460
📌 Context: price is range-bound between fresh supply 495 and fresh demand 300 → institutional levels define the map
🧲 Bull FVG + preferred reversal zone: 365 USD = best area to scale into longs (360–380)
🛡 Failure zone / risk-off trigger: loss of 340 opens downside to 300 fresh demand
🎯 Bull target: 495 fresh supply pocket overhead
🏦 Core play: accumulate on dips at/near 360/380, manage risk if 340 fails, take profit into 495
🗳️ TSLA Daily Scenarios — What’s Your Play?
Which path do you have for TSLA next week?
🅰️ Hold 360–380 → reversal works → reclaim 420 → rotation into 460
🅱️ Sweep below 360 → reclaim 365 FVG → squeeze into 420 → 460
🅲 Drive into 460 → stall/reject → pullback toward 420 → 380
🅳 Break/hold below 340 → weakness confirms → downside opens to 300
Your key levels: 460 / 420 / 380 / 340
Your FVGs: 365 (bulls)
Your fresh zones: 495 supply / 300 demand
Plot same levels on your TSLA chart with
Supply Demand Zones PRO | ProjectSyndicate

TESLA FREE SIGNAL|SHORT|
✅TESLA
Bearish ICT breakout below supply confirms distribution. Failed reclaim of premium and displacement lower signals continuation toward sell-side liquidity and lower imbalance zone.
—————————
Entry: 426.17$
Stop Loss: 438.00$
Take Profit: 409.19$
Time Frame: 4H
—————————
SHORT🔥
✅Like and subscribe to never miss a new idea!✅

$TSLA: Major Flush Incoming?Hello TradingView Community!
NASDAQ:TSLA on the logarithmic monthly chart is flashing some serious warning signs.
Price just rejected the upper trendline like it did in 2019 — classic exhaustion after the parabolic run.
We think this could be the start of something serious: a deep multi-month correction, shaking out weak hands, resetting momentum, and building better structure for the eventual next leg higher. Long-term bullish narrative remains intact, but right now it smells like a major flush incoming.
Your thoughts? Beginning of a big bear phase, or just healthy pullback?
#Tesla #TSLA #TradingView #LogChart

SPY WEEKLY 20 JAN 2026Spy weekly is here, feel free to leave a comment if you have any doubt and I will try to revert back asap.
I have analyzed in depth price action here discussing all sectors as well
NOTE:ALWAYS USE SL

SPY 20JAN 2026 READ DESCRIPTIONSpy is about to hit this level. Just be careful if you are short.
Market can easily bounce and go up from here.
I am travelling and will try to update spy weekly asap.

TSLA Remains A Dead TradeDouble top, Rising wedge failure with a minor Crack followed by two major CRACKS!
For four years now, people have been chasing narratives rather than value. "Pilot testing" makes no difference. It's all baked in and then some. Don't lose your money chasing narratives.
As I have been warning for a long time now.
If narratives mattered more than price, this wouldn’t look like this.
Look for the previous low to break.
THANK YOU for getting me to 5,000 followers! 🙏🔥
Let’s keep climbing.
If you enjoy the work:
👉 Drop a solid comment
Let’s push it to 6,000 and keep building a community grounded in truth, not hype.

Stock Market Forecast | BTC TSLA NVDA AAPL AMZN META MSFT0:00 Intro & Overview
0:22 Sector Data & Sentiment
2:42 Dark Pools (RSP & MAG7)
6:44 S&P 500 (SPY)
9:21 Nasdaq 100 (QQQ)
11:37 Bitcoin (BTC)
15:04 Tesla (TSLA)
18:17 Meta (META)
22:03 Amazon (AMZN)
23:25 Microsoft (MSFT)
26:54 Google (GOOGL)
31:16 Apple (AAPL)
34:58 Nvidia (NVDA)
37:26 Outro
Stock Market Forecast | BTC TSLA NVDA AAPL AMZN META MSFT
SP:SPX AMEX:SPY CME_MINI:ES1! CME_MINI:NQ1!

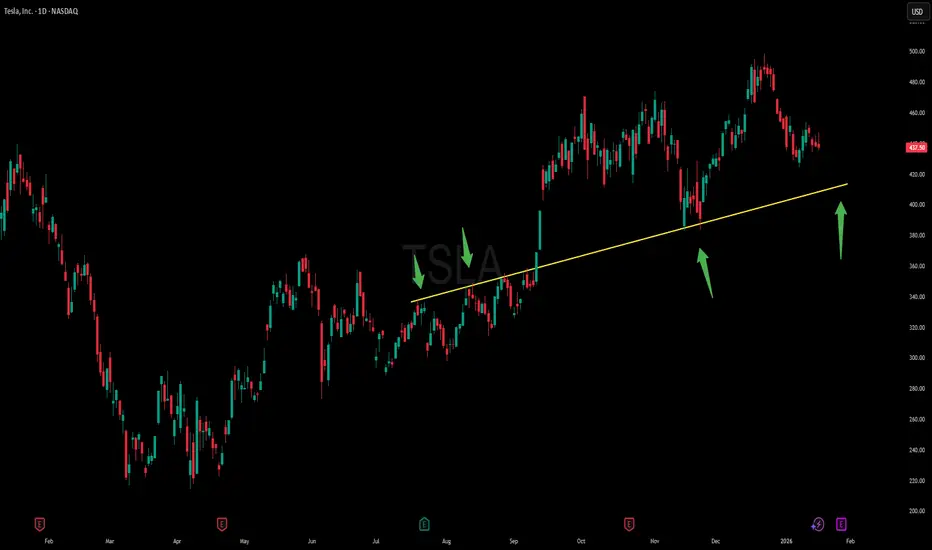
TESLA TRADE IDEA $TSLANASDAQ:TSLA Over the last 365 days, Tesla has consistently respected this trendline, providing several high-quality trading opportunities. Each time price has approached this level, we’ve seen strong reactions, making it a technically significant area to watch. From a chart perspective, this trendline has acted as reliable support, and the market has repeatedly confirmed its importance through both price action and volume response.
If you’re looking for a potential buying opportunity in Tesla, this area looks particularly interesting. The risk-to-reward setup appears favorable as long as the trendline continues to hold, and the broader structure still supports the prevailing trend. Of course, confirmation and proper risk management are key, but based on this chart alone, the setup looks compelling and worth close attention. What do you think about this trade idea?
Will Tesla Drop 30-40% ? - AnalysisTesla has recently reached new all-time highs, but there may be significant challenges ahead for the company. First, Tesla’s EV deliveries have recently declined, even though the global EV market is still growing. This is concerning because the company’s main revenue stream remains vehicle sales, and weaker demand directly affects earnings.
Despite this, some analysts remain bullish because they increasingly view Tesla as more than just an automaker, arguing that it is evolving into an AI and robotics company through initiatives such as Full Self-Driving, robotaxi projects, and the Optimus humanoid robot.
At the same time, Elon Musk’s compensation package and long-term targets have raised concerns. Analysts point out that several of Musk’s previous timelines, particularly for fully autonomous driving and new product launches, have been delayed or not met as originally promised. As a result, there is growing skepticism about Tesla’s ability to achieve Musk’s newest objectives, including large-scale commercial deployment of the Optimus robot.
Moreover, Tesla’s P/E ratio is extremely high (around 300), indicating that the current share price of roughly $440 reflects very optimistic future growth expectations. Unless revenues and profits increase rapidly in the coming years, this valuation appears difficult to justify.
Disclaimer:
This analysis is for informational and educational purposes only and does not constitute financial advice, investment recommendation, or an offer to buy or sell any securities. Asset prices, valuations, and performance metrics are subject to change and may be outdated. Always conduct your own due diligence and consult with a licensed financial advisor before making investment decisions. The information presented may contain inaccuracies and should not be solely relied upon for financial decisions. I am not a licensed financial advisor or professional trader. I am not personally liable for your own losses; this is not financial advice.
