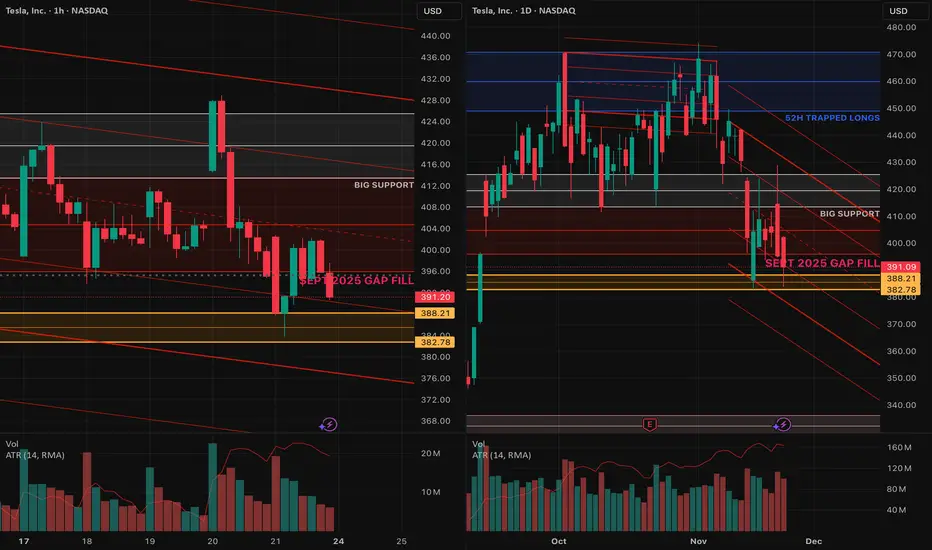
TSLA ... From darling to toxic exThere is nothing to debate.
PWL at 382.78–388.21 must hold, or buyers get steamrolled. We’re trading below the 50-day on the daily, and any strength is likely to be sold into. I hate leaning this bearish, but if there’s going to be a short-term bounce, it *starts* with the PWL holding. With heavy overhead supply near 400, this is not a name where you want to be the early hero.
If the PWL breaks, downside opens to the 200-day near 338 or the beige pocket between 328–336.
Negative headwind:
Forget Musk's latest pay package, his last one could wipe out years of Tesla profits
By Chris Kirkham
www.reuters.com
Tesla Motors (TSLA)
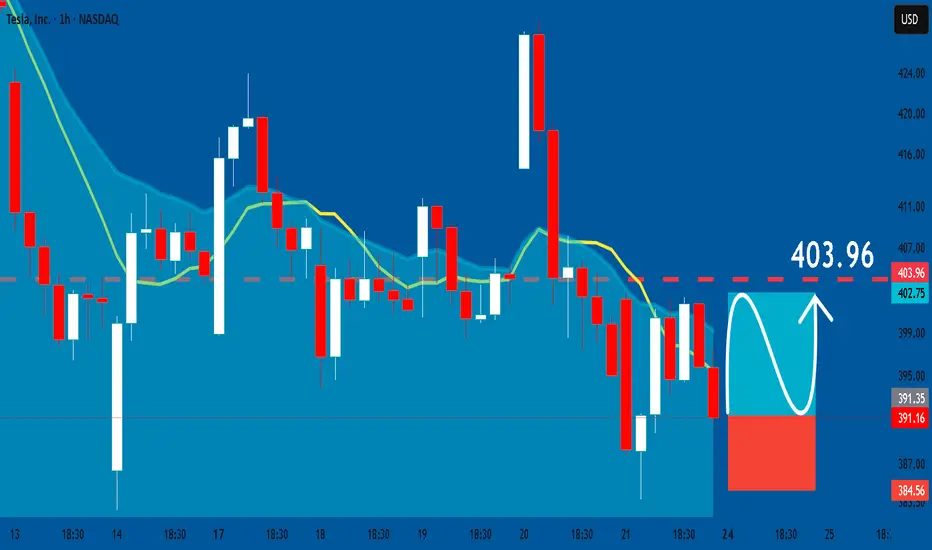
TESLA: Long Signal Explained
TESLA
- Classic bullish pattern
- Our team expects retracement
SUGGESTED TRADE:
Swing Trade
Buy TESLA
Entry - 391.16
Stop - 384.56
Take - 403.96
Our Risk - 1%
Start protection of your profits from lower levels
Disclosure: I am part of Trade Nation's Influencer program and receive a monthly fee for using their TradingView charts in my analysis.
❤️ Please, support our work with like & comment! ❤️
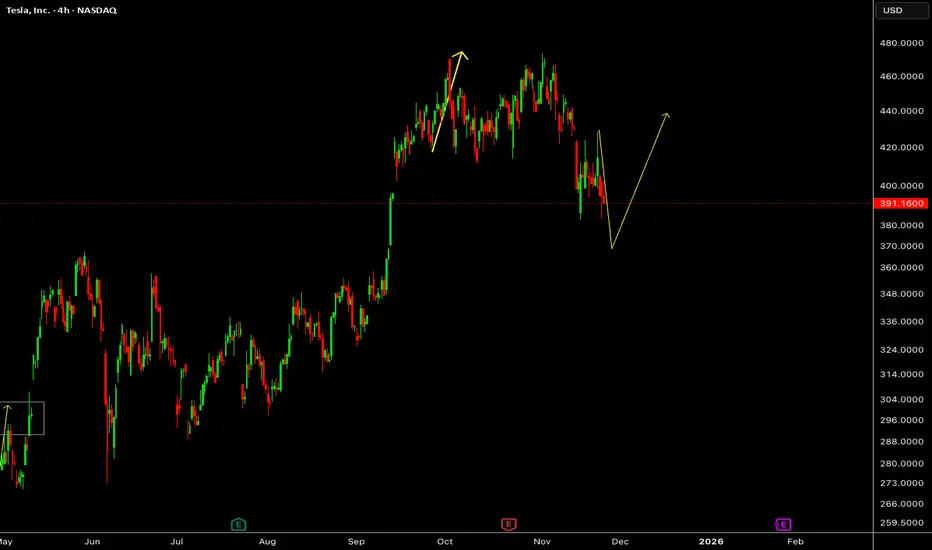
TSLA – Downside Extension Followed by Potential Rebound PhaseTesla has continued to slide after its recent peak, with price action forming a deeper corrective leg. The latest reaction suggests a rebound scenario may develop if momentum begins to shift, paving the way for a possible recovery sequence in the coming sessions.
Disclosure: We are part of Trade Nation's Influencer program and receive a monthly fee for using their TradingView charts in our analysis.
Stock Market Forecast | BTC TSLA NVDA AAPL AMZN META MSFTStock Market Forecast | SP:SPX CME_MINI:NQ1! CME_MINI:ES1! CRYPTOCAP:BTC
Mag 7 | TSLA NVDA AAPL AMZN META MSFT

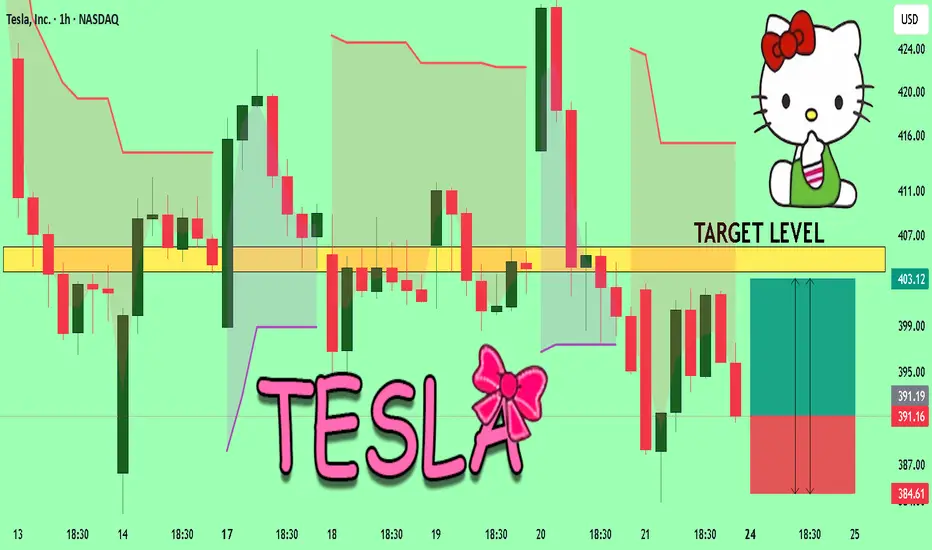
TESLA Will Explode! BUY!
My dear friends,
My technical analysis for TESLA is below:
The market is trading on 391.16 pivot level.
Bias - Bullish
Technical Indicators: Both Super Trend & Pivot HL indicate a highly probable Bullish continuation.
Target - 403.74
Recommended Stop Loss - 384.61
About Used Indicators:
A pivot point is a technical analysis indicator, or calculations, used to determine the overall trend of the market over different time frames.
Disclosure: I am part of Trade Nation's Influencer program and receive a monthly fee for using their TradingView charts in my analysis.
———————————
WISH YOU ALL LUCK
TSLA: Fundamentals Are Collapsing While Valuation Stays in OrbitTesla is trading near multi-month highs… but the fundamentals tell a very different story.
EPS has dropped by 50%, revenue growth has almost stalled, and yet the stock still carries a Forward P/E of 164.
This combination — slowing growth and extreme valuation — looks like the definition of an institutional bubble setup.
🧮 Fundamental Context
Over the past few years, Tesla’s growth has slowed dramatically:
Revenue rose from 31B → 53B → 81B → 96B → 97B — barely any increase.
EPS climbed from 0.2 → 1.6 → 3.6 → 4.3 — and then fell by half.
Quarter-over-quarter metrics remain negative, with no visible recovery trend.
Meanwhile, the Forward P/E of 164 implies double-digit expansion ahead — which clearly isn’t happening.
The fundamentals simply do not justify this kind of valuation.
Right now, Tesla’s numbers resemble the early phase of a valuation compression cycle — where prices eventually catch up with reality.
📉 Technical Structure
Technically, Tesla has been moving in a broad sideways range, forming what looks like a long-term Wave 4 structure.
We’re currently inside the “B” leg, which could already be complete or near completion.
Once that wave ends, the next expected move is a Wave C decline.
Key levels to watch:
📍 Upper resistance zone: $400 – $550
📍 Primary cluster: around $250
📍 Support zone: $150 – $200
The chart shows clear volume concentration around $250 — once that level breaks, the next liquidity pocket sits between $150 and $200.
That’s where a potential bottoming cluster could form before the final upward leg.
⚠️ Market Outlook
While other FANG names maintain solid balance sheets and stable earnings, Tesla’s fundamentals are deteriorating sharply.
Yes, the stock may still see short-term pumps driven by sentiment or Musk’s fan base — but markets always return to fundamentals.
And those fundamentals are pointing downward.
📊 Summary
EPS and revenue both trending lower 📉
Forward P/E at 164 — completely disconnected from growth metrics
Technical range suggests potential decline toward $200–$150
Current price action likely part of a larger corrective structure
Long-term investors should exercise extreme caution ⚠️
Tesla isn’t a short-term “growth story” anymore — it’s a valuation risk story.
Until earnings stabilize and margins recover, this stock looks massively overpriced.

Stock market will test yearly levels below current supportAs the yearly candle closes and the new one opens, there is an orderflow pattern that is well developed. This will play out again as always 💎

Tesla Retests Key support Amid a New Lawsuit After Deadly CrashTesla (NASDAQ: NASDAQ:TSLA ) faces renewed scrutiny after a lawsuit was filed over a fatal January 2023 crash in Washington state. According to the complaint, the vehicle “rapidly accelerated” before striking a utility pole and bursting into flames, killing one passenger and severely injuring another. First responders reportedly struggled to access the victims due to the vehicle’s structure and fire behavior, raising questions about safety systems and emergency accessibility.
The lawsuit lands during a period of heightened attention on Tesla’s real-world AI features, including Autopilot and Full Self-Driving (FSD). While the filing does not explicitly blame autonomous systems, it adds pressure to Tesla’s regulatory and legal environment, which remains a critical investor risk factor heading into 2026.
Tesla’s Fundamentals Remain Strong
Despite the legal challenges, Tesla retains a massive market cap near $1.33 trillion and continues scaling its energy and robotics divisions. The company remains profitable, with a strong balance sheet and long-term margin expansion driven by software, AI, and autonomous capabilities. The Optimus humanoid robot program and 4680 battery ramp both strengthen Tesla’s position in the next industrial cycle.
Tesla’s broad lineup—from the Model 3 to the Semi and Cybertruck—supports global delivery growth, while its charging infrastructure partnerships increase ecosystem reach. Fundamentally, Tesla remains one of the strongest players in the EV and AI–mobility sectors.
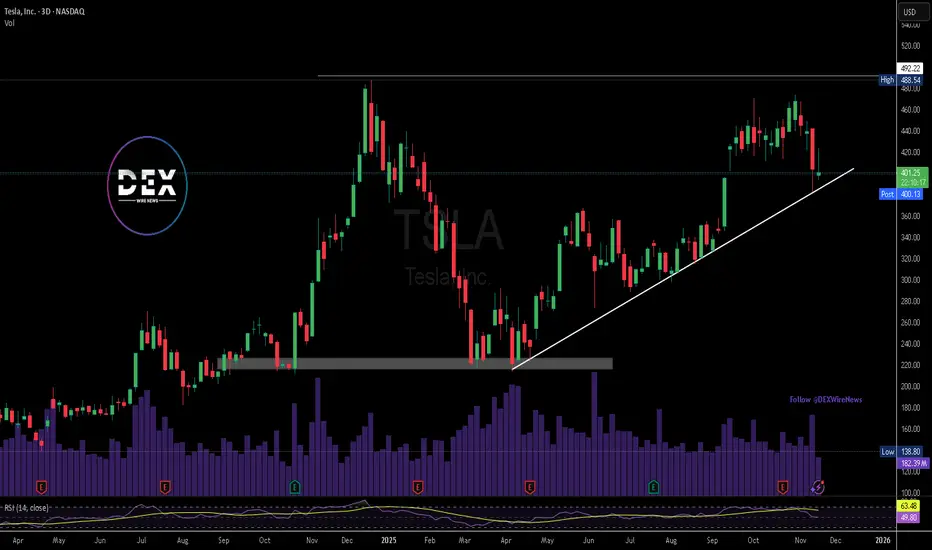
Technical Outlook: Trendline Retest in Play
From a price-action perspective, Tesla trades around $391, pulling back toward a critical ascending trendline visible on the weekly chart. This trendline has guided Tesla’s recovery since April and remains the key level to watch.
Support:
• $390 trendline
• Major demand at $350
• Long-term support at $250
Resistance:
• $425
• $492 (2025 high)
A strong bounce at the trendline could send TSLA back toward $425 and eventually $492. However, a clean breakdown risks a deeper correction toward the $320 zone.

Tesla - Withstanding all weakness!🏹Tesla ( NASDAQ:TSLA ) can still break out:
🔎Analysis summary:
Since Tesla was listed on the Nasdaq back in 2013, we witnessed a lot of triangle breakouts. And starting all the way back in 2020, Tesla once again created a bullish triangle. Last month we saw the breakout and this month we have to see the confirmation
📝Levels to watch:
$400
SwingTraderPhil
SwingTrading.Simplified. | Investing.Simplified. | #LONGTERMVISION

Nasdaq 100, Tesla and Apple OutlookWall Street is on the verge of closing lower for a third week for the first time in eight months. I explain why I think there could be further losses ahead, why Tesla (TSLA) is a preferred short setup and why to keep an eye on Apple (AAPL).
Matt Simpson, Market Analyst at City Index

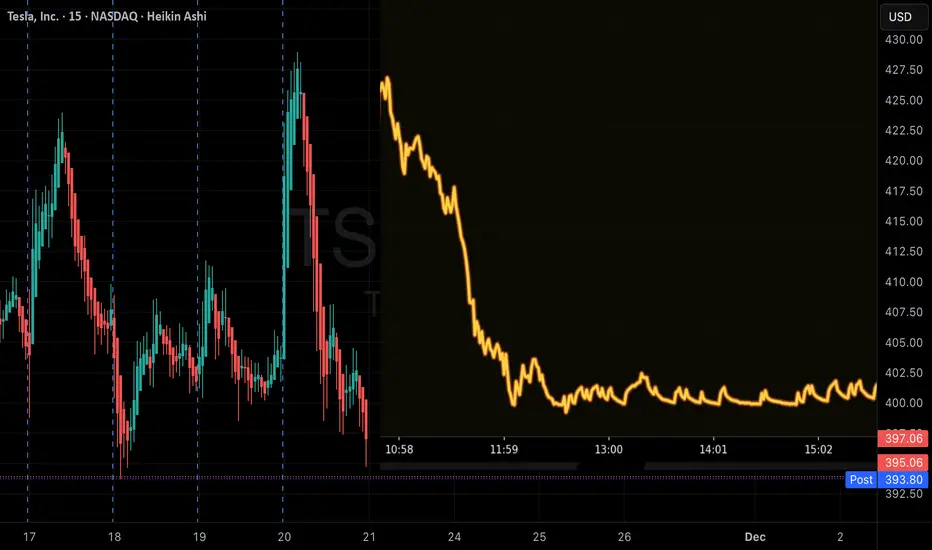
QuantSignals V3 TSLA Alert: Strong Bearish MomentumTSLA 1M | QuantSignals Katy | 2025-11-20
Direction: PUT (Bearish)
Confidence: 75%
Current Price: $427.76
Final Target: $411.82 (-3.73%)
30min Target: $419.17 (-2.01%)
Entry: $427.76
Take Profit: $415.01
Stop Loss: $434.18
Volatility: 24.9%
Analysis:
Katy AI predicts steady bearish movement over the month.
Momentum favors downside, with 1M horizon showing consistent decline.
Strong confidence (75%) and moderate volatility suggest high-probability put setup.
Trade Setup & Edge:
Entry aligns with current price at resistance level.
Tight stop limits risk while capturing projected downside.
Short-term 30-min target gives early exit option if quick profit is desired.
⚠️ Risk Warning: Moderate volatility; adjust position size accordingly.
Tesla Is Moving Toward a Key Support ZoneHello everyone, Tesla is entering a sensitive phase as the strong rally from 310 USD to 406 USD over the past two months begins to lose momentum. The recent decline is not just a normal pullback; the repeated appearance of red FVGs shows that buying pressure is fading while sellers are gradually taking control again. At the moment, the 401 USD level is acting as the nearest support. If this area fails to hold, Tesla could slide further toward 395 USD — a zone with green FVGs and heavy volume where strong buying previously pushed the price upward.
On the fundamental side, the news flow isn’t helping. Tesla’s Q3/2025 report showed adjusted profits dropping nearly 29% even though revenue still grew around 12%, indicating that operational efficiency is weaker than expected. Rising costs, lower income from regulatory credits, and massive investments in AI and robotics continue to squeeze margins. At the same time, competition from Chinese and European EV manufacturers is intensifying, putting additional pressure on Tesla’s future market share. With the broader tech market shifting toward a risk-off mood, growth stocks are taking heavier hits — and Tesla is clearly feeling that weight.
Given both technical structure and market sentiment, the most reasonable scenario right now is a continued move down into the 395 USD support zone to test liquidity and gauge the market’s reaction. This level remains a strong technical area and could trigger a meaningful bounce if buyers step in. However, if 395 USD breaks under negative news or persistent outflows from growth assets, the decline could extend toward 385–380 USD. On the flip side, if a major positive catalyst appears — such as notable progress in robotaxi development, better margins, or a breakthrough in battery technology — the 405–410 USD region would be the first recovery target.
For now, Tesla is standing at a “pivot zone” — a place where the market will soon reveal whether this is just a pause before another upward leg, or the beginning of a deeper corrective cycle.

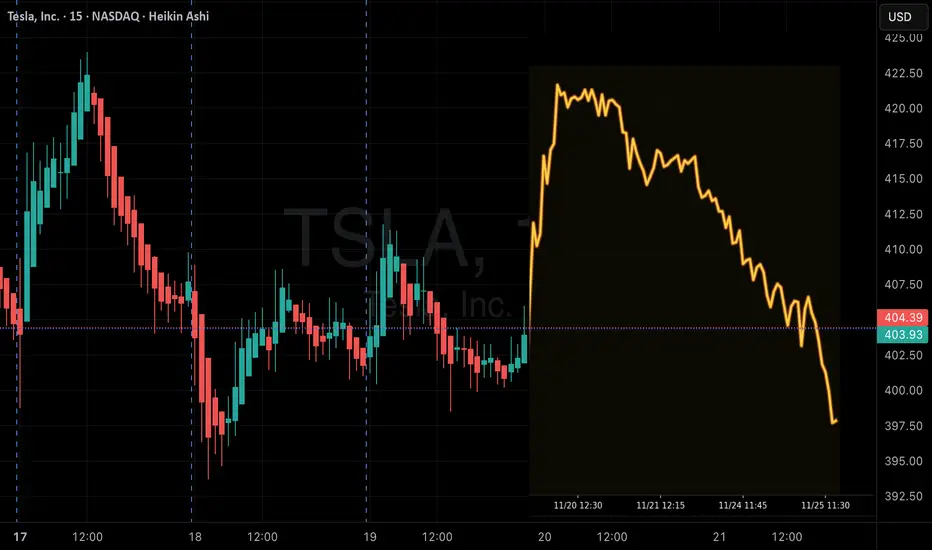
QuantSignals V3 | TSLA High-Probability Weekly PUT TradeTSLA QuantSignals V3 – Weekly PUT Trade (2025-11-19)
Trade Signal:
Direction: BUY PUTS (Short)
Strike Price: $402.50
Entry Range: $8.35–$8.45 (mid $8.40)
Target 1: $12.60 (50% gain)
Target 2: $16.80 (100% gain)
Stop Loss: $5.88 (30% risk)
Expiry: 2025-11-21 (2 days)
Position Size: 3% of portfolio
Confidence: 65% (Medium)
Market Analysis:
Trend: NEUTRAL overall, short-term bearish bias (-0.67% predicted decline)
Price Action: Current $401.88, trading below VWAP $406.38
Technicals: EMA bearish, weekly momentum neutral (-0.61%), key support $380.97, resistance $432.75
Options Flow: Put/Call Ratio 1.39, institutional put-heavy positioning
Volatility: Rising VIX (19.83 vs 18.44 avg) indicates increasing market nervousness
News Sentiment: Mixed; positive news not lifting price, sector skepticism present
Competitive Edge:
Katy AI downside prediction combined with strong bearish options flow and technical weakness
$402.50 strike balances risk/reward near-the-money
Mid-week entry captures potential late-week volatility
Tight stop loss mitigates gamma risk
Risk Notes:
2-day expiry creates high gamma and time decay risk
Rising VIX may increase premiums but also volatility
Moderate conviction requires careful position sizing
Monitor actively through expiration
325 and then 800?Shaping up nicely to double next year. Most likely it will go down to 325 and if it can hold 325 then 800 coming next year most likely. If it looses 325 on a monthly basis then all bets are off.
Happy Trading. Not a financial advise.

Tesla at Key Support Level & Wins Ride-Hailing Permit in ArizonaTesla has secured a Transportation Network Company (TNC) permit in Arizona, marking another strategic step toward launching its robotaxi service. While the permit does not authorize Tesla to operate a fully driverless ride-hailing network, it grants the company legal approval to function as a ride-hailing operator under state regulations. This follows Tesla’s earlier approval in September to test autonomous vehicles with a safety driver on Arizona roads.
According to the Arizona Department of Transportation, Tesla applied for the permit on November 13 and met all regulatory requirements, receiving approval on November 17. The TNC license positions Tesla to begin laying operational groundwork for its robotaxi ambitions, fleet structure, service protocols, pricing models, and state compliance, while it continues advancing autonomous capabilities through its Full Self-Driving (FSD) platform.
Arizona has long been considered one of the most autonomous-friendly states, hosting early deployments from Waymo, Cruise, and other AV developers. Tesla’s entry expands the competitive landscape and brings its robotaxi vision closer to reality, though safety-driver supervision remains mandatory for now. The new permit reinforces Tesla’s strategic push into transportation services, signaling that regulatory pathways for FSD-enabled ride-hailing are steadily opening.
Technical Outlook
Tesla’s chart shows price pulling back into a key ascending trendline that has supported the uptrend since April. The current zone around $401 is a strong demand area, aligning with trendline support
A bounce from this level sets Tesla up for a potential continuation toward the major resistance at $488. A clean break above that level would confirm a medium-term bullish extension. RSI remains neutral, suggesting room for upside if buyers defend current support.
If the trendline fails, Tesla could retest deeper support near the $330–$345 range. For now, momentum favors a rebound as long as the trendline holds.
Tesla: DownwardShortly after our last update, Tesla experienced noticeable downward momentum, initially entering our previously magenta alternative target zone, which has already been stopped out. We currently consider the green wave complete, and the alternative target zone has been deactivated and grayed out. However, there's still a chance the stock could rise sharply, confirming an ongoing upward trend. If this alternative scenario, which has a 35% probability, plays out, we would mark blue wave alt.(II) as complete and expect gains above the resistance at $509.50 and $532.92 within a magenta upward impulse. Primarily, we anticipate further sell-offs and expect the regular wave-(II) correction low to occur first in our green target zone between $157.88 and $46.70. This green zone could potentially be suitable for long entries, protected by a stop 1% below the zone's lower edge.

TSLA Losing Momentum – Uptrend Breakdown RiskLooking at the current picture, both news flow and technical signals show that Tesla is entering a challenging phase. A series of recent negative developments — from large funds selling off, to declining sales in China, and Elon Musk potentially taking a loss on his latest share purchases — have clearly shaken market confidence. As a result, TSLA has been under continuous selling pressure, and its price action has weakened significantly compared to the previous bullish period.
On the chart, the resistance area around $447 continues to act as a “steel ceiling”: every touch has been firmly rejected. The recent strong bearish candle pushed TSLA back into the Ichimoku cloud, breaking the short-term upward structure. More importantly, the price is now at risk of losing the uptrend line that has held since April, indicating that medium-term bullish momentum is fading.
If TSLA fails to reclaim the $430–$447 zone in the next recovery attempts, a drop toward $329 becomes a very realistic scenario — this level has been a major support in the past and aligns with the lower boundary of the primary trend channel.

$TSLA Update NASDAQ:TSLA has a solid finish today during the market stress test.
Please watch the recording for levels and price targets.
Cheers.

TESLA FREE SIGANL|SHORT|
✅TESLA Price reacts off a premium-priced supply block, showing bearish displacement and a clean break in structure. Retracement into the imbalance may fuel continuation lower.
—————————
Entry: 408.98$
Stop Loss: 424.00$
Take Profit: 392.00$
Time Frame: 4H
—————————
SHORT🔥
✅Like and subscribe to never miss a new idea!✅

TSLA: one more leg down potential NASDAQ:TSLA
Watching for one more leg down into the 430–400 mid-term support zone to potentially complete the corrective structure, if price remains unable to break out above the October/November highs.
Chart:
Alternatively, if price manages to break-out and stay above above recent resistance, odds favor continuation to 555-630 resistance zone.
Chart:
Previously:
• On macro bottoming potential (Jun 6):
tradingview.com
• On support (Sep 19):
• On mid-term support (Oct 7):

TESLA Technical Analysis! BUY!
My dear friends,
Please, find my technical outlook for TESLA below:
The price is coiling around a solid key level - 404.39
Bias - Bullish
Technical Indicators: Pivot Points Low anticipates a potential price reversal.
Super trend shows a clear buy, giving a perfect indicators' convergence.
Goal - 426.96
About Used Indicators:
The pivot point itself is simply the average of the high, low and closing prices from the previous trading day.
Disclosure: I am part of Trade Nation's Influencer program and receive a monthly fee for using their TradingView charts in my analysis.
———————————
WISH YOU ALL LUCK

TSLA BULLISH BIAS RIGHT NOW| LONG
TSLA SIGNAL
Trade Direction: short
Entry Level: 404.30
Target Level: 433.84
Stop Loss: 384.55
RISK PROFILE
Risk level: medium
Suggested risk: 1%
Timeframe: 5h
Disclosure: I am part of Trade Nation's Influencer program and receive a monthly fee for using their TradingView charts in my analysis.
✅LIKE AND COMMENT MY IDEAS✅

TSLA 1D: bounced at 380, now 412 decides if 530 is on the tableTesla pulled back precisely into the 380 area, lining up with the 0.5 Fibonacci retracement and the daily trendline, and bounced, confirming 360–380 as a key buy zone. This region combines the prior breakout range, trendline support and fresh accumulation. The next critical step for bulls is a clean breakout and hold above 412 dollars - the main resistance of the recent corrective leg and the local cap for the last swing. A sustained move above 412 unlocks room toward 450 and then the major upside target near 530 within the broader ascending channel.
Company: Tesla is the global leader in EVs, battery systems and energy solutions, combining manufacturing, software, autonomous driving and large-scale storage infrastructure.
Fundamentally , as of November 16, Tesla is in a transition phase: auto margins are lower than during the previous peak cycle due to price cuts and stronger competition, yet volume growth, scaling of the energy segment and improved factory efficiency help to stabilize profitability. Cash flow remains strong, the balance sheet is solid, energy and services are taking a larger share of total revenue, and long-term expectations are anchored by FSD progress and the robotaxi roadmap. For the market, Tesla is still the flagship brand of the EV sector, and any signs of margin stabilization tend to bring institutional money back quickly.
Tactically , as long as price holds above 380 and doesn’t break below 360, the retest-before-continuation scenario remains the base case. A confirmed breakout above 412 becomes the technical trigger toward 450 and then the 530 target along the upper channel. A loss of 360 would shift the picture into a deeper correction, but the current structure still looks more like a pause within an uptrend than a top.
Tesla loves to scare everyone with sharp red candles, then casually act like it was just warming up for the next leg.
