TSLA Roadmap: $563 ABCD Compl → Bat Harmonic → $631 Three-DriveTesla (TSLA) appears to be completing its final impulsive wave toward the $563 region, which also aligns with the D point completion of the ABCD harmonic pattern.
Once this move is finished, the expectation is for a corrective phase that forms a Bat harmonic. This retracement would also work to fill in the untested gaps left behind during the recent rally, with a potential bottom around the 78.6% Fibonacci level.
From there, the next bullish leg could initiate, targeting the 127.2% extension at $631. This move would not only confirm the harmonic reversal but also complete a larger Three-Drive pattern that originates from the initial ABCD structure.
Key Levels to Watch:
ABCD Harmonic D point: ~$563
Bat Harmonic completion zone: ~78.6% retracement
Next rally target: $631 (127.2% extension, Three-Drive pattern confirmation)
Invalidation Scenarios:
A clean breakout above $563 without corrective rejection would invalidate the Bat harmonic setup and suggest an extended bullish run.
A failure to hold above ~$367 (channel/structure support) would weaken the harmonic roadmap and risk a deeper bearish continuation instead of a Three-Drive completion.
This roadmap suggests a critical short-term top before a deeper correction sets the stage for a much larger rally.
Tesla Motors (TSLA)

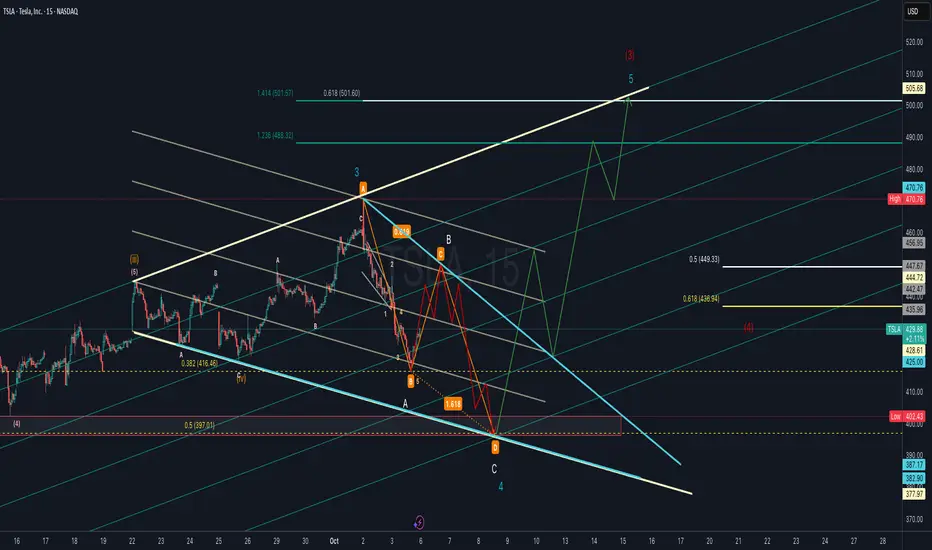
TSLA Elliott Wave Count with ABC Harmonic or Flat Corrective Tesla (TSLA) is forming a potential Wave 4 correction that aligns with an ABC harmonic structure. Price action suggests a possible deeper retracement into the 0.5–0.618 Fibonacci support zone (436–449 area) before resuming its larger uptrend.
If Wave 4 completes near the harmonic “D” zone (highlighted support box), the next leg higher could target the 1.236–1.414 Fibonacci extensions around 488–501, in line with Wave 5 projection.
Key levels to watch:
Support: 436.9 (0.618 retrace), 425 psychological, 397 strong support.
Resistance: 444.7, 470.8 (previous high), 501–505 (Wave 5 target).
Bullish scenario: Wave 4 completes soon, leading to a strong Wave 5 breakout towards 500+.
Bearish scenario: Breakdown below 425–397 support could invalidate the bullish count and extend correction lower.
The other possibility is that it is actually unfolding a flat correction in Wave 4 after completing Wave 3 near the recent high. The structure suggests price may continue to consolidate within the corrective channel before setting up the next impulse leg.
Bullish scenario: Flat correction completes, setting the stage for Wave 5 rally toward 490–505.
Bearish scenario: Breakdown below 397 invalidates the bullish count and signals deeper retracement.
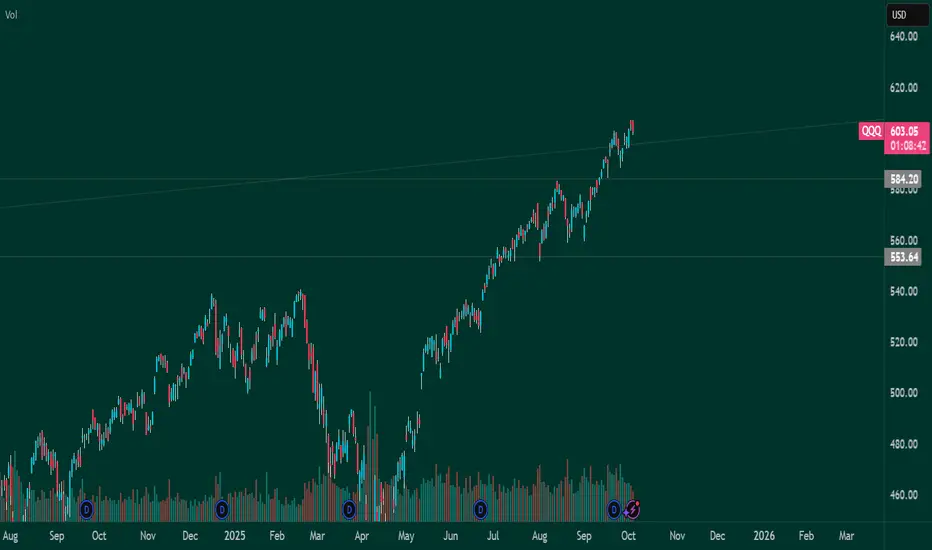
Small Correction 5-10% ?Looks like we will have a small correction hopefully not more than 10%. It could be a good time to buy the dip in nvda, orcl, crwd etc.
Happy trading !!
Not a financial advice.
$TSLA: Let The Rally Speak For Itself - 9/16/2025Based on the analysis, it’s confirmed that NASDAQ:TSLA has initiated a new rally following the completion of a lengthy and complex corrective structure at $288.
The stock bounced twice off the 50-week moving average, signaling strong support as the correction neared its end.
Due to the depth and complexity of the structure, Wave 3 is expected to unfold with high momentum, potentially delivering an explosive rally. Key upside targets are displayed in the chart — we’ll be watching closely to see how price reacts at those levels.
📚 Note: The internal structure and labeling were intentionally left visible in the chart for educational purposes. This is especially useful for traders interested in Modern Trading Algorithms and their structural variations.
Happy Trading, and let the rally speak for itself. 🚀

Tesla - Here we goooooo!🚗Tesla ( NASDAQ:TSLA ) is finally breaking out:
🔎Analysis summary:
Finally, after a consolidation of four years, Tesla is attempting another all time high breakout. With the bullish triangle coming to an end, bulls are dominating this stock. It just comes down to the next couple of months but a triangle breakout remains far more likely.
📝Levels to watch:
$400
SwingTraderPhil
SwingTrading.Simplified. | Investing.Simplified. | #LONGTERMVISION

Tesla (TSLA) Share Price Rises Ahead of Earnings ReportTesla (TSLA) Share Price Rises Ahead of Earnings Report
On 16 September, we noted signs of a strong market for Tesla (TSLA) shares, including:
→ The price remaining above the psychological level of $400;
→ Reaching the highest levels since late January.
We also identified an ascending channel and suggested that the long-term outlook remained optimistic, although a correction could not be ruled out.
Since then, TSLA shares have stabilised near the upper boundary of the channel, holding above the $400 level. On Friday, they were among the market leaders, rising by more than 4%. This brings the gain since the start of September to around +30%.
Why Are TSLA Shares Rising?
Key factors supporting a bullish outlook include:
→ Sentiment ahead of the quarterly Production and Deliveries report, expected this week. According to recent forecasts, actual figures could exceed expectations (although still showing a decline compared to the previous year).
→ Target price upgrades. Dan Ives of Wedbush, one of Tesla’s most prominent bulls, last week raised his target price to $600 — the highest on Wall Street — citing substantial potential in AI and robotaxi development.
→ The “Musk factor”: Discussions around Elon Musk stepping away from politics are seen as a long-term positive driver.
Technical Analysis of TSLA Shares
The ascending channel remains intact. However, the chart suggests that the upper boundary now acts as resistance — unsurprising given the exceptional gains in September (noting that TSLA’s price has doubled since its yearly low). A slowdown in momentum is signalled by a bearish divergence on the RSI indicator.
Resistance at the upper boundary is further reinforced by a strong bearish reversal from late 2024. A similar pattern was recently observed when the price struggled to break above the bearish reversal zone at $345–355, resulting in an extended sideways movement in August and early September.
By analogy, the $445–465 zone may also act as resistance — meaning a correction remains a plausible scenario. For example, TSLA stock price could pull back to test the psychological $400 level, which is supported by the median of the current channel.
This article represents the opinion of the Companies operating under the FXOpen brand only. It is not to be construed as an offer, solicitation, or recommendation with respect to products and services provided by the Companies operating under the FXOpen brand, nor is it to be considered financial advice.

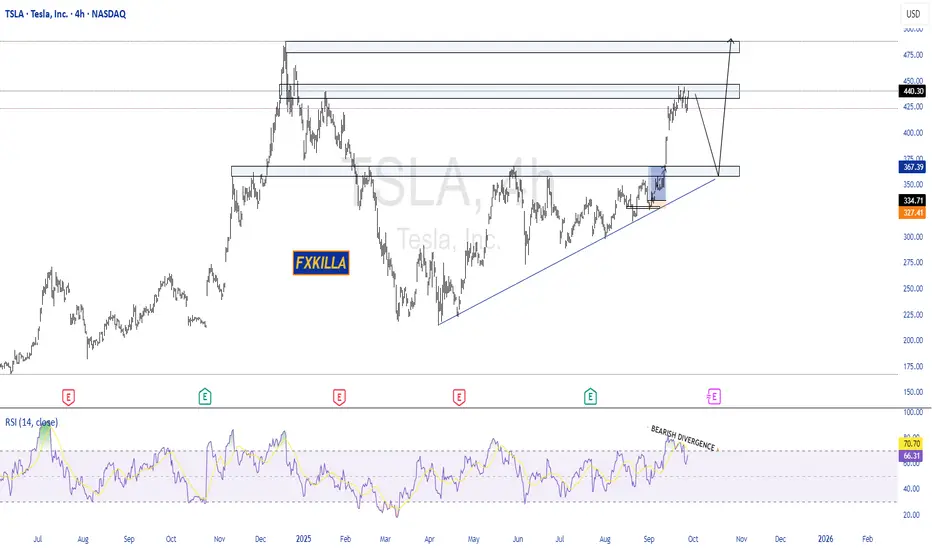
TESLA HIGH PROBABILITY SETUPS SOON!!!🚨 TESLA HIGH PROBABILITY SETUPS 🚨
* Here We Can See The Next Potential Moves For TSLA Coming Hours/Days.
* Keep Your Eyes Close On Your Trading Positions.
* Happy PIP Hunting Traders.
FXKILLA.
TSLATESLA looks bullish early part of this week, 470+ is the target level.
Disclosure: We are part of Trade Nation's Influencer program and receive a monthly fee for using their TradingView charts in our analysis.
TESLA: Short Trading Opportunity
TESLA
- Classic bearish formation
- Our team expects pullback
SUGGESTED TRADE:
Swing Trade
Short TESLA
Entry - 440.32
Sl - 443.84
Tp - 432.53
Our Risk - 1%
Start protection of your profits from lower levels
Disclosure: I am part of Trade Nation's Influencer program and receive a monthly fee for using their TradingView charts in my analysis.
❤️ Please, support our work with like & comment! ❤️

Are We About To See A HUGE Change In The Market...Stock Market Forecast | QQQ SPY CME_MINI:NQ1! CME_MINI:ES1! SP:SPX NASDAQ:NDX
Mag 7 | TSLA NVDA AAPL AMZN META MSFT GOOGL

Tesla bullish 📊 NASDAQ:TSLA Weekly Chart – Sept 27, 2025
Tesla is pushing higher, now trading at $440.40 (+4.02%), challenging major resistance levels.
🔴 Key Resistance Zones:
$488–$495 → Multi-top rejection zone
$580 → Macro resistance (2021 highs)
Watch for potential rejection unless strong volume confirms breakout
🟢 Strong Support Levels:
$420 / $400 / $390 → Key short-term demand
$332 / $322 → Previous resistance flipped to support
$288 / $259 / $247 → High confluence support cluster
Long-term trendline still intact (white diagonal line)
⚠️ If $488 breaks, TSLA could revisit $580
✅ Holding $420–$400 keeps bulls in control
📉 Below $332 could trigger broader pullback
#TSLA #Tesla #Stocks #Trading #TechnicalAnalysis #Investing #NASDAQ

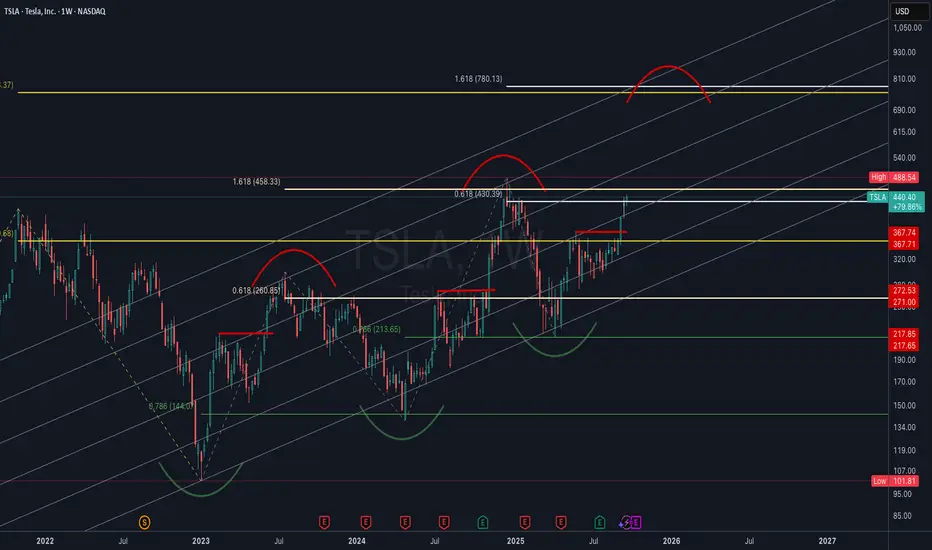
TSLA Weekly | Log Channel Analysis with Fibonacci ConfluenceThis chart presents Tesla (TSLA) on the weekly timeframe, plotted in logarithmic scale using a custom trend channel (not a pitchfork). The analysis combines price structure with key Fibonacci retracement and extension levels to highlight major inflection points in Tesla’s long-term trend.
Channel Structure: The log channel has consistently guided price swings, showing respect for both upper and lower boundaries across multiple cycles. This provides a framework for projecting potential tops and bottoms.
Fibonacci Confluence:
• Price is currently reacting around the 0.618 retracement ($430) from the previous major swing, a historically significant level for Tesla.
• Upside targets align with the 1.618 extensions ($753–$780), creating a strong confluence zone for a potential long-term resistance.
• Key downside supports sit at $367, $272, and $218, each coinciding with fib retracements and historical pivot zones.
Market Structure: The chart highlights repeating rounded top and bottom formations, suggesting cyclical behavior in Tesla’s price action. Rounded bottoms have historically marked accumulation zones, while rounded tops have aligned with distribution phases.
Current Outlook: After reclaiming the mid-channel region and pushing through significant resistance, Tesla is now at a pivotal stage. A confirmed breakout above $488 could open the path toward the higher channel range and eventual fib targets. Failure to hold $430, however, risks a retrace back to $367 or lower channel support.
TESLA Set To Fall! SELL!
My dear friends,
TESLA looks like it will make a good move, and here are the details:
The market is trading on 440.30 pivot level.
Bias - Bearish
Technical Indicators: Supper Trend generates a clear short signal while Pivot Point HL is currently determining the overall Bearish trend of the market.
Goal - 432.72
Recommended Stop Loss - 444.15
About Used Indicators:
Pivot points are a great way to identify areas of support and resistance, but they work best when combined with other kinds of technical analysis
Disclosure: I am part of Trade Nation's Influencer program and receive a monthly fee for using their TradingView charts in my analysis.
———————————
WISH YOU ALL LUCK

SPY WEEKLY 26 SEP 2025 This is the price action analysis for SPY . I have clearly discussed the levels and have touched on psychology side as well. If you have any doubts, feel free to leave a message.
NOTE: DONT TRADE AS OPTIONS AS MARKET IS ALL TIME HIGH

Can $TSLA push to new highs?TSLA looks like it's still bullish as it retested this support level and is now pushing back above it.
I think it's possible that we see a large move, potentially up to the $600 levels, but I've marked off key resistances to the upside as well incase we stop before that.
Let's see how it plays out over the coming weeks.

SPY SEP 25,2025 READ NOTESSpy can still hit $676 but as a trader my job is to understand the risk then put Stop loss & then trade.
So, I am long with stocks only:
SL @$653 with a target of $676.
The level is pretty average & most of the traders who learnt price action from me won't even call this a level. If you don't understand a level, then don't trade it(simple).
I initiated the long trade when I posted the chart in the morning.
If it hits my SL then il accept and move on. I am waiting for this week to close &will publish the video analysis tomorrow after market close.
NOTE: DO NOT TRADE OPTIONS

TSLA LONG SWING READ NOTES 25 SEP 2025I have bought some Tesla stocks now around $424 for swings. I know market is all time high & Tsla can do $450 here. I am just taking market over all support which is again very poor.
This is an average trade
If you are not confident dont trade.
I have gone long with stocks only

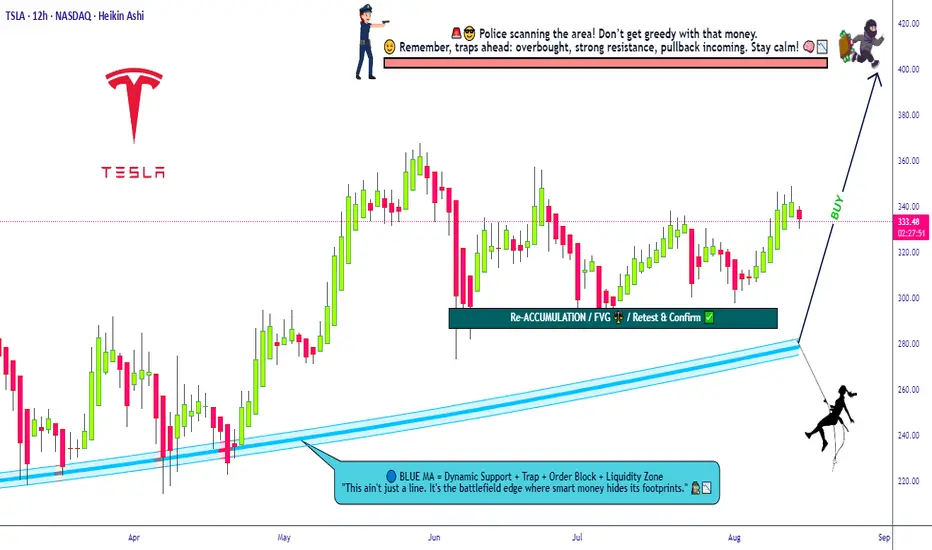
Bullish Tesla Mission Activated – Grab the Loot Now!💎🚨 TESLA STOCK MARKET HEIST PLAN 🚨💎
🕵️♂️ Attention All Thief OG’s, Chart Ninjas & Wall Street Pickpockets!
We’re gearing up for a full-blown Tesla loot mission — bullish, layered, and locked on target! 📈💰
🎯 Plan:
Bullish Layered Entry Strategy 🤑
We’re stacking multiple BUY LIMIT layers like a pro bank job:
💵 (330.00) | 💵 (320.00) | 💵 (310.00) | 💵 (300.00)
(You can add more layers if you want to steal bigger)
🛑 Stop Loss:
The Thief’s SL @ 280.00 💣
📌 Adjust to your own risk — every crew member knows their escape route!
Remember: A good thief never leaves fingerprints, only profits.
🏆 Target:
🚓 Police barricade at 420.00 — better vanish before the sirens!
🎯 Secure the main loot at 400.00 before making a clean getaway.
💡 Thief Strategy Tip:
Layering lets you grab more loot if price dips — like breaking into multiple vaults.
Keep your disguise on and watch the charts — Wall Street guards are always watching. 👀🖤
⚠️ Warning for the Crew:
Major news drops = cops on every corner.
Stay hidden, trail your stops, and protect the stash.
💥 Smash the ❤️ LIKE button if you’re in for this Tesla mission!
📌 Follow the crew for more Thief Trader blueprints — next heist drops soon!
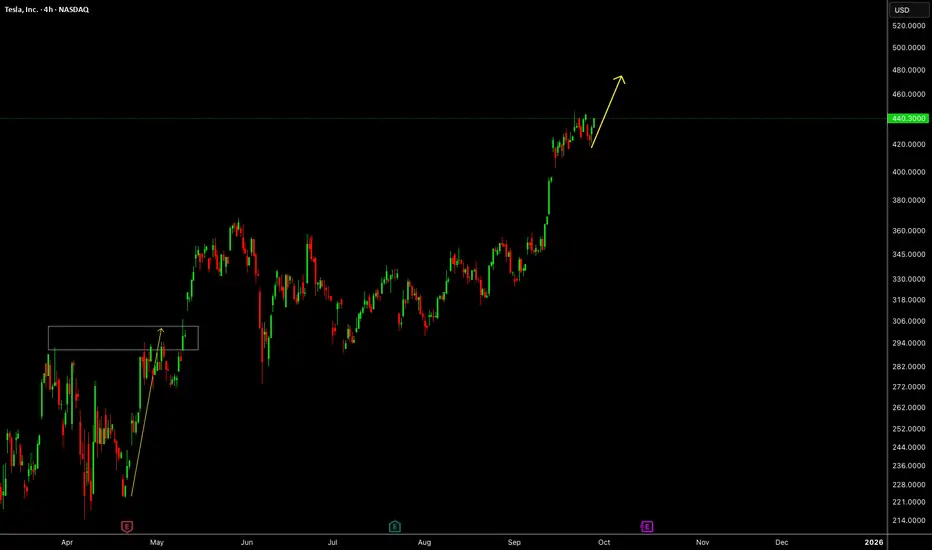
Will Tesla's stock price reach $600? Yes!
Hi my dears
I am at your service with Tesla stock analysis. This year and the following years, the stock growth trend will continue.
If you want to make big profits from the market, just follow my analysis.

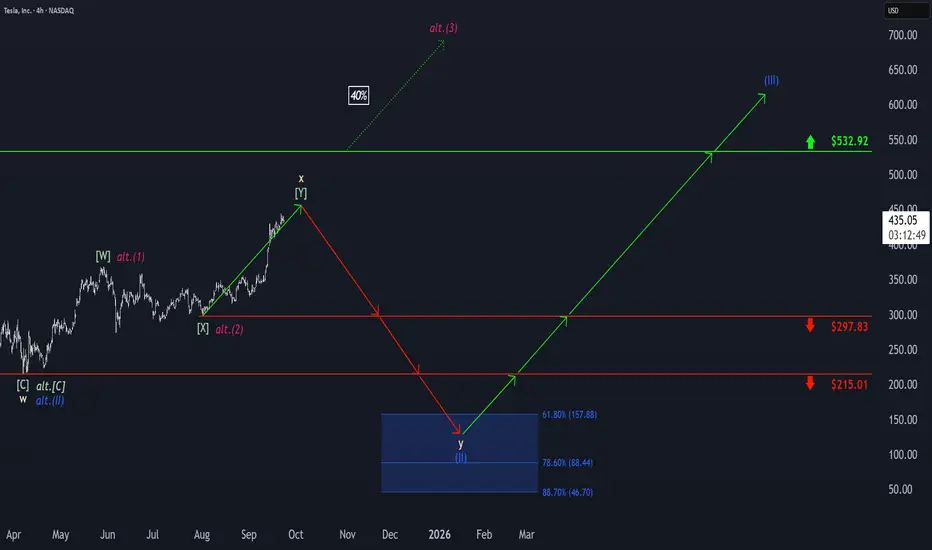
Tesla: Upward Momentum PersistsTesla’s upward momentum has persisted, with the beige wave x still having some room to run. However, we expect the corrective top to form well below resistance at $532.92, which should then trigger the final selling phase within the broader correction. Ultimately, wave y is projected to approach our blue Target Zone between $157.88 and $46.70, completing the large blue wave (II) in that range. Afterward, we anticipate a new wave (III) uptrend. That said, there remains a 40% probability that price may not reach the blue zone, as wave alt.(II) could have already completed at $215.01. In this scenario, TSLA would already be developing a magenta upward impulse and could break above the $532.92 level directly and sustainably.
Ferrari (RACE) Catalyst Scorecard AND 2026 OutlookFerrari (RACE) Catalyst Scorecard AND 2026 Outlook
________________________________________
1. 🏎 New Model Launches & Portfolio (9/10)
Ferrari’s 2023–26 lineup is packed with high-end launches. Recent additions include the Roma Spider, SF90 XX, 296 Challenge, and 499P Modificata. Demand for the Purosangue SUV has been overwhelming, with early orders suspended and deliveries backlogged into 2026. Coming next: the 849 Testarossa plug-in hybrid deliveries H2 2025/Q1 2026 and the F80 hybrid hypercar limited series, ~1,200 hp. These models should sustain ASP growth and keep exclusivity intact.
________________________________________
2. 🔌 EV & Hybrid Transition (9/10)
Ferrari is phasing electrification deliberately. After hybrids like the SF90 and 296, Ferrari will unveil its first fully electric car in October 2025 deliveries start 2026. A new “e-building” in Maranello is ready to expand capacity by ~6,000 units annually. Ferrari is building in-house motors and batteries while still pledging to keep V12 ICE alive as long as possible. This balance between heritage and compliance ensures both regulatory cover and customer enthusiasm.
________________________________________
3. 💰 Pricing Power & Personalization (9/10)
Ferrari’s bespoke strategy fuels unmatched pricing power. Recent results showed hundreds of millions in incremental profit from high-priced halo models Daytona SP3, 499P Modificata and personalization demand. Personalization now represents nearly one-fifth of revenues. Carefully managed price hikes on core models, combined with ultra-limited editions, cement Ferrari’s position as the most profitable automaker per unit.
________________________________________
4. 🌍 Global Demand & Wealth Resilience (8/10)
About three-quarters of Ferrari’s sales go to repeat customers, and nearly half to collectors owning multiple Ferraris. The expanding global wealthy class adds to the demand pool. Ferrari’s sales are well balanced across regions; China is only ~10%, limiting exposure to that slowdown. Wealth concentration in the U.S., Europe, and the Middle East provides resilience against macro shocks.
________________________________________
5. 📈 Order Backlog & Supply Discipline (8/10)
Ferrari’s order book is sold out through 2026/early 2027. The company deliberately caps production e.g. Purosangue SUV shipments limited to ~20% of total to preserve scarcity. This ensures pricing discipline and supports margin expansion. With supply tightly managed, Ferrari avoids the discounting and inventory overhangs that plague mass-market automakers.
________________________________________
6. 💵 Shareholder Returns & Capital Allocation (7.5/10)
Ferrari’s capital return story is strong. Annual dividends and share buybacks together exceed €750 million. The €2 billion buyback program through 2026 is ongoing. At the same time, Ferrari invests aggressively in R&D e-building, hybrid/EV systems without margin erosion. The balance between shareholder distributions and future growth spending is a key investor confidence driver.
________________________________________
7. ⚖ U.S./EU Tariffs & Trade (7/10)
A recent U.S.–EU deal cut auto tariffs, enabling Ferrari to avoid planned price hikes in the U.S. and improving margins slightly. Regulatory pressure on emissions is real, but Ferrari’s measured EV roadmap addresses compliance. Trade risks are less critical for Ferrari than for volume automakers, but favorable deals add incremental margin upside.
________________________________________
8. 🏆 Brand & Competitive Moat (9/10)
Ferrari’s brand power is unmatched. It combines scarcity, desirability, and F1 heritage to justify luxury-goods multiples more in line with Hermès than Porsche. The brand enables Ferrari to command unmatched ASPs and maintain margins north of 25%. Ferrari’s intangible moat protects it against both cyclical demand dips and competitive threats.
________________________________________
9. ⚔ Competition & Luxury Peers (6/10)
Direct competitors—Lamborghini, McLaren, Rimac—lack Ferrari’s scale, heritage, and breadth. Luxury EV entrants pose some risk, but Ferrari’s controlled rollout and customer loyalty limit the threat. Peer comparisons place Ferrari firmly alongside high-end luxury brands, not mass-market automakers, underscoring its unique positioning.
________________________________________
10. 📉 Macro & Economic Cycle (6/10)
Ferrari is somewhat insulated but not immune. A sharp global downturn or wealth destruction could dampen orders. However, its backlog, exclusivity, and personalization revenue provide cushions. Even in recessions, Ferrari can slow production and still maintain pricing power.
________________________________________
Catalyst Scorecard
Rank Catalyst Score
1 New Model Launches & Portfolio 9.0
2 EV & Hybrid Strategy 9.0
3 Pricing Power & Personalization 9.0
4 Brand & Competitive Moat 9.0
5 Global Demand & Wealth Trends 8.0
6 Order Book & Supply Discipline 8.0
7 Shareholder Returns 7.5
8 U.S./EU Tariffs & Trade 7.0
9 Competition & Luxury Peers 6.0
10 Macro & Economic Cycle 6.0
________________________________________
Valuation Scenarios
• Bull Case ($700–$750): Successful EV debut, robust demand for new models, strong margins, continued buybacks.
• Base Case ($580–$620): Order backlog supports steady revenue growth, modest EV contribution, pricing discipline.
• Bear Case ($350–$400): Macro downturn or execution missteps lead to cancellations and lower margins.

Huge Dark Pools and Prints... Will this time be Different?Stock Market Forecast | Mag 7 TSLA NVDA AAPL AMZN
QQQ CME_MINI:NQ1! CME_MINI:ES1! SP:SPX NASDAQ:NDX stock market Forecast

$NVDA - $280 PT WEEKLY BULL FLAGStay Positioned with Nvidia's Weekly Bullish Chart. A Bull Flag is setting up with an imminent breakout. Long/Short Ratio is also very bullish at almost 60%. Price Target is $280. Remember Pole length of the flag = extended measured move at the breakout point of the flag.
