The Trade Desk Inc | TTD | Long at $27.16Technical Analysis
The stock price for The Trade Desk NASDAQ:TTD entered my selected "crash" simple moving average area (green lines). This area is often a location where algorithmic buying / share accumulation occurs. This zone currently extends to $21 and I anticipate further declines to (a minimum) $24-$25 to close the open price gap within the "crash" area. While this could signal a short-term bottom, I am very weary of the existing price gaps that extend into the "major crash" simple moving average area (gray lines). These gaps, between $3 and $10, could be filled via a major economic recession announcement. Regardless of bottom predicting, a starter position was made at $27.16 and another entry is planned near $21-$22 if the price reaches that low. A major crash flash drop post-earnings in late February is a possibility if the company shows continued signals of economic weakness or world turmoil emerges.
Growth
As of this writing, annual earnings-per share and revenue growth starts again after 2025 and continues to rise into 2028
Health
Debt-to-equity: 0.1 (very healthy)
Quick ratio / short-term debt: 1.7 (very good)
Altman's Z Score / bankruptcy risk: 5.4 (very low risk)
Action
Pending no major economic recession announcement, NASDAQ:TTD entered a personal buy zone at $27.16. The stock price is now within my "crash" simple moving average zone with further entries planned in the $20s - as long as fundamentals stay strong. If the economy really shifts, this could absolutely trickle down into the "major crash" area under $10. Never say never. Time will tell.
Targets into 2028
$35.00 (+28.9%)
$50.00 (+84.1%)
TTD

Generational Buy Opportunity? Today cloud stocks, CBOE:IGV saw one of the nastiest declines its ever seen.
IGV hit its most oversold level on the daily chart since 2011.
This either marks a generational buy opportunity or a really nasty multiyear bear market.
Many software stocks like PYPL, MSFT, NOW, ORCL, TTD, SNOW, ADBE cannot seem to catch a bid.
There's so many quality names in this basket that would would favor a turnaround story.
We opened 2 new option positions today and added some common shares to the long term port.
it might take some time for these stocks to firm up but lots of valuations are looking dirt cheap.

The Trade Desk (NASDAQ: TTD)The Trade Desk (NASDAQ: TTD) finds itself navigating a period of pronounced turbulence, underscored by a sudden and concerning leadership shuffle at the highest financial level. In a press release issued early Monday, the advertising technology company announced the immediate departure of Chief Financial Officer Alex Kayyal. The company provided no reason for his exit, which comes after an exceptionally brief tenure—Kayyal had joined The Trade Desk's Board of Directors in February 2025 and was appointed CFO just over five months ago, in August 2025. This marks the company's second CFO transition in less than six months, following the departure of longtime CFO Laura Schenkein in mid-2024, raising significant questions about stability within the C-suite.
To manage the transition, The Trade Desk has appointed Tahnil Davis as Interim CFO. Davis, the company's current Chief Accounting Officer, brings 11 years of institutional knowledge to the role, a factor CEO Jeff Green highlighted in an attempt to reassure stakeholders. In the same announcement, management sought to preempt concerns about operational or financial health by explicitly reaffirming its previously issued fourth-quarter 2025 guidance. Despite this move, the market reacted negatively, with shares falling sharply on the news. The abrupt nature of the departure, particularly its timing after the close of Q4 but before the earnings report, inevitably fuels speculation about potential undisclosed issues, even as the company insists its financial trajectory remains on track.
This leadership volatility compounds the existing challenges facing The Trade Desk. The company, once a paragon of consistent execution with a 33-quarter streak of meeting or exceeding guidance, has been in a perceived turnaround phase since stumbling early in 2025. CEO Jeff Green attributed the initial miss to "a series of small execution missteps," but the competitive landscape has grown increasingly fierce. Well-capitalized giants like Amazon are expanding their presence in the adtech space, leading some investors to fear The Trade Desk is losing ground. This sentiment is reflected in the stock's precipitous decline, which has fallen roughly 75% since the start of 2025, evaporating a significant portion of its market capitalization.
The reaffirmed Q4 guidance itself reveals underlying business pressures. The forecast calls for revenue of at least $840 million, representing year-over-year growth of at least 13%. This figure confirms a continued deceleration from the 18% growth posted in Q3 and 19% in Q2. While management points to tough comparisons against a politically charged 2024 advertising cycle, the consistent slowdown is a headwind for a stock traditionally valued on high growth expectations. Furthermore, the decision to merely reaffirm—rather than raise—guidance may disappoint investors hoping for a positive surprise to catalyze a recovery.
Beyond growth and leadership, The Trade Desk contends with a valuation that remains elevated despite the steep share price decline. With a price-to-earnings ratio hovering around 40, the stock still prices in a significant growth premium. For the investment to justify its current multiple, The Trade Desk must demonstrate a reacceleration of revenue growth in 2026, successfully navigate the intensified competitive landscape, and restore confidence in its management stability. The repeated CFO changes undermine that confidence, suggesting potential internal discord or disagreements over financial strategy, even if the official guidance remains unchanged.
From an investment strategy perspective, some traders are identifying potential entry and exit points based on the stock's severe correction. A defined "buy zone" is noted around the $20 level, which would represent a further significant decline from current prices and could be seen as a deep-value or contrarian entry point for those believing in the company's long-term foundational strengths in the digital ad-buying platform market. The suggested "take profit" target is set at $60, a level that would represent a substantial recovery but still remain far below the stock's historical highs, acknowledging the changed market perception and growth profile.
In summary, The Trade Desk is at a critical juncture. The abrupt CFO departure is a glaring red flag that amplifies existing concerns about slowing growth, fierce competition, and a premium valuation. While the reaffirmation of guidance offers a sliver of operational stability, it does little to address the core issues of leadership continuity and growth reacceleration. Investors are left to ponder whether this is a temporary run of bad luck and execution errors, as management suggests, or the beginning of a more fundamental decline in the company's competitive edge and cultural stability. The upcoming Q4 earnings report and the subsequent search for a permanent CFO will be pivotal events in determining the answer.

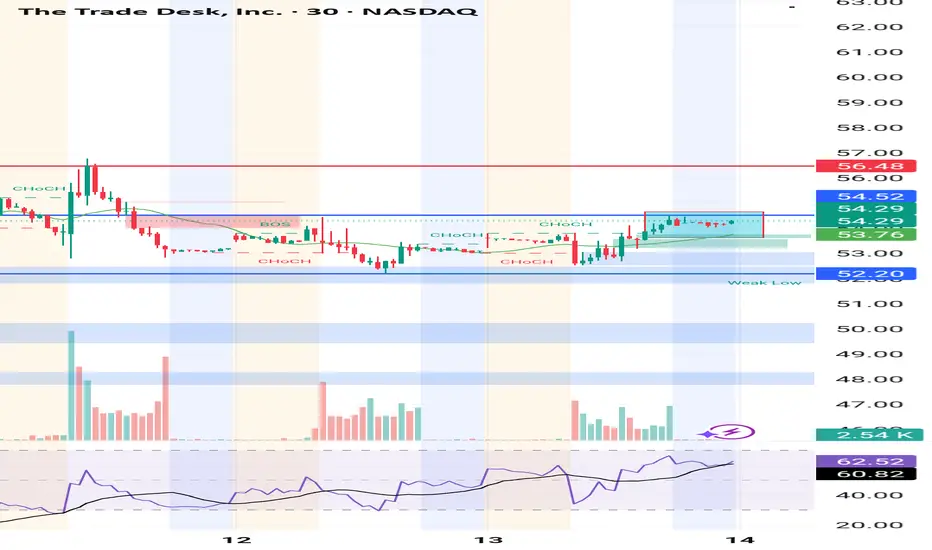
$TTD will the bear market end in 2026?Trade desk is trying to carve out a bottom.
Today we saw a nasty 3 bar surge hitting a final trend line of support.
If this bullish crossover of the 7/20 MA is to hold this is where the bulls need to step in.
Great risk to reward basis on a long.
Great fundamentals and balance sheet.

New All Time Highs - Bullish Price ActionToday the S&P500 made new all time highs.
It was a perfect breakout trend day and breakout.
Today we were able to trim and take profits on some of our long exposure.
We trimmed and sold NASDAQ:AMZN NYSE:SNAP NASDAQ:TEM NYSE:SMR
When the market is giving you all time highs and higher highs its always a good time to pair back longs.
Tomorrow we have some employment data that could gap the market higher.
If we can confirm a weekly chart breakout the probabilities of hitting 7k on spx is very likely.

Bullish Divergence Weekly TTD Trade #00020Bullsh div, V1 trigger, sR coming from oversold, both EFI's coming from < -3 ATR extremes
Montly flipping from red impulse to blue, but factor 3 is already blue.
TP 1: 44,49
TP 2: 49,86
E: 38,4
35,41
R/R: 1:2,2
I plan to enter around 38,4 with 80%, possibly more entries when it goes below
70% exit on TP1, 30% exit on TP2
Trade #00020

Bouncy Double DDs Pattern, $85 re-test?- NASDAQ:TTD is probably repeating the move it had earlier in the year.
- It's most likely going to re-test 85s , could happen as early as post earnings.
- Position size accordingly, not sure completely if it will play out as I am thinking but seems pretty likely.
- Let's go!
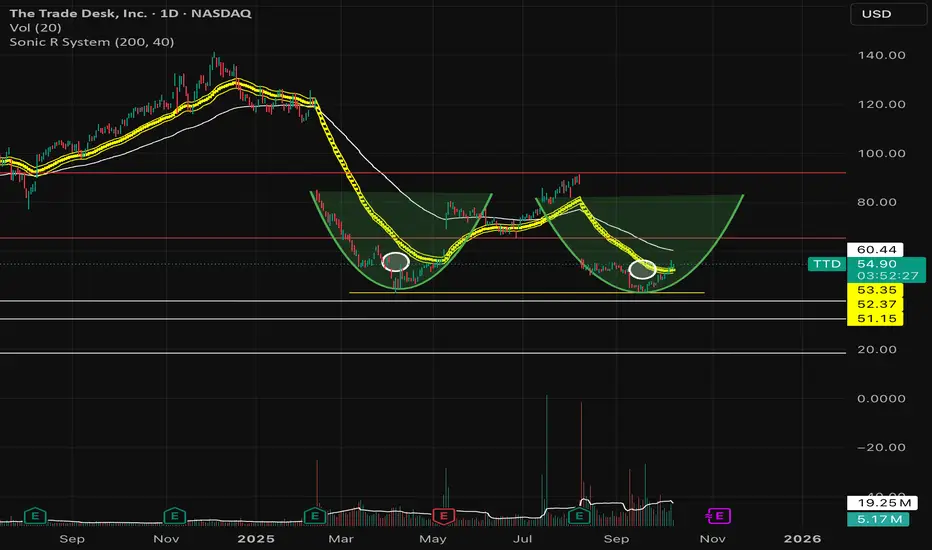
TTD – Potential Inverse Head & Shoulders Formation in PlayA potential inverse Head & Shoulders formation appears to be developing on The Trade Desk (TTD) daily chart.
The neckline sits near 55.56.
A break and close above 55.56 could trigger the pattern, with an upside target around 67.28 based on the measured move. The target aligned with both the 50% Fibonacci retracement and the Ichimoku Senkou Span B — a key confluence area.
Invalidation lies below 48.54; a breakdown there would negate the setup.
Focus on the chart, not the headlines.
(Educational idea – not financial advice.)

TTD (swingtrade) Earning plays, waiting for pullbacki have 2 option to entry TTD.
this set up to get entry when ttd earning.
TTD: AdTech Giant Amid #Altseason Buzz? $72 in Sight?TTD: Undervalued AdTech Giant Amid #Altseason Buzz? $72 in Sight? Price at $49.64 (+4.33%), tied to Q2 earnings beat and crypto ad surge on X/Reddit, undervalued with 53% upside to targets, questioning if data growth sparks rally.
Fundamental Analysis
EPS $0.83 TTM, revenue growth 23.18% TTM, expected EPS growth 40.25% 5Y, P/E 56.12; Graham formula IV $74.76, PEG 1.39 (near 1, undervalued per Lynch on growth), DCF suggests moat in programmatic ads; incentives align management with revenue beats, inversion highlights competition risks.
Positive:
18.2% 5Y revenue forecast.
Strong cash $1.69B.
Negative:
Volatility 7.2%.
Short-term sell signals.
SWOT Analysis
Strengths: Leading platform, high moat via data.
Weaknesses: High beta 1.08.
Opportunities: #Crypto ad expansion.
Threats: Market slowdowns.
Technical Analysis
Rebound from lows, neutral rating. Price: $47.14, VWAP N/A. Key indicators: RSI: 35/selling pressure.
MACD: Level (12,26) N/A.
Moving Averages: 5-day DMA 44.84.Support/Resistance: 43.79/45.27. Patterns/Momentum: Buy signal short-term. Bullish | Bearish. Scenarios and Risk Management Bullish: Break $45, DCA for $72 on earnings; second-order thinking sees ad surge amplifying gains.
Bearish: Below $43.79.
Neutral: Range trading.Risk Tips: Stops 5-10% below, diversify 5%, DCA dips.
Conclusion/Outlook
Bullish if growth sustains, lollapalooza from #Altseason boosts upside. Watch Q3 earnings. Fits adtech theme with #Crypto upside. Take? Comment!

TTD crashIn the long term, this stock is in a side cycle and after seeing the top, it starts moving towards the bottom and goes through the natural market cycle, but very fast and intense.
The first support area for this stock is $48-50 and if it encounters strong buyers, it will move towards $69 and after correction to $125-127.
But if the bottom area is broken correctly, the target of this big and fast drop will be a price return to 19.
Be with me to enter and exit on time
Every boost and follow is a double motivation to continue

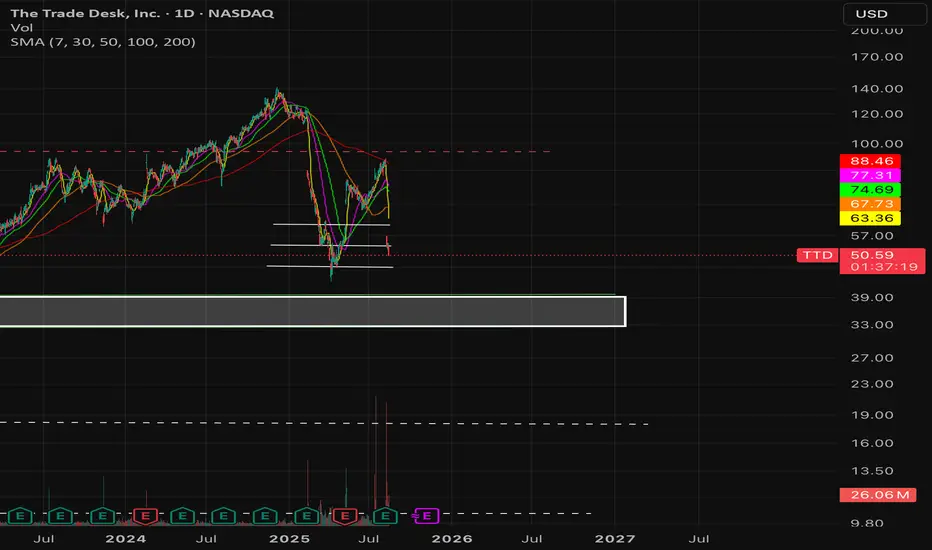
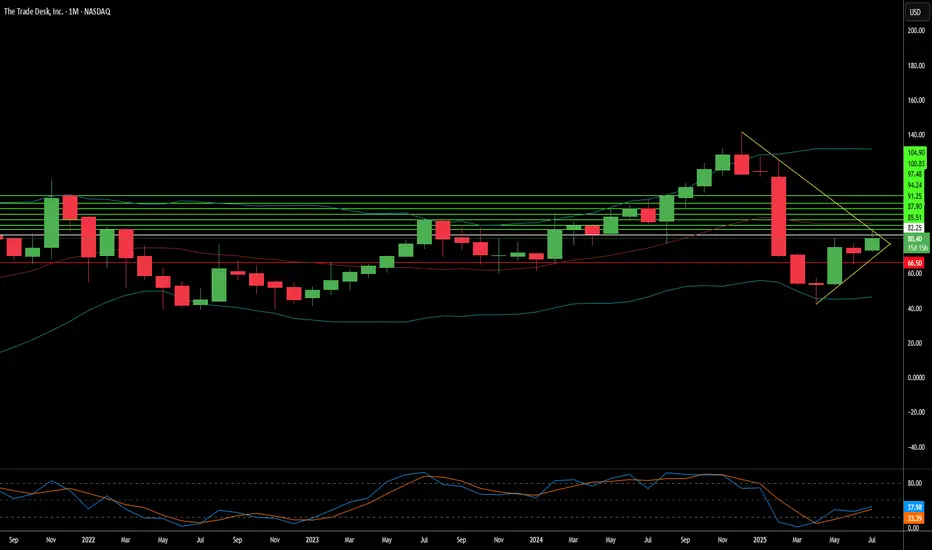
Multiple Compression of $TTD- NASDAQ:TTD is no longer the high flying market darling
- Growth has been coming down from high 30s to 20s and now to high teens. This calls for lowering multiple
Fundamentally,
Year | 2025 | 2026 | 2027 | 2028
EPS | 0.82 | 1.09 | 1.41 | 1.89
eps% | -49.61% | 32.28% | 29.08% | 34.47%
- This year eps is negative and in the future it's growing again therefore 2025 is a good year to accumulate NASDAQ:TTD at or close to fair value.
- A company growing eps 30%+ deserves a forward p/e of 30 as a base case
- Fair stock value (base case) with forward p/e of 30
Year | 2025 | 2026 | 2027 | 2028
fair value | 24.6 | 32.7 | 42.3 | 56
- Fair stock value (bull case) with forward p/e of 40
Year | 2025 | 2026 | 2027 | 2028
fair value | 32 | 43 | 56 | 75
- Fair stock value (bear case) with forward p/e of 20
Year | 2025 | 2026 | 2027 | 2028
fair value | 16 | 21 | 28 | 37.8
- Personally, I have started accumulating but ideally want to add significantly in that accumulation box I have highlighted in the chart.
- Note: I have linked my old posts where I shorted NASDAQ:TTD and went long NASDAQ:TTD
Breakout in process?Have been ranging, slight pullback and curl up at close.
If we break im looking for a test of the red line.
If that happens stop loss set.
Would like to close with profit and enter again at a retest of range top.
TTD Oversold Bounce Play — Call Option for Next Week🔥 TTD Oversold Bounce Play — Call Option for Next Week**
The Trade Desk (TTD) is deep in oversold territory (RSI daily 19.6, weekly 33.4) with 3.7x volume surge last week — signaling heavy institutional activity. While the macro bias leans bearish, a speculative bullish flow (call/put ratio 1.42) hints at a potential short-term rebound.
**🛠 Trade Setup:**
* **Instrument:** TTD
* **Direction:** CALL (LONG)
* **Strike:** \$59.00
* **Expiry:** 2025-08-15
* **Entry Price:** \$0.60
* **Profit Target:** \$1.20 (2x gain)
* **Stop Loss:** \$0.36
* **Size:** 1 contract
* **Entry Timing:** Market open
* **Confidence:** 65%
**📊 Key Factors:**
* Extreme oversold conditions
* Surge in weekly volume
* Speculative bullish options flow
* Risk of counter-trend move against broader bearish trend
**⚠ Risks:**
* Strong longer-term bearish momentum
* Low open interest = high volatility in premiums
---
**#TTD #TheTradeDesk #OptionsTrading #CallOptions #WeeklyOptions #OversoldBounce #BullishSetup #RSI #TechnicalAnalysis #TradingView #VolatilityPlay #SwingTrade #OptionsStrategy**

TTD Dropping HaRd / NoT DonE!Because the universe said so... We must be patient, unless executing B Wave for profit.
Note:
40% in oNe DaY!

The Trade Desk: Why the Sudden Surge?The Trade Desk (TTD) recently experienced a significant stock surge. This rise stems from both immediate market catalysts and robust underlying business fundamentals. A primary driver was its inclusion in the prestigious S&P 500 index, replacing Ansys Inc. This move, effective July 18, immediately triggered mandated buying from index funds and ETFs. Such inclusion validates TTD's market importance and enhances its visibility and liquidity. This artificial demand floor, coupled with TTD's $37 billion market capitalization, underscores its growing influence within the financial landscape.
Beyond index inclusion, TTD benefits from a significant structural shift in advertising. Programmatic advertising is rapidly replacing traditional media buying, expected to account for nearly 90% of digital display ad spending by 2025. This growth is driven by advertisers' need for transparent ROI, publishers avoiding "walled gardens" through platforms like TTD's OpenPath, and AI-driven innovation. TTD's AI platform, Kokai, greatly lowers acquisition costs and enhances reach, resulting in over 95% client retention. Strategic partnerships in high-growth areas like Connected TV (CTV) further reinforce TTD's leadership.
Financially, The Trade Desk demonstrates remarkable resilience and growth. Its Q2 2025 revenue growth of 17% outpaces the broader programmatic market. Adjusted EBITDA margins hit 38%, reflecting strong operational efficiency. While TTD trades at a premium valuation - over 13x 2025 sales targets-its high profitability, substantial cash flow, and historical investor returns support this. Despite intense competition and regulatory scrutiny, TTD's consistent market share gains and strategic positioning in an expanding digital ad market make it a compelling long-term investment.
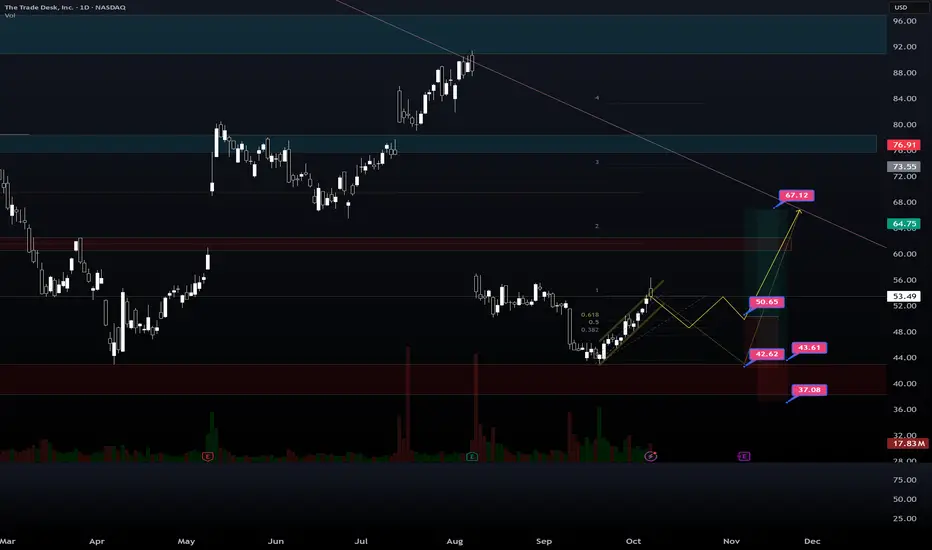
TTD Swing Trade Plan – 2025-06-06🐻 TTD Swing Trade Plan – 2025-06-06
Bias: Moderately Bearish
Timeframe: 5–7 trading days
Catalysts: Weak daily trend, below EMAs, oversold conditions may delay move
Trade Type: Naked put option
🧠 Model Summary Table
Model Bias Strategy Strike Premium Target(s) Stop-Loss Confidence
Grok Moderately Bearish $71 PUT $1.00 +50% –25% 75%
Claude Moderately Bearish $67 PUT $0.93 $2.50 $0.65 75%
Llama Moderately Bearish $67 PUT $0.94 $1.13 $0.47 72%
Gemini Moderately Bullish $75 CALL $1.04 $1.55 / $2.10 $0.50 70%
DeepSeek Moderately Bullish $75 CALL $1.06 $1.60 $0.75 75%
✅ Consensus: Short-term oversold, but longer-term bias remains bearish
⚠️ Disagreements: Bounce vs. continuation; call vs. put structure
🔍 Technical & Sentiment Summary
Trend: Daily/weekly charts bearish (below EMAs); 15m shows divergence
Support Zones: $70.34–$70.68
Resistance / Max Pain: $73.90 and $75
Volatility: VIX at 17.6 – supports risk-taking
News: Neutral to slightly negative; no strong catalyst noted
✅ Final Trade Setup
Parameter Value
Instrument TTD
Strategy PUT (SHORT)
Strike $67
Expiry 2025-06-20
Entry Price $0.94
Profit Target $1.40
Stop Loss $0.65
Size 1 contract
Entry Timing At open
Confidence 75%
💡 Rationale: Daily bearish structure supported by three models. Downside continuation setup if oversold bounce fails to hold $71.
⚠️ Key Risks & Considerations
Short-term bounce may occur from 15m bullish divergence
Max Pain at $75 may cause gravitational upward drift
Liquidity Note: $67 put has low OI and volume → wider spreads
Theta decay increases rapidly next week — act fast if trade stalls
Unexpected news could invalidate bearish setup quickly
📊 TRADE DETAILS SNAPSHOT
🎯 Instrument: TTD
🔀 Direction: PUT (SHORT)
🎯 Strike: $67.00
💵 Entry Price: $0.94
🎯 Profit Target: $1.40
🛑 Stop Loss: $0.65
📅 Expiry: 2025-06-20
📏 Size: 1 contract
📈 Confidence: 75%
⏰ Entry Timing: Open
🕒 Signal Time: 2025-06-06 13:13:23 EDT

Long on $TTD ; It should test 75-80 range- Many good news have come for NASDAQ:TTD in the last 2 weeks and one of that is Judge ruling against Google Ad business which might lead to relaxed rules by Google which will help other advertisers expand their TAM
- Netflix ads should allow DSPs like NASDAQ:TTD to get more investment dollars flowing through their platform.
- EPS is growing massively in FY 2027/2028.
- I'm not sure if we could get all time high before 2027 but firmly believe NASDAQ:TTD should test 200 weekly SMA.

$TTD Breakout After Earnings | Gapped Up w/ Volume Surge📊 Summary for TradingView Post:
NASDAQ:TTD exploded +11% post-earnings, gapping above key resistance and closing strong with massive volume.
Price cleared multiple supply zones with conviction, now sitting above $79 with eyes on $82.74 and $86.43.
Buyers showed up heavy. This is no random push—structure confirms strength.
Still bullish unless it fills the gap below. Watching for continuation or controlled retest.

TTD The Trade Desk Options Ahead of EarningsIf you haven`t bought TTD before the recent rally:
Now analyzing the options chain and the chart patterns of TTD The Trade Desk prior to the earnings report this week,
I would consider purchasing the 55usd strike price Calls with
an expiration date of 2025-6-20,
for a premium of approximately $6.70.
If these options prove to be profitable prior to the earnings release, I would sell at least half of them.

Google Ruling Could Be Very Bullish for TTDA U.S. judge has found Google guilty of illegally monopolizing the digital advertising technology markets. The monopolization of both the demand and supply sides has been a long-standing concern for the rest of the digital advertising sector.
This ruling may significantly benefit The Trade Desk (TTD), as it operates as an independent demand-side platform. The digital advertising market is projected to exceed $600 billion in 2025, and Google currently believed to be controls nearly 30% of that. Even a 5% slip in Google’s market share, with TTD capturing just 10% of that shift, could nearly double TTD's revenue. As a result, this ruling is can be considered very bullish for TTD, both in the medium and long term.
Technically, TTD recently tested the $40 level, a key support that has held since Q4 of 2020, indicating the stock is currently in a strong demand zone. With this news, the likelihood of that support holding and a bullish reversal increases.
Analyst consensus reflects an 85.8% upside potential. If the bullish scenario plays out, the horizontal level at $60 and the 200-day moving average could serve as key medium-term targets. From current levels to the 200-day SMA, the potential return is close to 50%.

Opening (IRA): TTD May 16th -70C/October 17th 32.5C LCD*... for a 26.10 debit.
Comments: At or near 52-week lows. Buying the back month 90 delta and selling the front month that pays for all of the extrinsic in the long. (The October 17th 32.5C is shown at the 50 strike to fit it on the chart).
Metrics:
Buying Power Effect: 26.10 debit
Break Even: 58.60/share
Max Profit: 11.40
ROC at Max: 43.7%
10% Max: 2.61
ROC at 10% Max: 10.0%
In this particular case, I'll look to take profit at 110% of what I put it on for and/or roll out the short call if it hits 50% max. Earnings are on 5/14, so my preference would be to take it off before then ... .
* -- Long Call Diagonal.

$TTD to go below $60- Investors were paying too much for growth in NASDAQ:TTD
- It operates in a very competitive space.
- Leadership is solid however eps growth and gaap eps tells a different story. EPS growth is impressive but gaap eps is terrible. Stock based comp remain consistent but somehow gaap eps isn't growing as fast as non-gaap eps.
- Nonetheless, here's fair value for NASDAQ:TTD
Year | 2025 | 2026 | 2027 | 2028
EPS | 1.79 | 2.21 | 2.85 | 3.89
EPS growth | 9.54% | 23.13% | 28.92% | 36.66%
For eps growth of 20%+ and company with a moat. Fair forward EPS is 30
Year | 2025 | 2026 | 2027 | 2028
Bear Case ( p/e 20 ) | $35 | $44 | $57 | $77
Base Case (p/e 30 ) | $53.7 | $66.3 | 85.5 | $116
Bull Case (p/e 35 ) | $62 | $77 | $99 | $136
Idea is to buy close to fair value and hold it for period when there is optimism in the market or euphoria and/or valuation expansion where stock is assigned higher forward p/e multiple.
For me, NASDAQ:TTD is a buy under $65. However, I have started with a starter position at 80s because you many times good stocks bottom above its fair value.
I plan to build a position in increments because you never know how much stock will undercut on pessimism. However, the above intrinsic value based on EPS should help to identify the ranges
