FENER Stock Analysis CommentaryFENER Stock Analysis Commentary
Daily technical indicators are Positive. The stock is currently trading at the 9.54 support level. Being very close to the 21-day moving average (9.87), if the stock breaks above this average, it may have a chance to fill the price gap at 10.10.
If prices remain above this average and positive momentum continues, the stock may target higher price gaps. The highest price gap is at 11.89. If this gap is filled, the stock will also have moved above the 200-day moving average (11.36).
Resistances: 10.05 – (10.11) – 10.68 – (10.77)
Supports: 9.54 – 8.97
We would appreciate it if you boost our posts.
Don’t forget to share them on your social media accounts as well.
Legal Disclaimer:
The information, comments, and recommendations provided here do not constitute investment advisory services. Investment advisory services are offered within the framework of an agreement between the investor and authorized institutions such as brokerage firms, portfolio management companies, or non-deposit banks. The views expressed here are personal opinions only and may not be suitable for your financial situation, risk tolerance, or return expectations. Therefore, investment decisions should not be made based solely on the information provided on this page.
Turkishstocks

ALVES Stock Analysis & CommentaryALVES Stock Analysis & Commentary
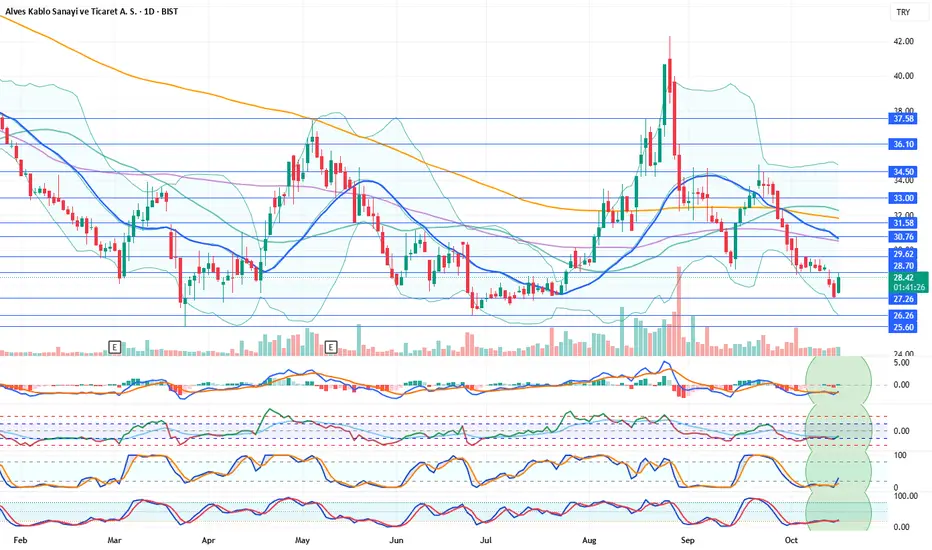
Daily technical indicators are positive. After forming support at 27.26, the stock appears to be recovering from that level. With indicators also showing positive momentum, we believe further recovery may occur. In a potential bullish scenario, the stock could have a chance to test the 21-day moving average (30.68).
Resistance Levels: 28.70 – 29.62 – 30.76 – 31.58
Support Levels: 27.26 – 26.26 – 25.60
We’d appreciate it if you could boost our posts and share them on your social media. 🚀
Legal Disclaimer:
The information, comments, and recommendations contained herein do not constitute investment advice. Investment advisory services are provided only within the framework of an investment advisory agreement to be signed between the investor and authorized institutions such as brokerage firms, portfolio management companies, and non-deposit banks.
The opinions expressed here are personal views and may not be suitable for your financial situation, risk profile, or return preferences. Therefore, no investment decisions should be made based solely on the information and opinions presented on this page.
TURSG Stock Analysis CommentaryTURSG Stock Analysis Commentary
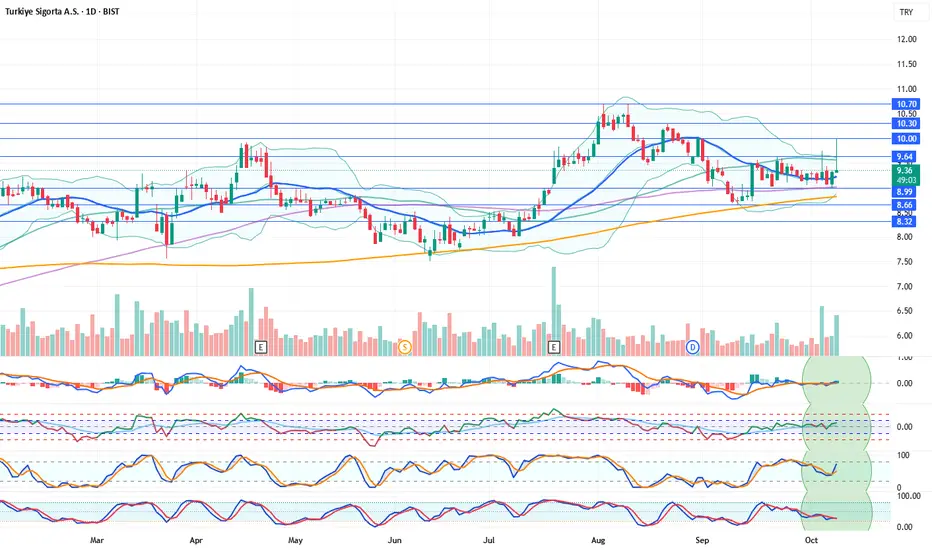
Daily technical indicators are positive. The stock has risen above its 21-day moving average (9.22). During the day, it climbed as high as 10.00 TL but failed to hold that level, pulling back below the 9.64 resistance point. With today’s positive movement, the stock has also turned its indicators to the positive side, giving a favorable impression for the coming days. If support continues, it may have another chance to test the 10.00 resistance level. In the medium term, the 10.70 resistance will be monitored.
Resistances: 9.64 – 10.00 – 10.30 – 10.70
Supports: 8.99 – 8.66 – 8.32
We’d appreciate it if you boost our posts and don’t forget to share them on your social media accounts!
Legal Disclaimer:
The information, comments, and recommendations provided here do not constitute investment advice. Investment advisory services are offered only within the framework of an investment advisory agreement to be signed between the investor and authorized institutions such as brokerage firms, portfolio management companies, and non-deposit banks. The opinions expressed on this page reflect personal views only. These views may not be suitable for your financial situation, risk profile, or return preferences. Therefore, investment decisions should not be made based solely on the information and commentary provided here.
LINK Stock Analysis CommentaryLINK Stock Analysis Commentary
Daily technical indicators are positive.
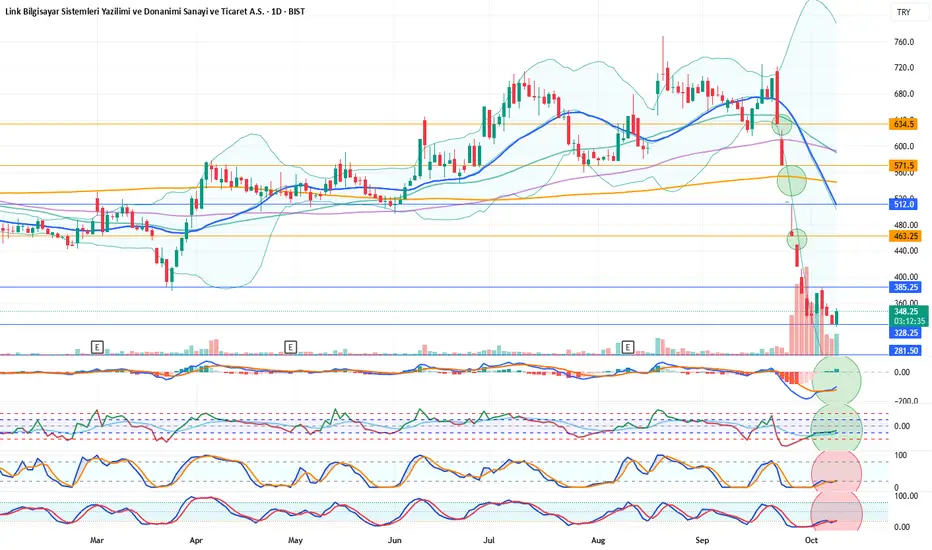
After a long period of sharp declines, the stock is moving sideways above the 328.25 support level.
We believe that the possibility of a rebound (buying reaction) is high.
If an upward movement occurs and the price breaks above the 385.25 resistance, it may have a chance to fill the price gap around 463.25.
In case of a negative scenario where the stock breaks below its support, the 328.25 level should be closely monitored.
Resistance Levels: 385.25 - (463.25) - 512.0
Support Levels: 328.25 - 281.50 - 253.25
We would appreciate it if you could boost (rocket) our posts and share them on your social media accounts as well. 🚀
Legal Disclaimer:
The information, comments, and recommendations contained herein do not constitute investment advice.
Investment advisory services are provided within the framework of an investment advisory agreement to be signed between investors and authorized institutions such as brokerage firms, portfolio management companies, and non-deposit banks.
The opinions expressed on this page are solely personal views and may not be suitable for your financial situation or risk/return preferences.
Therefore, no investment decisions should be made based solely on the information or commentary provided here.
CLEBI Stock Analysis CommentaryCLEBI Stock Analysis Commentary
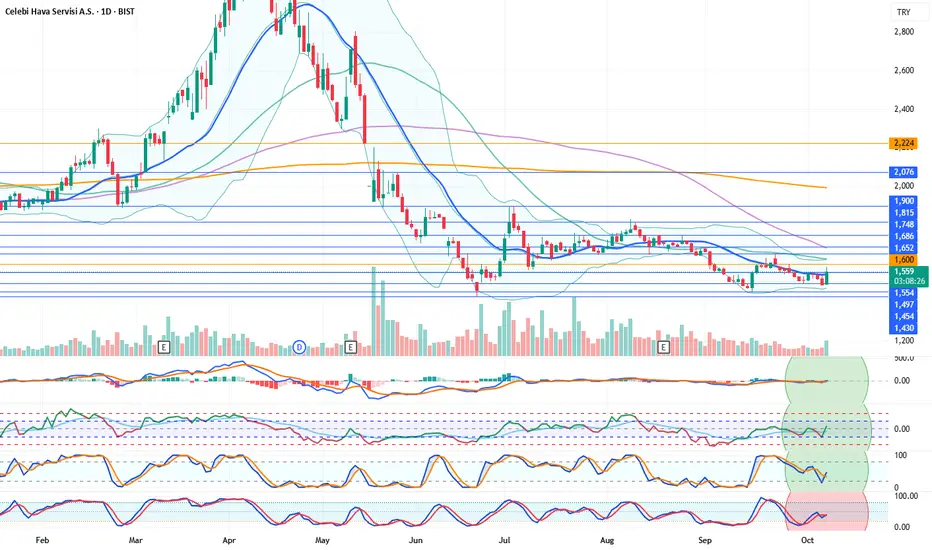
Daily technical indicators are positive. The stock is trying to stay above its 21-day moving average (1546). As of this post, we observe positive price movements above the 1554 support level. Volatility has also increased compared to the previous week. Closing the small price gap around the 1600 level could occur in the short term. If the stock manages to remain above the 21-day moving average, resistances at 1652 and higher levels will be the next to watch. With indicators remaining positive, the probability of seeing further upward movement in the stock has increased.
Resistance Levels: 1554 – (1600) – 1652 – 1686 – 1748
Support Levels: 1497 – 1454 – 1430
If you enjoy our analysis, we’d appreciate your support — don’t forget to share it on your social media!
Legal Disclaimer:
The information, comments, and opinions provided here do not constitute investment advice. Investment advisory services are offered under a formal investment advisory agreement between the investor and authorized institutions such as brokerage firms, portfolio management companies, or non-deposit banks. The views expressed here are personal opinions and may not be suitable for your financial situation, risk tolerance, or return preferences. Therefore, no investment decisions should be made based solely on the information provided on this page.
DERHL Stock Analysis CommentaryDERHL Stock Analysis Commentary
Daily technical indicators are positive. After a long break, the stock closed the week on a positive note, turning its indicators upward from the lower levels. If the support continues to hold, the stock may have a chance to break above its 21-day moving average (19.93). On September 16, the stock previously broke this average but failed to hold above it, leading to a long-term decline. Let’s see if this time it can stay above the average and manage to close the price gap at 27.86. For now, positivity seems to have started.
Resistances: 20.84 – 23.26 – 24.68 – 25.92 – (27.86)
Supports: 18.23 – 17.51 – 16.80
We’d appreciate it if you rocket 🚀 our posts and don’t forget to share them on your social accounts.
Legal Disclaimer:
The information, comments, and recommendations provided here do not fall within the scope of investment advisory services. Investment advisory services are offered under an investment advisory agreement to be signed between the client and brokerage firms, portfolio management companies, or non-deposit banks. The content shared on this page reflects only personal opinions. These views may not be suitable for your financial situation, risk profile, or return preferences. Therefore, investment decisions should not be made solely based on the information and writings presented here.

ANSGR Stock Analysis & CommentaryANSGR Stock Analysis & Commentary
Company: Anadolu Anonim Türk Sigorta
Daily technical indicators are positive. The stock is currently at the same level as its 21-day moving average (21.60). With indicators turning positive from a lower position, we expect the positive momentum in the stock to continue and possibly break above its average. If it breaks the 21-day average to the upside, the next target will be the 50-day moving average (22.38), which also coincides with the 22.40 resistance level. Breaking above this level may also strengthen support for the stock. In the short to medium term, there is also a possibility of closing the price gap at 24.66.
Resistances: 22.00 – 22.40 – 22.92 – 23.68
Supports: 20.90 – 20.56
We would appreciate it if you rocket 🚀 our posts. Don’t forget to share them on your social accounts.
Legal Disclaimer:
The information, comments, and recommendations contained herein do not constitute investment advisory services. Investment advisory services are provided within the framework of an investment advisory agreement to be signed between the client and brokerage firms, portfolio management companies, or non-deposit banks. The content on this page reflects only personal opinions. These opinions may not be suitable for your financial situation or your risk and return preferences. Therefore, no investment decisions should be made based on the information and writings presented on this page.

Turk Hava Yollari : Pole Target Achieved, 295 % PROFIT Turk Hava Yollari: A Channel Pattern formed and Breakout. The Pole Target was achieved within two years, resulting in a 275% PROFIT. Bought at 41 TRY in May 2022 and Sold at 314 TRY in May 2024.
I want to help people to Make Profit all over the "World".

(EM)Turkish Equities vs USD XU100 is turkish largest 100 company stock exchange.
despite the higher XU100 index , Turkish equities seems too weak against USD.
another strong reverse possible from the bottom ? why not ? ^^

TUR (Turkish Stocks Index) Descending Triangle. -59% Drop ComingSome people have been pointing out to me that the Turkish stock market has been hitting all time highs consistently through 2021. However, this is only apparent when looking at Borsa Istanbul Index in Turkish Lira. Once you look at it in term of USD, it becomes quite clear that the opposite is true. The Turkish stock market has been hitting new lows consistently.
We just broke this descending triangle downward. The Borsa Istanbul has suspended trading for the fourth day in a row as of today. We don't know where this index will be when the market opens on 27 December. What we do know is that there is a fully formed descending triangle, and that if it breaks downwards, then we should expect a target of $7.76, a 59% drop from last closing price.
I also suspect that the index will trade sideways for a while after hitting the bottom. Psychologically, recovery does not occur immediately after such a devastating drop. We will keep watch throughout 2021, so stay tuned.


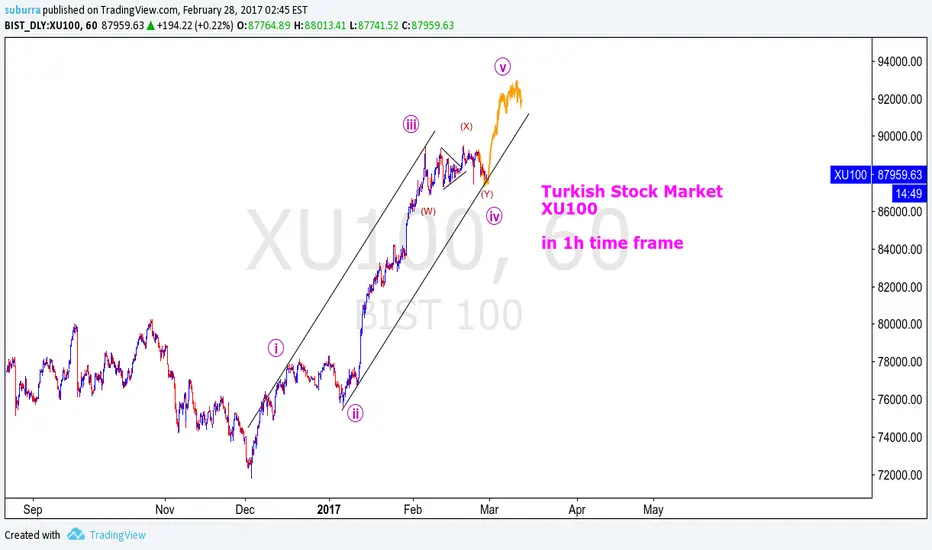
XU100- Possible Reverse Head&ShouldersTurkish stock index BIST 100 seems like forming a reverse head and shoulders formation.
Target of this formation is first 88.500 which is the height of shoulder, and than 86.000 which is the height of head.
After completing this move, a great opportunity is to buy this index because prior to this correction, prices were around 120.000. For the last 20 years annual increase rate of this index is around 24%

USDTRY - Future of USDTRY Turkish LiraExpecting USDTRY to end correction around 4.80-5.00 and consolidate there for a while and start a new rally in 2019.
This is how trends works, never use straight lines or channels to forecast future of financial instruments. Trends are not linear, trends are exponential.


Profit taking time for Tüpras (TUPRS)Tupras is makin rising wedge with treble top, with lower and lower volume , and falling and falling RSI (making bear flag alike)
A is .618 zone for the rising wedge also where I expect SMA 200 to be, B is .5 for A and C is 1.618 for A and B.
Expecting a bigger drop on long term.

USDTRY pennant formation and target priceUSDTRY M30 chart ///
Looks like a pennant formation in M30 chart
If it works, it will try to break the price of 4.77 - 4.80 again.
***This information is not a recommendation to buy or sell. It is to be used for educational purposes only.***
I'm sorry for the impaired expression..Just watch the chart, not what I write. :)
PS make sure you give me a like, If you LIKE this analysis .... If you like most of my analyzes, FOLLOW me .

DGKLB- Dogtas Kelebek Mobilya Daily ChartDGKLB- Dogtas Kelebek Mobilya Daily Chart, Turkish Stock - Bist-100
BIST:DGKLB
D

DGKLB Dogtas Kelebek Mobilya Weekly ChartDGKLB - Dogtas Kelebek Mobilya Weekly Char, Turkish Stock - Bist 100
BIST:DGKLB
D

Vakko Tekstil. Mid-Term look Weekly Chart. Haftalik GrafikVakko Tekstil Haftalik Teknik Analiz. Mid-Term Look on Vakko Turkish Bist-100 Stock.
BIST:VAKKO