5 Steps to Better TradingStart journaling
This is one of the most important things in trading. You can see the numbers clearly without fooling yourself and know what's working and what's not. It also helps to start noticing the most common trading mistakes you may be making, whether you enter/exit early, whether you are better at managing trades actively or passively, the quality of your SL/TP levels and the likelihood of reaching them, etc.
If you spend 20 minutes going over your log this weekend, it will give you more insight into how to minimize losses and maximize profits than anything else you can do.
Stop trying to predict the market
This is another big problem. Wizards effortlessly take other people's money: Casinos, they don't try to predict a player's next move, they just set up a statistical edge in their favor and watch it happen over time. This is the closest thing to the Holy Grail that will ever exist.
Not opening a position is in itself a position
FOMO causes traders to get into losing trades more often than anything else. Learn to be patient and just wait for quality trades, it has given me one of the biggest boosts to growth and greatly limits losses. Staying committed to a trading plan, limits the temptation to make impulsive trades. This habit will help to control the FOMO trades. be patient, be disciplined the market will always present opportunities.
Solid risk-management
Limiting maximum drawdown and MAE, limiting leverage (but also increasing it on high probability sets), backtesting, equity curve modeling, maintaining a good asymmetric RR, cross correlation/diversification, etc. Wait for confirmation before entering a trade. better to enter a trade late and be right, than early and be wrong.
Treating trading as a job
Take your work as seriously as any other important activity in your life. You should have regular trading start and end hours, and prepare very carefully for trading sessions. Also, write reports and collect statistics to document your work.
Tutorial

Bites Of Trading Knowledge For New TOP Traders #18 (short read)Bites Of Trading Knowledge For New TOP Traders #18
----------------------------------------------------------------
What is the Blockchain? -
The Blockchain is a decentralized ledger that is append-only meaning that data can only be added to it. Once information is added, it is extremely difficult to modify or delete it. The Blockchain enforces this by including a pointer to the previous Block in every subsequent Block.
The pointer is a Hash of the previous block. Hashing involves passing data through a one-way function to produce a unique Fingerprint of the input. If the input is modified even slightly, the Fingerprint will look completely different. Since the Blocks are linked in a Chain, there is no way for someone to edit an old entry without invalidating the Blocks that follow, allowing a secure structure.
What Is a Blockchain Consensus Algorithm? -
A consensus algorithm is a mechanism that allows users or machines to coordinate the agreement of what is a valid block in the Blockchain in a distributed setting. It needs to ensure that all participants in the system can agree on a single source of truth. Types of consensus algorithms include Proof of Work (PoW) and Proof of Stake (PoS).
What is Proof of Work? -
Proof of Work (PoW) is a mechanism for preventing the same bitcoin funds from being spent more than once. Proof of Work consists of a consensus algorithm, which is a protocol that sets out the conditions for what makes a block in the Blockchain valid. It ensures the security and integrity of bitcoin’s distributed ledger.
RISKS AND OPPORTUNITIES FOR CORPORATES AND INDIVIDUAL INVESTORS -
Common application of financial market instruments for managing risk and opportunities.
Hedging Portfolio Risk
Hedging bitcoin exposure with the Bakkt ® Bitcoin (USD) Cash Settled Monthly Futures (BMC) contract is a way to manage portfolio risk by taking a directional position opposite to the underlying asset as protection.
For example, a hedger may have plans to hedge downward price movement in bitcoin using futures contracts based on in-house market and portfolio analytical processes. The market analysis may use common technical analytical techniques such as support and resistance to formulate the trade decision.
If bitcoin is expected to weaken as it nears the resistance area, the hedger may plan to enter into a short futures position using the Bakkt ® Bitcoin (USD) Cash Settled Monthly Futures contract under either price levels of $27,500 or $32,500 to lock in the value of their underlying bitcoin position. Alternatively, if the hedger was in a short bitcoin position and wanted to hedge their position as price rose, entering a long futures position above price levels $12,500 or $16,500 could be considered.
TRADDICTIV · Research Team
--------
Disclaimer:
We do not provide investment advice, nor provide any personalized investment recommendations and/or advice in making a decision to trade. Before you start trading, please make sure you have considered your entire financial situation, including financial commitments and you understand that trading is highly speculative and that you could sustain significant losses.

The Most Powerful Consolidation PatternWhat is the Cypher Pattern?
Cypher is a powerful consolidation pattern. In the harmonic pattern world, the Cypher pattern is a four-leg reversal pattern that follows Fibonacci ratios. The Cypher pattern is less common because it's hard for the market price to match up with fixed Fibonacci ratios. The Cypher pattern needs to follow the Fibonacci sequence in order to work correctly. This pattern works well in the ranging markets. The winrate of this pattern can reach up to 70%. On an hourly timeframe, for example, it has a 72% win rate on AUDCAD.
Defining the Cypher Pattern
The first rule of the Cyper pattern is that the price of a security must stay above the 0.382 Fibonacci ratio and below the 0.618 Fibonacci ratio. There is a third point in the Cypher pattern, which is labeled "B." This is the point where XA's swing-leg retraces the 0.382 to 0.618 Fibonacci retracements.
The next rule of the Cypher pattern is a Fibonacci extension of the XA leg that comes in at 1.27, but it doesn't exceed the 1.414 Fibonacci ratios. This point of the move is labeled "C" and completes the BC swing-leg of the Cypher pattern. The final part of the Cypher pattern is where our orders will be executed. This is at the point D, which is located at the 0.786 Fibonacci retracements of the entire move started from X up to C.
How to Correctly Draw Cypher Pattern
1. The XA Move
The market creates an impulse/anchor leg when prices move a lot in a specific direction. This is the leg that is farthest away from the body. Once we know which direction we want to go, we can look for other things that need to be met in order to go that way.
2. The AB Move
After our initial move, we will look for price action to confirm our new position. If the candlestick matches the distance between the two legs by at least 38.2% then the move is considered valid. Price action does not have to close above the 38.2 be considered a valid.
The (B) leg of the trade is considered invalid if the price action does not hit a minimum of 38.2% of the original price of the (XA) move, or if it closes beyond the 61.8% retracement of the (XA) leg's original price.
3. The BC Move
Once we have met the requirements for step 2, we can look for the C leg. The market created a valid C leg by fulfilling at least a 127.2 extension of the (XA) leg. Price action also has to close above or below the previous (A) leg. This leg is invalid if it doesn't fulfill a 127.2 extension of (XA) or if it closes beyond a 141.4 extension of (XA).
4. Entry point
The market formed a successful entry point by following a 78.6% retracement of the previous move. The market forms a successful (D) completion point (entry) by fulfilling a 78.6 retracement of the (XC) move. For this completion to be valid, the (D) leg must exceed the (B) leg.
Take Profit, Stops, and Entries
Entry: The (D) completion point, which is the 78.6 retracement of the (XC) move, serves as the entry point for the Cypher pattern.
Stops: It is recommended to place stops 10 pip's beyond the (X) point.
TP1: The 38.2 retracement of the (CD) leg is the first target. If targets are met, then stops move to breakeven.
TP2: The (CD) leg's 61.8 retracement represents Target 2.
*Fibonacci retracements should be updated to the highest/lowest (D) point following entrance if price movement continues.
Examples
Conclusion
The Cypher trading strategy has a higher winning percentage than other harmonic patterns, but it's rare to see it appear on the chart. So, we need to take full advantage of the times it does show up.

FOREXN1:SWING TRADING - MADE IT EASY - A GREAT STYLE OF TRADINGSwing trading is a style of trading that attempts to capture short- to medium-term gains in a stock (or any financial instrument) over a period of a few days to several weeks. Swing traders primarily use technical analysis to look for trading opportunities. Swing traders may utilize fundamental analysis in addition to analyzing price trends and patterns.
Some general Rules before going in the Deep of the Strategy :
- Swing trading involves taking trades that last a couple of days up to several months in order to profit from an anticipated price move.
- Swing trading exposes a trader to overnight and weekend risk, where the price could gap and open the following session at a substantially different price.
- Swing traders can take profits utilizing an established risk/reward ratio based on a stop loss and profit target, or they can take profits or losses based on a technical indicator or price action movements.
Rules of entry :
Swing trading means " Surfing the trend " Using the Swing points as an entry inside a trend. The Swing point is basically retracements inside an already-started trend. Let's see the picture below. I personally call the Swing point or retracements " V " points. Let's look together. .
As you can see the retracement inside a trend looks like a " V " point. In a Bearish scenario, the " V " is upside down meanwhile inside a Bullish trend the " V " is on the correct side. Let's note, the " V " points can look also like " W " or generally is correct to call them a " Pullback " Area. In this example, EUR/USD we can see how the price used the " V " shape as Pullback to continue the downtrend.
In the picture below I add the Moving averages, the 200 and the 50. This easy and simple technical indicator can help you to determine the direction of the trend. If the price is below 200, generally it means the price is in a Downtrend, and Vice-versa when the price is above, generally it means is in an Uptrend. The 50 Moving average can help you to understand if the price it's started to grow, and when the moving average crosses the 200, generally it means that the price is started a bullish impulse. You can use any kind of indicator to determine the direction of the main trend, the moving average is one of the most used in this style of trading. As you can see, the moving average, like the 50 in this case, in EUR/USD has been used from the price as a Pullback trigger to continue the downtrend.
I explain better... The price inside a Pullback Area or " V " point, in a downtrend, below the 200 Moving average, has used the 50 Moving average as a dynamic resistance and rejected the price in the direction of the main trend.
Swing trading as explained use technical analysis to look for trading opportunities. Look how conventional support and resistance can work in this, another clue to add to our idea of entry.
Additionally, in our plan of action, we can add some technical indicators, look how the Stochastic indicator can give a clear overbought reversion signal.
Not least, the use of the Fibonacci retracement can give the Swing trader a clear metric of entry and exit point with relative stop loss and take profit area. In This last example, we can add together all the previous clues given by the Technical indicators, the use of support and resistances, and adding also Fibonacci retracements as targets for Stop loss and take profits. Remember, Swing traders may utilize fundamental analysis in addition to analyzing price trends.
Advantages and Disadvantages of Swing Trading
Many swing traders assess trades on a risk/reward basis. By analyzing the chart of an asset they determine where they will enter, where they will place a stop loss, and then anticipate where they can get out with a profit. If they are risking $1 per share on a setup that could reasonably produce a $3 gain, that is a favorable risk/reward ratio. On the other hand, risking $1 only to make $0.75 isn't quite as favorable.
Swing traders primarily use technical analysis, due to the short-term nature of the trades. That said, fundamental analysis can be used to enhance the analysis. For example, if a swing trader sees a bullish setup in a Forex pair, they may want to verify that the fundamentals of the asset look favorable or are improving also.
Swing traders will often look for opportunities on the daily charts and may watch 1-hour or 15-minute charts to find a precise entry, stop loss, and take-profit levels.
Pros
It requires less time to trade than day trading.
It maximizes short-term profit potential by capturing the bulk of market swings.
Traders can rely exclusively on technical analysis, simplifying the trading process.
Cons
Trade positions are subject to overnight and weekend market risk.
Abrupt market reversals can result in substantial losses.
Swing traders often miss longer-term trends in favor of short-term market moves.
Hope this guide can be useful for everybody.

Moar Wyckoff nonesenseWas trying to explain Wyckoff to someone and so I explained it best I could then gave them a standard Wyckoff diagram.
After that picked a random coin and looked at different time frames, and was able to spot a Wyckoff cycle.
I marked up the chart with Wyckoff annotations and since I spent the time doing it I figured I'd share it to see if it helps anyone.
This is a downtrend, but Wyckoff is still occurring at different time frames...

STOCK MARKET AND FOREX CORRELATIONStocks and indices are often used for predicting the currency market. No wonder, in this world of trading, everything is interconnected in one way or another. There's a connection between stocks and currencies. Say, if you want to buy shares of a Japanese company on the Tokyo Stock Exchange, you can only do it in the local currency. As a result, your currency will have to be converted into yen (JPY), which naturally leads to an increased demand for it. The more stocks you buy on the Tokyo Stock Exchange, the more demand for the yen. Conversely, the more the currency is sold, for whatever purpose, the lower its value.
When a country's stock market seems attractive, they start flooding it with money. Conversely, if a country's stock market is in shambles, investors run from it headlong, looking for more attractive places to invest. If one country's stock market performs better than another, capital will flow from one country to the other. This will have an immediate effect on their currencies. Where the money is, the currency is stronger, where the stock market is weak, the national currency weakens.
A strong stock market causes a strong currency.
A weak stock market - a weak currency.
Key global indices
Let's take a look at the key world indices that interest us. As you will notice, many of them correlate and complement each other.
Dow Jones Index
The oldest and the most famous index in the world. There are actually several of them, but the most popular one is called the Dow Jones Industrial Average (DJIA).
It is the key U.S. stock index, which unites 30 companies with publicly available shares. By the way, despite the name, these companies are not particularly connected with the industry, because it is not in favor now. There are simply 30 of the largest companies in America.
This index is closely watched by investors around the world. It is a great indicator of the entire state of the U.S. economy, reacting to local and foreign economic and political events. The index tracks incredibly wealthy companies, you've heard of most of them. McDonald's, Intel, Apple are all in there.
S&P 500 Index
The Standard & Poor 500 Index, also known as the S&P 500, is one of the best-known indices on the planet. It is a weighted average price index of the 500 largest U.S. companies.
In fact, it is a key indicator of the entire U.S. economy and it is used to judge its performance. The S&P 500 Index (SPX) is the most traded index in the world after the Dow Jones Industrial Average.
Nikkei
The Nikkei index is like the Dow Jones Industrial Average, but for the Japanese. It averages the performance of the 225 largest companies in the Japanese stock market. Typical representatives of the Nikkei are Toyota, Mitsubishi, Fuji and others.
DAX
Deutscher Aktien Index is index of the German stock exchange, which includes 30 "blue chips" the largest companies whose shares are traded on the Frankfurt Stock Exchange. Germany is the most powerful economy in the EU, so if you are interested in the Euro, you should watch the DAX. The index includes companies like Adidas, Deutsche Bank, SAP, Daimler AG and Volkswagen.
EURO STOXX 50
The Dow Jones Euro Stoxx 50 Index is one of the key indices in the eurozone, reflecting the success of major EU companies. The index includes 50 companies from 12 EU countries.
FTSE
Financial Times Stock Exchange, also known as footsie, an index of the largest companies listed on the London Stock Exchange. There are several variations of it (which is often the case with indices). Let's say the FTSE 100 includes 100 companies and the FTSE 250, respectively, includes the 250 largest companies in the UK.
Hang Seng
The Hang Seng Index (HSI) for the Hong Kong Exchange shows changes in the prices of companies listed on the Hong Kong Exchange. The index includes the 50 largest companies with a capitalization of 58% of the total volume of the Stock Exchange.
The relationship between the stock market and the Forex
Now let's see if we should take all these indices into account when working with currency pairs. Of course, you should to determine general market trends at higher timeframes (remember multiframe analysis). In general, when the stock market is on the rise, investors are more willing to invest in it, buying the national currency. Which leads, of course, to its strengthening.
If, however, the stock market falls inconsolably, investors take their money, converting it back into their currency and the national currency weakens. However, there are two exceptions the U.S. and Japan. The economic growth of these countries often leads to the fact that their national currencies are weakening such a funny paradox, nevertheless, related to certain economic mechanisms. Let's look at how the Dow Jones Industrial Average interacts with the Nikkei.
As you can see, the DJIA and the Nikkei 225 are following each other. Moreover, sometimes the movement of one index anticipates the movement of the other, which allows you to use such a miniature time machine for making predictions.
Let's see other examples:
USD/JPY and DJI
USD/JPY and NI225
EURJPY and STOXX50
GBPJPY and FTSE100
Correlation can be regarded as an additional indicator of the global market trend. If the indicators of two interrelated assets diverge, it is much easier to determine the trends of each by methods of technical analysis. And you already know what to do with trend lines.
Let's look at some popular correlations between commodities and currency pairs.
Gold is up, the dollar is down. In economic crises, investors often buy gold for dollars, which is always up.
Gold up, AUD/USD up. Australia is the second largest supplier of gold in the world, so the Australian dollar exchange rate is in no small part related to the demand for gold.
Gold up, USD/CAD down. Canada is the 5th largest supplier of gold in the world. Therefore, if gold prices are going up, the USD/CAD pair is going down (because everybody is buying CAD).
Gold is up, EUR/USD is up. Both gold and the euro are considered the "anti-dollar". Therefore, an increase in the price of gold often leads to an increase in the EUR/USD exchange rate.
Oil is up; USD/CAD is down. Canada is the largest oil producer in the world, exporting more than 2 million barrels a day, mostly to the U.S. If oil goes up in price, the pair on the chart goes down.
Bond yields are up/the national currency is up. It is quite clear: the higher the interest rates state bonds, the more they are purchased for the national currency. As the demand for bonds goes up, the exchange rate goes up.
The DJIA is down, the Nikkei is down. The US and Japanese economies are very closely linked and go up as well as down.
Nikkei is down, USD/JPY is down. Investors often choose the yen as a "safe haven" in times of economic trouble.
The stock market, the state of which can be analyzed through indices, is directly correlated with currency pairs. Studying their interaction, you can often find situations when these data diverge so that one index acts as a "time machine" for the other. What is important is not only the correlation itself but also the fact that its polarity changes from positive to negative and vice versa.

CURRENCY CORRELATIONSCorrelation only shows exactly how two assets move in relation to each other. In the case of currency correlation, it is exactly the same story. Forex pairs can move together, in different directions, or not interact at all. Keep in mind that we are not trading just currencies, we are trading a currency pair where each participant in the pair influences the other. Therefore, correlation can be a useful tool, and almost the only one if you want to successfully trade several currency pairs at once.
Currency correlation is based on the so-called correlation coefficient, which is in a simple range between -1 and +1.
• Perfect positive correlation (coefficient of +1) means that two currency pairs move in the same direction 100% of the time.
• A perfect negative correlation (coefficient -1) implies exactly the opposite. Pairs constantly move in different directions.
If the correlation is 0, then there is no correlation at all, it is zero and the pairs are not related in any way.
The Risks of Currency Correlations
If you trade several currency pairs at once, you must realize at once how much such trading is exposed to risk. Sometimes people choose several pairs at once in order to minimize their risks, but they forget about the positive correlation, when pairs go in the same direction.
Let's assume that we took two pairs on the 4-hour timeframe, EUR/USD and GBP/USD. The correlation coefficient is 0.94, very nice. This means that both pairs are literally following each other.
If we open trades on both pairs, we thereby immediately double our position and the risks. They increase. Because if you are wrong with the forecast, you will be doubly wrong at once, because the pairs are mirrored.
You have put it up, the price went down, a double loss. So there is correlation. Also, it makes no sense to sell one instrument and buy another, because even with an accurate forecast one of them will bring you a loss.
The volatility also differs. One pair might jump 200 pips, while the other might jump only 180 pips. That's why it's necessary to play with simultaneous trades on different pairs very carefully and without fanaticism, the correlation decides everything here.
Now let's compare the opposite case, EUR/USD and USD/CHF. They have the opposite case, a strong inverse correlation, where the coefficient often reaches the absolute value of -1.00.
The pairs are like two magnets with opposite poles, constantly pushing away from each other. If you open opposite trades on two pairs with a negative correlation, it will be the same as two identical trades on pairs with a positive correlation, again doubling your risk. The most reasonable thing is definitely to work with only one pair and not to play with the opposite pair trades, because you can quickly reach ugly values.
Correlation coefficients
Now let's see how we can look at the correlation coefficients.
-1.0. Perfect inverse correlation.
-0.8. Very strong inverse correlation.
-0.6. Strong inverse correlation.
-0.4. Moderate inverse correlation.
-0.2. Weak inverse correlation
0. No correlation
0.2 Weak, slight correlation
0.4. Weak correlation
0.6. Moderate correlation
0.8. Strong correlation
1.0. Perfect correlation
So what to do with the correlation, can it be used or not?
1. Eliminate risk
If you like to open simultaneous trades on different pairs, knowing about their correlation will help you avoid getting into the described situation where you double your risk if two pairs go in the same direction. Or you bet in different directions, not realizing that the pairs have an inverse correlation and this again doubles your risk.
2. Doubling your profits or losses
If you decide to play with simultaneous trades on different pairs, a successful trade on pairs that have a direct correlation will double your profits. Or losses, of course, if something went wrong and the forecast was wrong.
3. Risk Diversification
Market risks can be divided into two currency pairs. If you certainly understand what you are doing and if the correlation between pairs is not perfect. To do so, we take pairs with a direct correlation around 0.7 (or higher), say EUR/USD and GBP/USD. Let's say you bet on USD going up. Instead of two bets on EUR/USD going down, you could bet on EUR/USD going down and GBP/USD going up. If the dollar falls, the euro will be less affected than the pound.
4. Risk Hedging
This method is already used in forex, where it is taken into account that each currency pair has its own pip value. If you have an upside position in EUR/USD and the price moves against you, a downside position in an opposite pair, such as USD/CHF, can help. You should not forget about the different pip value in forex. For example, the EUR/USD and USD/CHF have a nearly perfect correlation, except that when trading a $1000 mini lot, one pip of the EUR/USD costs $1, while USD/CHF costs $0.93. As a result, buying a EUR/USD minilot allows you to hedge your risks while simultaneously buying a USD/CHF minilot. If the EUR/USD falls 10 pips, you lose $10. However, the return on the USD/CHF will be $9.30. So instead of $10, you would only lose 70 cents, fine.
Hedging in forex looks great, but there are plenty of drawbacks as well. For when EUR/USD rises frantically, you simultaneously lose money on USD/CHF. Also, the correlation is rarely perfect, it's constantly floating, so instead of hedging you could lose everything.
5. Correlation, Breakouts and False Breaks
Correlation can also be used to predict price behavior at significant levels. Let's assume that the EUR/USD is testing a significant support level. We have studied it and decided to enter upon its breakout. Since EUR/USD is positively correlated with GBP/USD and negatively correlated with USD/CHF and USD/JPY, we should check if the other three pairs are moving in the same volatility as EUR/USD.
Most likely, GBP/USD is also near resistance levels, and USD/CHF and USD/JPY are near key resistance levels too. All this means that the USD move the market and there are all the indications for a breakout of the EUR/USD, because all the three pairs are moving synchronously. We have to wait for the breakout.
And now let's assume that these three pairs do not move synchronously with EUR/USD. GBP/USD has no intention to fall, USD/JPY does not increase, and USD/CHF does not show any signs of sideways movement. What does this mean? The only thing that the fall of EUR/USD is not connected with the dollar and is obviously caused by negative news from the Eurozone.
The price can be below the key support level, but if the three correlated pairs do not move synchronously enough with EUR/USD, we should not expect a breakout. Moreover, it can be a false break of resistance.
Yes, you can still enter the breakout without a correlation confirmation, but then make a smaller trade volume, because you need to reduce your risks.
Correlation: pros and cons
Here everything is obvious. The cons are your risks are doubled if you open trades for two mirrored correlated pairs. In addition, the correlation changes regularly at different time intervals, which should be taken into account in your work. The pros are correlation allows you to diversify risks, hedge your trades.
Also remember that:
ratios are calculated based on daily closing prices;
a positive coefficient means that two pairs move in the same direction;
negative in opposite directions;
the closer the coefficient is to values +1 and -1, the stronger the correlation.
Examples of pairs that move synchronously:
EUR/USD and GBP/USD;
EUR/USD and AUD/USD;
EUR/USD and NZD/USD;
USD/CHF and USD/JPY;
AUD/USD and NZD/USD.
Pairs with negative correlation:
EUR/USD and USD/CHF;
GBP/USD and USD/JPY;
USD/CAD and AUD/USD;
USD/JPY and AUD/USD;
GBP/USD and USD/CHF.
Do not forget to use all that you have learned, keep in mind the risk management, and then the currency pairs correlation may become a valuable tool in your trading arsenal. And most importantly, it will allow you to avoid mistakes when you trade two pairs at once and don't even realize that you are doubling your risks if there is a complete synchronous correlation between the selected pairs.

FACTORS THAT PUSH THE PRICEHello everybody!
Today I want to discuss with you a serious question - What factors are pushing the price?
As you know, there is fundamental and technical analysis.
Each trader himself gives preference to what to use in the analysis.
And we will try to understand what pushes the price.
NEWS
The first thing that comes to mind is NEWS .
News affects OUR WHOLE LIFE .
The news pushes crowds of people to one point and forces them to flee from another.
News is a strong factor.
If the central bank decides something, it will be in the news and it will definitely push the market.
If the president of the country has decided something, it is shown on the news and it pushes the market.
If a person who decided the fate of an entire industry was fired, it will push the market and the price.
Therefore, it is IMPORTANT to follow the news and, more importantly, correctly interpret the news and be able to predict the future mood and future actions of the crowd based on them.
PATTERNS
All traders see the same chart, but everyone perceives it differently.
There are many reasons for this: someone knows more patterns, someone has more experience, someone understands better than another, someone has better discipline.
And when one or another pattern appears on the chart, people start trading and push the price.
You may have noticed that if no special picture is visible on the market, then the market is sluggish.
As soon as a pattern emerges, movement begins.
People entered the market.
Can we say that patterns move the price?
Or maybe someone is creating patterns on the chart to move the price?
EMOTIONS
We have already touched on this topic above, but it is worth noting separately.
Emotions play an important role in everything.
If the crowd is happy, the market is growing.
The crowd is afraid - the market is falling.
The crowd can be angry at the company or the country, close positions and thereby push the price down because of their bias..
The one who knows how to understand other people's emotions is able to predict the future actions of the crowd and make money on it.
Think about it...
SUPPLY AND DEMAND
Classical works on economics teach us that the market is controlled by supply and demand.
more precisely, the difference between supply and demand.
If the demand is large, the price rises, if the demand is small, the price falls.
The logic is simple: if people buy a lot, someone will start raising the price before selling, why not, because people buy.
When people don't want to buy, the one who needs to sell will lower the price to lure the buyer, because you need to sell something.
At the same time, it is important that there should always be both a buyer and a seller, otherwise the price will stand still or move slowly.
When there is both a buyer and a seller on the market and a lot of transactions are made, the price moves quickly, volumes increase, so even strong jumps (GAPS) are possible.
MANIPULATION
Manipulation is the darkest, most hidden action from prying eyes.
No one can say for sure whether it was manipulation or not.
Can someone push the market?
You often observe that the price reaches your stop, after which it immediately goes in the right direction, but without you.
Many traders believe that manipulation can be observed in the market .
Someone thinks that every movement is manipulation.
What do you think?
Traders, if you liked this idea or if you have your own opinion about it, write in the comments. I will be glad 👩💻

Why Is The Price Reversing After Hitting Stop Loss?Hello, my fellow Forex traders!
Today we will discuss one, one might say, rhetorical question that often arises among beginners and quite experienced traders. This question is as follows: "Why, as soon as my stop is hit, the price reverses?"
Why does it happen? Does the market see where you put your orders and why does it kick them out to spite you, immediately reversing in the original direction? Let's try to figure out what is the prerequisite for this situation, where most market participants put their stop losses, what to do about it and how to deal with it.
The basic idea
Let's assume you have detected the " Engulfing" pattern on the chart and concluded that the price will go up in the future. It does not matter whether the signal was shown by the indicator or the trading system. The question is, where would you place a stop loss here? Most likely, either under the candlestick or near the last local low.
Everything seems to be fine, but then the price knocks out your stop loss and goes, as expected, up. I think you can give many such examples from your own practice or from observations of other traders.
Why does this happen?
The fact is that in addition to other traders like you and me, there are big players in the market: hedge funds, banks, various institutional investors. They open rather large positions, i.e. positions of very large volume, for opening which they need a sufficient level of liquidity.
If one tries to open such a position in the middle of a trend, high volume can move the price in the direction of the position, but after that the price is likely to roll back leaving the trader at a disadvantage.
Imagine this if you, for example, come to the market to buy potatoes, but not 1 kilogram, but a whole truck. It would seem that you should get a more favorable price as a wholesale buyer, but in fact the more favorable price will be received by the one, who came to buy 1 kg.
So, the big players have to cheat and look for places with a lot of liquidity to sell in order to buy profitably and vice versa. Actually, your stop-loss for a buy position is nothing but a sell order. Accordingly, it is profitable for a large player to take exactly this liquidity in the form of stop-loss and pending sell stop orders, and thus gain his own position without moving the market price much.
You're probably wondering how such a big player could be interested in such small positions. But the fact is that approximately 95% of traders place orders in approximately the same places. Accordingly, since people think alike, the big players don't need to see all the insider information about exactly where your stop loss is, it's obvious enough. After the liquidity has been absorbed, the market goes in its own direction, but without you.
Most market participants place their stop losses at one of these locations:
Local lows/highs;
Support/resistance levels;
Round levels;
Borders of channels, rectangles and other consolidation patterns.
Where do I place a stop loss?
1) The first thing that comes to mind is not to put a stop in principle, no stop - no problem. However, this practice will not suit everyone. If you are new to the market, it is dangerous to work without a stop-loss, that is, to keep it in mind, or to use a virtual one without placing it directly in the market, and such practice often leads to large losses or loss of the entire deposit.
2) Some use various technical tricks, applying the so-called virtual stop-loss. That is, the order will be closed, but it will be closed by an Expert Advisor, not by an automatic market order. But, in fact, it does not matter whether the stop is in the market or not the behavior of the big players will not change from this.
3) The next logical solution is to put a stop loss with a larger margin (at a farther distance). This solution is not the worst and has the right to live. The reserve, however, should not be too large, otherwise you just increase the risk for nothing. This option will not help in all cases, but in general it is not a bad compromise.
4) The opposite solution a very short stop. If it is hit, you can not worry too much and then re-enter the market. This solution also has the right to life, but most often it implies a re-entry. At the same time, if the stop was hit, you need to understand why it happened, and only after analyzing the situation, enter for the second time.
5) You can enter in the same way after a false-break. If you have received confirmation of a false-break, it is possible to use this situation to your own advantage. That is, to enter the market, when the stops of other participants have been knocked out.
6) To calculate the size of a stop loss, you can use not only the chart itself, but also other tools such as the ATR indicator. The ATR readings are usually multiplied by a multiplier, such as 2 or 3. In this case, we have a daily chart and the ATR values are large enough, so a multiplier of 2 will be sufficient. The indicator shows 112 points, so we set a stop loss at a distance of 224 points (112 * 2) from the entry point. In general, as the tests show, this is probably one of the most correct ways to set a stop loss.
Conclusion
You are free to apply any of the listed solutions. Perhaps you will find your own solution to the problem some use fibo, some use ATR. The best solution is the Average True Range indicator. This is a sure way to avoid frequent stop triggering situations with a subsequent price reversal. The main thing is try to think differently than everyone else, keep in mind the big players and their methods of position taking and you will be fine!

HOW THE INTEREST RATE AFFECTS THE FOREXGood day, fellow traders!
The topic of interest rates often appears on the agenda of various media and many are aware that it is closely connected with the global economy and finance and somehow affects the processes taking place in the foreign exchange markets. But what do interest rates really mean and why do they influence Forex trends?
The interest rate is the rate at which the central bank lends to commercial banks. They, in turn, lend to commercial companies based on this official rate. If the rates are high, then the loans are more expensive and so are the goods on the markets, and therefore less competitive. The demand for loans falls, inflation slows down and, consequently, the currency becomes more expensive.
Conversely, if rates are low, then commercial banks and then companies take loans at lower interest rates (sometimes negative), which allows you to sell goods cheaper, the Central Bank prints more money and inflation accelerates the currency becomes cheaper.
Monetary policy: why and how rates are regulated
Rates can be high or low. However, these values are always relative, so it is important to consider the historical trend and the rise/decline in relation to their own historical values.
The central bank raises the rate to prevent the economy from overheating. This happens when there is no room for growth in the economy and prices begin to rise outside of real increases in the production of goods and services, which leads to accelerated inflation and a depreciation in the trade rate of the currency.
A rate hike slows inflation and makes the currency more attractive in the eyes of investors, and commercial banks deposit investor funds at a higher interest rate. In contrast, a rate cut is stimulative and serves to accelerate economic processes, cheap credit for business, low taxes, lower unemployment, and increase business activity. This accelerates inflation and lowers the trade rate of the currency.
When and how often interest rates are changed
Central banks independently determine the timing of interest rate reviews. In the U.S., for example, rates are regulated by the Federal Open Market Committee (FOMC). And needless to say, the whole world is watching their meetings. Usually, special committees of national central banks adopt a particular monetary rate at the beginning of the fiscal year, but, if necessary, they can change it later.
In the EU, the refinancing rate is regulated by the European Central Bank. In the United Kingdom, it is the Bank of England. In Japan it is the Bank of Japan and so on. The markets also take into account the rates of Switzerland, Canada, RBA, Norway, China, India, Korea and some European countries such as France, Italy, Germany, Spain and others.
What happens in the forex market?
If you opened the economic calendar and found that the officials of a national Central Bank are meeting to decide on interest rates then the rates may change and change the trend, depending on whether they are going down or up.
Or rates can remain at the same level, and then the trend will be determined on the basis of the current dynamics: if last time rates were cut then the trend will be bearish, and if they were raised it will be bullish.
As a rule, the prospects for rising or falling rates are repeatedly announced for a long period before they are changed. Long-term investors and position traders take advantage of this to take profits or to avoid risks.
Conclusion
• Watching interest rates is important to understand the global currency trend;
• A decrease in interest rates stimulates the economy and an increase in interest rates cools economic growth;
• If interest rates rise, the currency strengthens; if they fall, it weakens.

FALSE BREAKOUTHow predict a false breakout?
Predicting a false or true breakout is complicated by the fact that the currency rate takes into account everything. The release of news or any unforeseen events, or insider information can make big traders give up their intentions to reverse price or breakout levels.
In most cases currency rates behavior near important lines will show if the breakout is true or false. High volatility is associated with the actions of a large trader, who is "pushing through" the currency rate in order to gather stop-losses and reverse quotes. High volatility and large candles on the approach to the level is a sign of an upcoming false-break.
A true breakout is defined by low volatility, especially in case of a sharp transition to a sideways trend after a strong trend. The phenomenon of volatility narrowing before the resumption of a trend movement is described in details in the literature and in the strategies of various indicators.
False breakdouts usually occur when market volatility is low you will notice that the range of candles becomes small.
False Breakdown Trading Strategies
If we talk about the general approach to strategies for catching reversals from important levels, it is worth highlighting two tactical techniques.
1. Entry after the price returns beyond the key level
The first one is aggressive and the most efficient way to enter by pending order, which is executed after the candle closes behind the level. The break in the resistance level gives the opportunity to place the Sell Stop. The indent of the pending order may be larger or smaller depending on the pair type, timeframe and volatility.
The order will be triggered only upon reversal of prices. The trader should protect the trade with a stop loss, which is placed behind the maximum of a false breakout. Take Profit can be set at the closest support level if the situation with a false breakdown is considered in the growth of the currency market.
In case of the fall the trader places the Buy Stop order. The size of the stop loss is determined by the minimum of a false breakdown candle. After the rebound and the activation of the order, it is necessary to set a take profit at the nearest resistance.
The trader should understand that high volatility is able to activate the pending order without the long tail of the candle and continue the trend movement in the direction of the breakout. Quotes may also fail to reach the take because of low liquidity or an incorrectly chosen level. However, in general, a false breakout is a profitable strategy and can be explained by the logic of the market.
So, the rules in brief:
- After the formation of a breakout level, which we consider to be false, we place a pending Sell Stop order slightly below the level that was broken through;
- We set a Stop Loss order for the maximum of a false breakout;
- Take Profit to the nearest opposite level.
For sell trades, everything is the same.
2. Waiting for a pullback to the key level.
The second method is more conservative, as it requires waiting for a false breakout signal. The tactics requires to wait not only for the quotes return after the price has passed the level, but also for the first correction. This pullback should confirm the resistance/support and breakout falsity.
Once this confirmation is obtained, the trader can enter using a pending order or the market, placing a stop loss after the breakout candlestick and take the order at the nearest support/resistance. The trading tactics in this case does not differ from the considered plan of actions in the first example.
Conclusion
The mechanism of a false-break involves the removal of stop-losses of most traders, which increases the probability of a rebound, i.e. the profit of the trader who caught the reversal. In this case, the first method, aggressive trading, is more justified.
As with any strategy, breakout trading requires the user to fine-tune the strategy by adding additional indicators, testing indents for placing pending orders, developing methods for determining resistance and support lines.

FOREX & COMMODITIES CORRELATIONHello everyone!
Today we will discuss the correlation for some currencies and commodities.
GOLD GROWTH
Recently, gold has risen sharply.
Not everyone knows why and what may happen next.
But if you disassemble gold, then historically, it turned out that in difficult economic moments or in a crisis, dollars are exchanged for gold, since GOLD has historically been considered a rescue tool from inflation.
As you know, inflation eats up the value of the dollar and gold is an excellent tool for saving money.
According to the above, the DOLLAR and GOLD have an inverse correlation, that is, when the DOLLAR falls, GOLD rises and vice versa.
In addition, gold can be an indicator of the future crisis and or acceleration of inflation.
Maybe that's why GOLD is growing now?
CANADIAN DOLLAR AND OIL
Canada occupies one of the first places in the world in oil production.
And, of course, oil plays an important role in the country's economy.
As soon as oil prices rise, the CANADIAN DOLLAR becomes stronger.
Conversely, the fall in the cost of oil has a bad effect on the currency.
SWISS FRANC
Switzerland is historically famous for its economy and its banks.
Trillions of dollars are stored in Swiss bank accounts.
We will not talk about how they get there, where and why, but the main thing is that everyone knows that many people keep money there.
Switzerland is a time-tested country, people trust their country and consider it very reliable.
Do not forget that 25% of Switzerland's reserves are secured by gold.
The currency is very strongly linked to gold and therefore when gold falls, the currency falls too, and when gold grows, the currency grows.
Everything is simple.
There are many correlations of currencies with other assets in the world.
There is also a correlation between currencies.
An attentive trader will be able to identify a pattern and make money on it.
Thanks!
Traders, if you liked this idea or if you have your own opinion about it, write in the comments. I will be glad 👩💻

TRADE FROM ACCUMULATION ZONESHello everyone!
Today I want to analyze a very useful topic - how to trade from accumulation zones .
Accumulation
Surely you have noticed that the price first makes an impulse, then stops, after which it makes an impulse again.
This is the simplest scheme of price movement.
Each stage can be disassembled and a good trader should be able to trade at each stage.
Accumulation is the stage at which the price moves sideways, that is, accumulates.
This stage exists due to the fact that the price cannot constantly move up or down, there are moments when the strength of sellers or buyers ends and you need to take a break, gain a new position and push the price.
Trading is possible inside the accumulation, but using a different technique, today we will discuss how to trade when the price has left the accumulation zone.
beginning
First , you should note the resistance and support levels between which the price moves in the accumulation zone.
They are usually easy to identify.
If you can't identify them, don't trade, wait for a situation that will be clear to you.
Exit
At the moment when the price goes beyond the accumulation limits, we start looking for an entry point.
Most often, if the price has broken through the accumulation zone down, the price will continue to go down.
But there are times when the price makes a false breakout and goes in the other direction.
Such moments occur and you should not forget about them.
It is impossible to always know where the price will go.
If the price has broken through the zone down, you can go straight into the short - it will be an aggressive entry.
It is aggressive because there is a possibility that this is a false breakdown and the price will go further up.
A conservative entry will be when the price rolls back to the zone and begins a reversal from it.
A reversal means that the price cannot go higher back into the zone and will fall down.
Similarly, long trades are opened only in the other direction.
As you can see on the chart, accumulation zones appear not only during the reversal, but also during the continuation of the trend.
In situations where the price after the accumulation zone went further towards the previous trend, it means that the trend is strong enough, although there was resistance on the other side.
Positions are always opened the same way:
1. Identify the area of the field.
2. Waiting for the breakdown.
3. Looking for an entry point (aggressive entry or conservative).
This technique is very simple and it works quite well .
The main thing is to follow the rules and don't risk too much.
In addition, the direction on the higher timeframe is important.
And don't forget the most important rule: the trend is your friend .
Thanks!
Traders, if you liked this idea or if you have your own opinion about it, write in the comments. I will be glad 👩💻

8 Easy and Effective Ways to Improve Intellectual PerformanceToday we are going to talk about personal effectiveness. Have you ever noticed that as you get older, it becomes more and more difficult to concentrate, study large amounts of information, evaluate variants of events, etc.? And in trading it is impossible to do without it. And not only at Forex, but also in real life. The 21st century is the century of information. I will share with you ten simple and effective ways to increase mental performance, and you can implement them today. Without too much effort.
1 Start the day with physical activity
This is the hardest to follow of the tips presented here. But it works. Physical activity first thing in the morning, on an empty stomach, helps to get the blood and oxygen flowing through your body. As a result, you have clarity of thought during the day, it is easier to concentrate, and the work goes easier. What kinds of activities? It's up to you. I practice yoga in a light form, someone runs, someone swims, someone can do physical exercises, even a short walk will do. The main condition is that your "warm-up" should be at least 15-20 minutes.
2 Make a to-do list
Make a list of ABSOLUTELY all the things you have to do. Not just work stuff, but plans like: go out, buy something, go on a summer vacation, change the tires on your car, walk your dog, read a book called Think and Get Rich. In short, absolutely ALL things to do.
3 Take a break every hour
The human brain is built in such a way that for about 20 minutes it speeds up, adjusts to the task. At the 30th minute it reaches the peak of activity, and then there is a decline. After 40-50 minutes of intellectual work, the body needs to rest. You have probably noticed yourself how after an hour of work there is a "dullness. This is a sure sign that you need a break. So, do not give your body too much stress, take a break every hour. 10 minutes is just enough time to recover and get back to work. During the break you can relax by lying on the couch, play some simple game, like on the phone, or give yourself a little physical workout.
4 Drink water
Continuing the topic of how our brain works, it is worth mentioning that it needs “moisture” to function properly. Insufficient supply of water to the brain is another cause of dullness. Don't let your head go dry. Drink a glass of clean water every 2 hours. Not coffee, not tea, but just water.
5 Four hours per day to work
This may sound like an excuse for laziness, but there have been studies in which scientists have found that a person can PRODUCTIVELY work intellectually for no more than 4 hours a day. Meaning pure working time, minus breaks and interruptions. Of course, a person can work more hours, but after 4 hours the productivity and quality of intellectual activity drops significantly. Therefore, if possible, try to work less time, but more productively as a result.
6 A daytime nap is useful
It is no wonder that kids in kindergarten are put to bed in the afternoon. A nap during the day is very good for the body. Google even has special pods in its offices where employees can take an hour nap. If possible, try to give yourself an hour after lunch for a nap. After you wake up, you will get a lot more done than if you had worked without a break.
7 Walk
Studies have found that people who walked 1-2 km a day worked much better than those who neglected walking. Richard Bach, the famous esoteric writer, also mentions in one of his books about the "Walking Fairy". As you know, ideas often come up while walking, Bach personified their appearance in the form of the Fairy, who gives you new thoughts as you walk down the street.
8 Don't drink too much alcohol
The advice is obvious, but relevant. Systematic alcohol consumption destroys the hippocampus, the part of the brain responsible for memory, orientation in space, its destruction can even lead to Alzheimer's disease. You do not want to become an idiot, requiring the constant supervision of doctors? But if you want to drink, drink it in moderation.

JS-Masterclass: Sell Alerts / RulesJS-Masterclass #10: Sell Alerts / Sell Rules
In recent tutorials, we have covered different techniques and ways to identify low-risk entry points. We have talked about the perfect buy points and several entry patterns.
In this tutorial, we will discuss general rules for selling once we have entered a trade. Also, we will present a comprehensive list of warning signals which suggest to close a trade long before hitting the Stop-Loss.
1. Selling into strength
By far the best option for a swing-trader is to sell into strength. You will feel like a hero once you have mastered this technique!
Here are some guidelines for that:
a) Sell if you have achieved a gain which is a multiple of your risk. The minimum gain before selling into strength should be 2x the risk. Consider selling half and moving stop on remaining position to breakeven.
b) If your profit is more than your average gain and a multiple of your risk (generally 2-3x) consider trailing a stop or selling half and moving your stop up. You could also “backstop” your average gain or an amount you want to lock in.
c) The stock is extended and opens up on a gap; consider selling at least half or trail a tight stop.
2. Selling into weakness
a) The price hits pre-determined stop-loss – OUT… NO QUESTIONS! You will have to stick to this discipline before you will become a successful trader.
b) The stock closes below 20-day moving average, below your purchase price soon after a breakout from volatility contraction pattern; reduce shares when you have 3-4 days of lower lows without supportive action on day 3-4. This increases the odds of a failure.
c) Heavy selling with full retracement soon after low volume breakout. This is a bad signal – get out of the trade.
d) Key reversal on heavy volume when stock is extended – sell at least half.
3. Sell Alerts
Stocks will flash warning signals long before a big decline. Here are some to watch for:
a) Accelerated rate of advance (parabolic “blow-off” price action)
b) After extended move stock moves up 25-50% in 1-3 weeks (12 of 15 days up over 3 weeks)
c) Largest up day since beginning of move (look for reversal or churning over the next 1-4 trading days). This could mean that the stock is in its final leg up and almost exhausted.
d) Largest daily price spread since advance started
e) Largest weekly price spread since beginning of advance
f) Exhaustion gaps (after stock is extended – usually 2nd or 3rd gap )
g) New high on low volume which sometimes indicates the beginning of a phase 3
h) Heavy volume with little price progress (stalling action)
i) Drop below the 50-day moving average line on the heaviest daily volume since beginning of move
j) Largest one-day decline since beginning of move
k) Largest weekly decline on huge volume
l) Downwards action on large volume

PSYCHOLOGICAL PRICE LEVELSPsychological price levels
Today we will talk about the psychology of the crowd, about price levels, which attract most of the traders and what we should do about it all what levels to pay attention to and how to place orders near them to enter/exit the market.
Round levels
Remember the last time you went to the store and saw the price for something, say, 3.95 $, you automatically rounded it up to 4.00 $.
This is a normal human tendency to simplify things. It's inherent in traders. That's why levels multiple of a hundred (with two zeros at the end) are so attractive to the crowd. It's at levels like 1.3300, 1.5000, 1.2600, etc. that the real struggle between bears and bulls takes place. And who will win is unclear. However, in any case the round price levels are an obstacle, so we can say that price levels divisible by a hundred (00) are support/resistance levels for the price.
High activity forex price levels
When trading intraday, high activity is observed at certain price values. We've already mentioned 00 levels, and it's clear that they're attracting attention. But there are other levels, which should not be forgotten by fans of intraday trading. 20, 50, 80 - levels of increased activity in intraday trading. The examples: 1.2050; 1.3280; 0.9020.
Why on levels 20, 50, 80 there is a big accumulation of Forex orders? The matter is psychology again. 50 is half of the way from one round level to the other. You have to agree that when half of it is done, it becomes much easier to work, right? It's the same with price.
Regarding levels 20 and 80, the situation is similar. Until the quotes get to, say, 1.3120, i.e. hang around 1.3115, it looks like the price has barely moved away from 1.3100. There is nothing to act upon. And when the barrier of 1.3120 is reached, the way for the price to go higher becomes open. Naturally, we are now talking about a psychological point of view.
The situation with the level of 80 is similar. As soon as the price reaches 1.3180, the trigger "close to 1.3200 level" triggers in our mind and it is the same for other traders.
How to place orders considering the price levels of increased activity?
Market entry at key levels. Not only we but also market makers know about the levels of increased price activity and accumulation of orders. That's why it often happens that the price does not reach a round level and turns around. Even entries at levels with multiple orders of other traders lead to requotes, i.e. losses of potential profit. Therefore, you should enter the market 5 points above or below (depending on the situation and position) a level, but not at the levels themselves. That is, if you opened a buy with a target of 1.3100, it is better to move the take profit to 1.3095.
Do not give the psychological level miraculous properties that will necessarily provoke a sharp reversal or a powerful rally from these levels!
Psychological levels are like any other resistance and support levels should be considered by traders as decision-making levels. When price reaches decision levels, traders begin to consider their next moves. These levels are themselves a basis for action, some traders see them as a good place to buy, while others are going to sell at them. The final outcome depends on the outcome of the battle between the bulls and the bears, who represent supply and demand, respectively. It's best for you and me not to get involved in the battle, but just to watch it and wait for the winner to be determined.

How to Pick the next Winners? CAN-SLIMA successful trading strategy starts with sound stock selection criteria. Our JS-TechTrading strategy combines the timeless and success proven principles of Mark Minervini's SEPA (R) analysis and William O'Neils' CAN-SLIM (R) methodology.
This tutorial describes the CAN-SLIM (R) methodology in detail:
CAN-SLIM refers to the acronym developed by the American stock research and education company Investor's Business Daily (IBD). IBD claims CAN-SLIM represents the seven characteristics that top-performing stocks often share before making their biggest price gains. It was developed in the 1950s by Investor's Business Daily founder William O'Neil. The method was named the top-performing investment strategy from 1998-2009 by the American Association of Individual Investors.
CAN-SLIM is a growth stock investing strategy formulated from a study of stock market winners dating back to 1953 in the book How to Make Money in Stocks: A Winning System In Good Times or Bad. This strategy involves implementation of both technical analysis and fundamental analysis.
The objective of the strategy is to discover leading stocks before they make major price advances. These pre-advance periods are "buy points" for stocks as they emerge from price consolidation areas (or "bases"), most often in the form of a "cup-with-handle" chart pattern, of at least 7 weeks on weekly price charts.
The strategy is one that strongly encourages cutting all losses at no more than 7% or 8% below the buy point, with no exceptions, to minimize losses and to preserve gains. It is stated in the book, that buying stocks of solid companies should generally lessen chances of having to cut losses, since a strong company (good current quarterly earnings-per-share growth, annual growth rate, and other strong fundamentals) will usually shoot up—in bull markets—rather than descend. Some investors have criticized the strategy when they didn't use the stop-loss criterion; O'Neil has replied that you have to use the whole strategy and not just the parts you like.
O'Neil has stated that the CANSLIM strategy is not momentum investing, but that the system identifies companies with strong fundamentals—big sales and earnings increases which is a result of unique new products or services—and encourages buying their stock when they emerge from price consolidation periods (or "bases") and before they advance dramatically in price.
The seven parts of the acronym are as follows:
1. C stands for Current quarterly earnings. Per share, current earnings should be up at least 25% in the most recent financial quarter, compared to the same quarter the previous year. Additionally, if earnings are accelerating in recent quarters, this is a positive prognostic sign.
2. A stands for Annual earnings growth, which should be up 25% or more over the last three years. Annual returns on equity should be 17% or more
3. N stands for New product or service, which refers to the idea that a company should have continuing development and innovation. This is what allows the stock to emerge from a proper chart pattern and achieve a new price. A notable example of this is Apple's iPhone.
4. S stands for Supply and demand. A gauge of a stock's demand can be seen in the trading volume of the stock, particularly during price increases.
5. L stands for Leader or laggard? O'Neil suggests buying "the leading stock in a leading industry." This somewhat qualitative measurement can be more objectively measured by the Relative Price Strength Rating of the stock, designed to measure the price performance of a stock over the past 12 months in comparison to the rest of the market based on the S&P 500 (or the S&P/TSX Composite Index for Canadian stock listings) over a set period of time.
6. I stands for Institutional sponsorship, which refers to the ownership of the stock by mutual funds, banks and other large institutions, particularly in recent quarters. A quantitative measure here is the Accumulation/Distribution Rating, which is a gauge of institutional activity in a particular stock.
7. M stands for Market Direction, which is categorized into three - Market in Confirmed Uptrend, Market Uptrend Under Pressure, and Market in Correction. The S&P 500 and NASDAQ are studied to determine the market direction. During the time of investment, O'Neil prefers investing during times of definite uptrends of these indexes, as three out of four stocks tend to follow the general market direction.

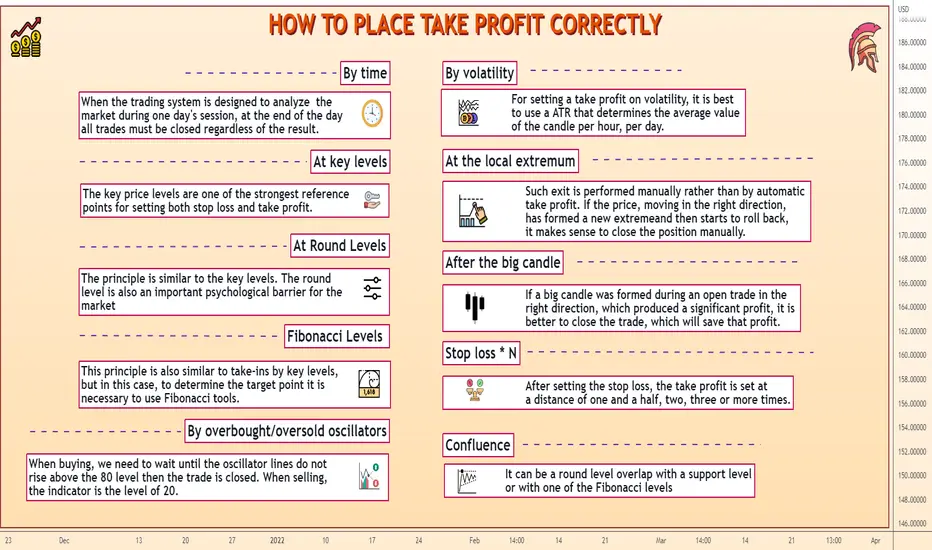
HOW TO PLACE TAKE PROFIT CORRECTLYExit from a position is often more important than entering. We all constantly hear that trading without stops is impossible, but too little attention is paid to taking profit. It's time to correct this misunderstanding. Today's article will discuss the importance of take profit.
Take Profit Methods
There are many different methods of taking profit. They may vary depending on the trader's trading style and the rules of his trading strategy.
By time
This method is effective, for instance, in intraday trading. When the trading system is designed to analyze the market during one day's session, at the end of the day all trades must be closed regardless of the result. For example, if a trader opens a sell position in the morning, at 9 o'clock, then at 23 o'clock, when the American session comes to an end and trading slows down, he/she should exit the market.
At key levels
The key price levels are one of the strongest reference points for setting both stop loss and take profit. The level, at which the price slowed down or turned around earlier, may become a strong support or resistance, depending on which side of the open position it happened to be on. That is why setting the Take Profit at this level is the most reasonable: if the price moves in the necessary direction, it will most likely reach the key level, but whether it will succeed in breaking it is a big question. That's why it is better to take your profit when the price reaches the important level, and if it breaks it later, open a new trade.
At Round Levels
The principle is similar to the key levels. The round level is also an important psychological barrier for the market, but not always break at the first time. For scalpers and intraday traders, except for round levels (1.2500, 1.2600, etc.) the levels, ending at 20, 50 and 80 (1.3420, 1.3780, etc.) are important.
Fibonacci Levels
This principle is also similar to take-ins by key levels, but in this case, to determine the target point it is necessary to use Fibonacci tools. Fibonacci lines extend on the basis of the previous trend, and give a reference point for the price movement in the opposite direction (correction). When opening a trade after a trend reversal, a good target will be the 61.8 level.
The mark where the Fibonacci level coincides with the round level or support/resistance will be the best option for taking profit.
Confluence
The optimal Take Profit target will be confluence (overlapping) of several levels. For example, it can be a round level overlap with a support level or with one of the Fibonacci levels, or with all of them at once. The more levels are combined at one mark, the stronger it becomes and the more effective the Take Profit will be.
By volatility
For setting a take profit on volatility, it is best to use a special service that determines the average value of the candle per hour, per day and other statistical indicators. The take profit will be set on their basis. When trading intraday, the trader will be interested in the average value of the daily candle. If, for example, a GBPUSD price moves 100 pips on average during the day, and a trade is opened when the price has already moved 20 pips in the direction you want, you should not expect more than 80 pips from this trade. Taking profit on volatility is a common option, but it makes sense when the trader has no other reference points, such as key levels.
At the local extremum
Such exit is performed manually rather than by automatic take profit. If the price, moving in the right direction, has formed a new extreme and then starts to roll back, it makes sense to close the position manually. A new extreme shows that the movement has currently exhausted itself and it is unknown whether the trend will resume. In this case, a new level has already been formed in the price path, which will complicate further movement. Even if the take profit was set earlier and the price did not reach it, in such a situation, it is better to close the position manually and take the profit that is available at the moment.
After the big candle
One more variant of closing the position manually. As a rule, after the formation of a large candle there is a slowdown and correction, sometimes quite strong. If a big candle was formed during an open trade in the right direction, which produced a significant profit, it is better to close the trade, which will save that profit.
By overbought/oversold oscillators
This method of exiting the trade is also done manually and will require the personal presence of the trader at the terminal. One of the oscillators must be installed on the chart of the asset most often Stochastic is used to determine the overbought/oversold condition, but you can also work with the RSI or Bill Williams indicators. When buying, we need to wait until the oscillator lines do not rise above the 80 level then the trade is closed. When selling, the indicator is the level of 20. On other oscillators, levels may be different (sometimes you have to set them yourself), but the principle is the same everywhere. The disadvantage of this method is that in a long trend the oscillator gets into the overbought/oversold area rather quickly and stays there, or starts oscillating up and down as the price moves in one direction. As a result, the trader closes the deal at the beginning of the trend, taking only a small part of the possible profit. This drawback can be compensated by adjusting the sensitivity of the indicator.
Stop loss * N
One of the easiest ways of setting a take profit, but it requires the proper setting of stop loss. After setting the stop loss, the take profit is set at a distance of one and a half, two, three or more times. Thus, a positive mathematical expectation of trade is provided. But the market is not bound to such ratios. The factors that really influence the price at the moment are not taken into consideration when taking a take profit. In some cases (for example in scalping) take profit can be even less than stop loss value. However, this is rather an exception to the rule, and in order to ensure a positive result in the long term, you need to ensure that the potential profit is greater than the loss, even setting a take on the levels or volatility.
There are many ways of taking profit, and each of them has its advantages and disadvantages. Taking profit on levels, and in those places where they coincide, for example, with round price values or Fibonacci levels, is an optimal variant according to a number of factors. However, you should also remember about the ratio of stop loss and take profit and positive mathematical expectation.
If you trade on a specific trading system, it is likely that it will already have specific rules for taking profit. If there are no rigid frameworks in this regard, it is necessary to choose the method that best suits this TS, taking into account all the general recommendations, as well as the need to comply with the rules of money management.
Multiple Timeframe AnalysisWhen traders ask "what was your light-bulb moment in trading", I often say 2 things:
1) stop worrying about what other traders are doing and focus on yourself making sure you are consistent with the trading strategy as that's how you will get consistent results.
2) understanding multiple timeframe analysis.
Once I started focusing on myself and was consistent with my trading, I was able to review my journaled trading results and noticed by best trade setups happened when price has multiple timeframe correlations with both my enter timeframe and higher timeframe.
The main purpose of the higher timeframe is to help me determine if I should be looking for buys, sells, or staying out of the market. The 2nd purpose of the higher timeframe is to determine the trend.
Multiple timeframe analysis can be used on all trading strategies whether you trade supply and demand, support and resistance, chart patterns, or use trading indicators.
All we are trying to do is determine whether we should be looking for buys, or sells as this will help us increase the probability of our trade.
See Chart For Analysis. I also have a full break-down on my youtube: Moneyball Austin

Bites Of Trading Knowledge For New TOP Traders #17 (short read)Bites Of Trading Knowledge For New TOP Traders #17
----------------------------------------------------------------
What is a custodian? -
A custodian is a financial institution that holds customers' assets or securities for safekeeping to prevent them from being stolen or lost. The custodian may hold equities, bonds, derivatives, or other assets in electronic or physical form on behalf of its customers. Custodians could offer related financial services such as account management and reporting, transaction settlement, and compliance related to anti-money laundering and tax regulations.
What is an exchange? -
An exchange is a venue where buyers and sellers trade equities, bonds, derivatives, and other tradable assets. Exchanges are often regulated by financial regulators and provide liquidity, which give market participants the ability to buy and sell assets at a fair market value.
What is a financial regulator? -
Governments have various agencies in place given the responsibility to regulate and oversee financial markets and companies participating in the financial system. These agencies each have a specific range of duties and responsibilities that enable them to act independently of each other while they work to accomplish similar objectives. For example, in the United States, the Securities and Exchange Commission (SEC) has oversight of the securities industry (stocks and shares), whereas the Commodity Futures Trading Commission (CFTC) regulates and oversees derivative markets (futures, swaps, and options).
RISKS AND OPPORTUNITIES FOR CORPORATES AND INDIVIDUAL INVESTORS -
Common application of financial market instruments for managing risk and opportunities.
Position and Risk Management
Risk management is the responsibility of market participants designed to limit risk exposures that specifically applies to the participants financial profile in the market.
The financial profile of a participant may include their role in the financial market or the amount of capital under their responsibility to be managed in the market, and therefore the risk variables that each would need to identify may be unique.
For both corporate and individual investors, the market to trade would be a key variable to clearly state and support with reasons for trading or investing. Reasons for selecting one market over another could include price volatility, liquidity, daily volume traded, size of the minimum price increment, and value of the minimum price increment. Comparing these variables between markets will help decide the suitability and/or risk of each.
For example, if Mini-Brent Crude Oil futures (BM) moves around $2.00 per day (or 2 points) and a point is worth $100, a trader might experience a $200 fluctuation in their account balance for one day. Another example is the U.S Dollar / Singapore Dollar (USDSGD), which could move 70 pips or more per day and trading a standard lot size with each pip worth $10, a $700 fluctuation could be expected for one day.
Market participants may also manage their risk through the size of their positions. The larger their position size, the greater is their exposure and the smaller their position size their exposure is lower. Investors should determine the risk that would result from various position sizes and select the size that ensures that their risk limit is not exceeded. Finally, setting stops with a specified loss amount provides protection if the market does not move in the desired direction. It helps to prevent creating a loss scenario which is larger than an account can handle.
TRADDICTIV · Research Team
--------
Disclaimer:
We do not provide investment advice, nor provide any personalized investment recommendations and/or advice in making a decision to trade. Before you start trading, please make sure you have considered your entire financial situation, including financial commitments and you understand that trading is highly speculative and that you could sustain significant losses.

HOW TO GET IN TRADING ZONEI'm sure many of you have read Mark Douglas' excellent book, "Zone Trading. So how do you get into the "zone", that state in which you are most productive and make smart decisions? You can put into practice a highly effective exercise that will allow you to focus your attention and also allow you to take your focus away, especially from any negative thoughts that may be griping you, from any doubts and fears that could cause you to close a position too early or move your stop loss.
One of the key aspects of getting into the "trading zone" is the ability to stay in the present and focus on current events. Practicing the specific concentration skills outlined in this article will not only help you better focus and master the related skills, but will also help you more deeply develop your ability to stay present, notice and pay attention to those factors that are critical to your trading performance, while being able to avoid the distractions and obstacles that typically lead to poor performance, frustration and lack of discipline.
Exercise on Concentration for Entering the "Trading Zone"
1. Begin by focusing on your breath. Concentrate on the inhale and exhale. Just focus on the periodicity of your breathing.
2. Continue to focus on your breath for a set period of time, aim to do this for 10 minutes.
3. You will probably find that your thoughts lag behind your breathing. This is natural, this is how our mind works. Just focus on your thoughts. Let them go. Then focus back on your breathing.
4. Repeat this further until your allotted time for this exercise is up.
This is a simple but very powerful exercise that helps you develop not only the ability to sustain your attention, but also the ability to turn it on. Two very important activity skills.
Do the exercise daily for 10 minutes.
Visualization
Perhaps one of the most powerful and useful aspects of psychological training as a forex trader is the use of visualization.
Every action, feeling and behavior you have is the result of the activation of neural pathways in the brain. Neural pathways are the connection or system of connections between neurons in the brain. Essentially each pathway is a morphological model for a particular intellectual skill, feeling or behavior. These neural pathways are created and then developed and reinforced through practice and repetition, developing into a particular psychological concept, and after a while they become automatic - habitual. It is somewhat like walking through a field of wheat. The more often you walk along the same path, the more you tread the wheat, and the clearer and more visible your path becomes.
Using visualization will give you the opportunity to practice and take part in Forex trading even if you can't access the real markets, thus accelerating your development. You can use visualization more effectively in order to cope with losses or drawdowns, to overcome unhealthy habits and develop new ones useful for trading, to access and create in yourself a sense of confidence to be mentally prepared to trade in the markets or to contribute to achieving your trading goals.
Visualization should involve several senses (vision, hearing, sensory perceptions); it is better if it is preceded by a brief relaxation; visualization should be performed for 5-10 minutes.
Psychological training increases your potential for trading results and by applying it regularly in practice, you can develop new neural pathways in your brain, which will raise your stress threshold, provide conditions for the development of various emotional reactions and states, new and desirable principles of behavior in trading. Try the above exercises in practice.

JS-Masterclass #7: Trade AnalysisJS-Masterclass #7: Confirmations & Violations
In previous tutorials, we have covered the stock selection process and the identification of low risk, high probability entry point following constructive consolidation patterns.
Now that we are in the trade, the question comes up what to look for. What makes the price action healthy so that you rather stay in the trade and what are the alarm signals to look for?
The Founder of the Berger Funds and Stock Market Legend Bill Berger said:
“I buy tennis balls and sell eggs.”
What does that mean?
‘Tennis-Balls’ are characterized as follows: after a breakout under high volume out of a constructive consolidation pattern, most stock will pull back after a couple of days. This pullback for ‘Tennis-Balls’ normally happens under low volume and is followed by a strong price increase under heavy volume. Just like a tennis ball immediately pooping back after a drop to the ground.
‘Eggs’ are characterized as follows: The above mentioned pullback after a breakout happens under high volume and the stock is not able to recover from this pullback. Just like an egg which drops down to the ground.
What you do want to see after you have entered a trade:
• The trade is immediately profitable
• Good volume characteristics (high volume on up-days and low volume on down days)
• High volume rallies – low volume pullbacks
• Follow through buying (2-3 days or more) – institutional vs. retail
• More up days than down days
• More good closes than bad closes
• Look for ‘Tennis Ball Action’ after a ‘Natural Reaction’. A ‘Natural Reaction’ can be considered as a pullback under low volume following a breakout.
What you do not want to see after you have entered a trade:
• Squat directly after breakout
• Low volume out of a base - high volume back in
• 3 or 4 lower lows w/o supportive action
• More down days than up days
• More bad closes than good closes
• A close below the 20d MA on high volume
• A close below the 50d MA on high volume
• Full retracement of a good size gain
• Wide and volatile price action
• Outside day: high is higher than high of the previous day but closes below the low if the previous day. This happens on higher volume versus the previous day

Educational Series: Trading with Bollinger Bands (Part 2)The Bollinger Reversal is my absolute favorite and most valuable perspective of the Bollinger Bands.
Have you ever
- seen the price move strongly in a direction, but the moment you get into a trade, the price reverses almost immediately?
or
- held on to a profitable trade, hoping to hit a take-profit level, only to see your profits whittle away as the price reverses.
The Bollinger Band can help prevent
1) FOMO leading to Late Entry and
2) Greed leading to Late Exit
Look at the yellow spots on the charts
- The spots indicate when the price had traded outside of the 2std deviation of the Bollinger Band (either the lower or the upper bound).
- When the price trades outside of the Bollinger Band, two things are highly likely to happen :
1) the price reverses back before the current candle loses , leading to possibly the development of a pin bar (which usually signals a strong reversal candlestick pattern).
2) the price closes outside of the Bollinger Band and the subsequent candle is a strong retracement , back toward the Moving Average and possibly a stronger reversal.
The Bollinger Reversal can be applied to ANY timeframe (M1 through to D1)
When the price is outside of the Bollinger Band, you should choose to avoid entering a trade , as the price is likely to reverse. And if you are currently in a trade, and the price has broken out of the Bollinger Band, you might want to consider securing the profit .
However, some more aggressive traders could even choose to trade the short-term reversal.
Remember....
- This is a technical indicator. You shouldn't use technical indicators solely.
- Combine it with other forms of analysis, Price Action, Fundamental Analysis, Sentiment, and Other types of indicators.
The more confluences you can have, the more confidence you will have
