Epstein impact on the GBPUSD The release of more Epstein files last week has left U.K. Prime Minister Keir Starmer fighting for his political life and possibly inject volatility into British pound pairs.
The controversy centres on Peter Mandelson and his relationship with Epstein. Starmer appointed Mandelson to U.K. ambassador to the US despite knowing his relationship with the convicted pedophile.
The pressure on Starmer intensified when two senior aides resigned in quick succession: his chief of staff, Morgan McSweeney, followed by communications director Tim Allan.
Starmer remains Prime Minister, but questions remain as to how much longer.
The 1.3500 to 1.3450 zone is the key area to watch on the downside for GBPUSD. A daily close below this zone could weaken the bullish structure. EURGBP provides important confirmation. The cross remains capped below the 0.8750 to 0.8800 resistance area. As long as EURGBP stays contained below this zone, sterling weakness might appear limited.
UK

UK 10Yr Gilts - coiling inside a pennant off a flagpole.I believe this chart shows UK 10Yr Gilt Yields are coiling inside a pennant off a flagpole and could run to nearly 10% by July 2028.
Likely breakout date is W/C 26th May 2026
There is a clear Gap to fill from back in 1989

UK Unemployment through the lens of an Elliot Wave ChartistThought I would look at the data available here for UK Unemployment in the same way I would a chart for a stock accepting it is far from complete dataset.
Looks to me like a big 38-year A,B,C down trend in the form of a two a,b,c moves down and one countertrend 1,2,3,4,5.
Assuming thie figure continues to rise and breaks higher past (b) at 5.31% then I'd suggest it is going way, way higher .... to at least the 1.618 Extension level at 17.35%
That's a huge move but given the current UK economic malaise, the incompetence of the current government and the looming impact of AI then it seems entirely credible figure.

GBP/EUR Outlook: Sterling Plunges on Inflation MissMarket Volatility and Economic Shifts
The British Pound (GBP) crashed violently on Wednesday. Markets reacted instantly to the UK’s surprising inflation data. Headline inflation dropped to 3.2% in November. This figure missed the 3.5% forecast significantly. Core inflation also fell to 3.2%, signaling deep economic cooling. Traders immediately bet on a Bank of England (BoE) rate cut. The sudden drop reshapes the short-term currency landscape completely.
Geostrategy and Monetary Divergence
A clear strategic gap now exists between European powers. The BoE must prioritize growth, forcing a dovish pivot. Officials will likely cut rates to stabilize the economy. In contrast, the European Central Bank (ECB) holds firm. ECB President Lagarde maintains a strict, neutral policy stance. This divergence draws global capital away from London. Investors now favor the stability of the Eurozone.
High-Tech Trading and Cyber Impact
Modern currency moves often stem from automated systems. High-frequency trading algorithms executed massive sell orders on Wednesday. These bots react to data variances in milliseconds. The inflation "miss" triggered pre-programmed selling cascades. This cyber-driven volatility punishes currencies instantly. Human traders struggle to match this algorithmic speed. Such technological dominance defines current market liquidity.
Business Models and Industry Trends
Currency devaluation impacts UK corporate strategy deeply. Importers face immediate cost spikes, squeezing profit margins. Management teams must renegotiate supply chain contracts quickly. Conversely, the high-tech export sector gains a competitive edge. Cheaper Sterling makes UK innovation more attractive abroad. This shift rewards companies with agile, export-oriented business models.
Innovation and Patent Analysis
A lower exchange rate can stimulate scientific investment. UK firms often rely on foreign capital for R&D. A cheaper Pound makes UK assets and patents attractive targets. Foreign investors may acquire undervalued British intellectual property. This trend could accelerate cross-border mergers in biotech and science. However, retaining top talent becomes harder with a weaker currency.
Forecast: The Policy Path Ahead
Attention now locks onto the BoE’s forward guidance. Investors demand a clear roadmap for 2026 interest rates. A confirmed dovish stance will drive Sterling lower. Meanwhile, the Euro stands resilient despite mixed German data. The policy gap between the UK and the EU is widening. This structural divergence points to further GBP/EUR downside.

$GBIRYY -U.K Inflation Rate (October/2025)ECONOMICS:GBIRYY 3.6%
October/2025
source: Office for National Statistics
- The UK’s annual inflation rate eased to 3.6% in October,
its lowest in four months, down from 3.8% in each of the previous three months.
The figure matched expectations from both the Bank of England and market analysts,
supported by a slowdown in gas and electricity prices.

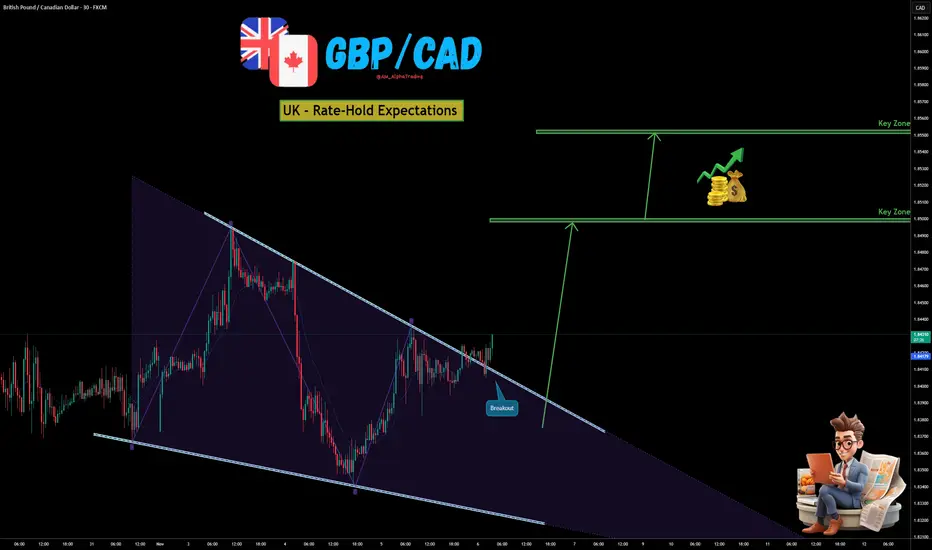
GBP/CAD - UK Rate Hold Expectations!The GBP/CAD Pair, Price has been trading within a Wedge Pattern on the M30 chart, forming consistent higher highs and higher lows. Price action is now testing the upper boundary of the Pattern, signalling a possible breakout.
✅Market Context:
1️⃣Strong Upward Structure Inside the Pattern.
2️⃣Buyers are showing strength near Resistance.
3️⃣Breakout above the Trendline indicates Momentum continuation toward higher zones.
✅Trade Plan:
Entry: Buy after Confirmed Breakout above the Resistance (H1 candle close above trendline or retest of the breakout).
💰Take Profit (TP): At the Key Zone – a Major Resistance area identified ahead.
🛑Stop Loss (SL): Below the Pattern Structure.
✅Psychological Discipline :
1️⃣Stick to plan – No Revenge Trades.
2️⃣Accept losing trades as Part of the Strategy.
3️⃣Risk only 1–2% of your account balance per trade.
💬 Support the community: If you found this useful, drop a 👍 like and share your thoughts in the comments!
⚠️ Disclaimer: This analysis is for educational purposes only and does not constitute financial advice. Forex trading involves high risk. Trade only with capital you can afford to lose and always do your own research.
No U.S. data? No problem The U.S. government shutdown is now entering its second month, delaying crucial trading data. With limited insights coming from Washington, investors might like to pay attention to the data coming from elsewhere to make their trading decisions.
This week, central banks in Mexico, Brazil, England, Sweden, Norway, and Australia are set to announce monetary policy decisions.
Perhaps the most important of the bunch is the Bank of England decision. They are expected to keep their key rate unchanged, but speculation about an upcoming rate cut is growing. The Reserve Bank of Australia follows closely in importance and is also expected to hold rates steady at 3.6%, despite persistent inflation pressures. So, we might see a couple rate cut surprises here.
Additionally, Mexico and Switzerland will release their latest inflation data.
Earnings season continues as well, with reports due from Palantir, Berkshire, AMD, Uber, and McDonald’s.

GBP sinks as “Santa cut” possibility grow Sterling is under pressure after the UK’s September inflation data came in softer than expected. Annual inflation held steady at 3.8%, below forecasts of 4%, strengthening expectations that the Bank of England could deliver a “Santa cut” in December. Markets are now pricing a 72% chance of a rate reduction before year-end.
The weaker inflation print triggered a classic market reaction, with GBP/USD falling below its 200-hour moving average, its lowest level in a week, as sellers gain control and shift sentiment to a more neutral-to-bearish bias.
Immediate support potentially lies near 1.33055, followed by the key level at 1.32484. Sterling bulls, meanwhile, might have trouble justifying an attempt at the daily moving average that capped the pairs late October rally.

$GBINTR - B.o.E Leaves Rates Unchanged (August/2025)ECONOMICS:GBINTR
August/2025
source: Bank of England
- The Bank of England voted by a majority of 7-2 to hold its benchmark Bank Rate at 4% today, following a 25 bps cut in August, and in line with expectations, as it navigates slow growth alongside still-elevated inflation.
Policymakers noted that a gradual and cautious approach to further easing monetary restraint remains appropriate.
The central bank will also slow the pace of bond sales to £70 billion from £100 billion and will move away from sales of longer gilts.

Head & Shoulders Top Threatens GBPUSD Rally! Bearish Swing Trade🔮 GBPUSD Technical Forecast & Trading Strategy | Week of Sept 6th, 2025
Current Spot Price: 1.35064 | CFD | Date: Sept 6, 2025
🟢 Overall Bias: CAUTIOUSLY BEARISH | Primary analysis suggests a potential corrective pullback is imminent. However, the broader bullish trend on higher timeframes remains intact until key support breaks.
📊 Multi-Timeframe Technical Breakdown
1. Chart Pattern & Theory Convergence:
⚠️ Potential Head & Shoulders Top (H&S) Formation: On the 4H chart, a developing bearish reversal pattern is visible. The left shoulder, head, and a forming right shoulder suggest a pullback towards the neckline near 1.3420-1.3400 is possible.
📐 Gann Theory & Square of 9: Key Gann resistance was evident near 1.3520-1.3530. The current rejection from this zone adds credibility to the bearish short-term outlook. The next major Gann support level aligns with the H&S target around 1.3400.
🌊 Elliott Wave Theory: Price action from the recent low appears to be completing a 5-wave impulsive move up. We are likely entering a corrective Wave A or B pullback.
🦀 Harmonic Patterns: The rally has approached a potential Bearish Crab or Bat pattern completion zone, where PRZs (Potential Reversal Zones) often coincide with Fibonacci extensions (e.g., 1.618). This reinforces the resistance area.
2. Key Indicator Signals:
📶 RSI (14): On the 4H chart, the RSI is showing a clear bearish divergence 📉. Price made a higher high, but the RSI made a lower high. This is a classic warning sign of weakening bullish momentum.
📏 Bollinger Bands (20,2): Price has kissed the upper band and is pulling back towards the middle band (20 SMA ~1.3460), which will act as immediate support. A break below could target the lower band.
⚖️ VWAP & Anchored VWAP: The price is trading above the daily VWAP, indicating the average buyer is still in profit. However, a break below a key Anchored VWAP (from the last significant low) would signal a shift in medium-term momentum.
📈 Moving Averages: The 50 and 200 EMA's on the 4H are still bullishly aligned, providing dynamic support. A break below the 50 EMA (~1.3470) would be the first sign of bearish acceleration.
3. Critical Support & Resistance:
🎯 Immediate Resistance: 1.3520 - 1.3535 (Gann Level, Previous High)
🎯 Key Resistance: 1.3600 - 1.3650 (Psychological, Swing High)
🛡️ Immediate Support: 1.3470 (50 EMA)
🛡️ Strong Support: 1.3420 - 1.3400 (H&S Neckline, Psychological)
🛡️ Major Support: 1.3350 (200 EMA, Wave 4 base)
⚡ Trading Strategies & Setups
A. Intraday Trading (5M - 1H Charts):
Strategy: Look for short opportunities on any retest of the 1.3520 resistance area, especially if confirmed by a bearish candlestick pattern (e.g., Bearish Engulfing, Shooting Star) and RSI rejection from overbought (>70) territory.
Short Entry (Ideal): ~1.3515 | Stop Loss: 1.3545 | Take Profit 1: 1.3480 | Take Profit 2: 1.3440
Scalp Long: Only on a bounce from the 1.3470 (50 EMA) support with a tight stop.
B. Swing Trading (4H - D Charts):
Strategy: The confluence of the H&S pattern, RSI divergence, and Gann resistance provides a high-probability swing short setup.
Swing Short Entry: On a break below the 1.3470 support or a rejection from 1.3520. | Stop Loss: Above 1.3550 | Target 1: 1.3420 (Neckline) | Target 2: 1.3350
Bullish Invalidation: A decisive break and close above 1.3550 would invalidate the immediate bearish setup and open a path to 1.3650.
🌍 Market Context & Risk Factors
Geopolitical & Political Events: Monitor any developments related to UK-EU relations, BoE and Fed policy divergence, and global risk sentiment. Volatility is guaranteed around high-impact news events.
USD Strength: The forecast is partially contingent on a broader USD recovery. Watch the DXY (Dollar Index) for confirmation.
✅ Key Takeaways:
Confluence is Key! Multiple independent theories (Gann, Elliott, Harmonics) are pointing to a resistance zone.
Momentum is Waning. The RSI divergence is a critical red flag for bulls 🚩.
Respect the Levels. Trade the break of 1.3470 (support) or 1.3550 (resistance).
Manage Risk. Always use stop-loss orders. The market can remain irrational longer than you can remain solvent.
For individuals seeking to enhance their trading abilities based on the analyses provided, I recommend exploring the mentoring program offered by Shunya Trade. (Website: shunya dot trade)
I would appreciate your feedback on this analysis, as it will serve as a valuable resource for future endeavors.
Sincerely,
Shunya.Trade
Website: shunya dot trade
⚠️Disclaimer: This post is intended solely for educational purposes and does not constitute investment advice, financial advice, or trading recommendations. The views expressed herein are derived from technical analysis and are shared for informational purposes only. The stock market inherently carries risks, including the potential for capital loss. Therefore, readers are strongly advised to exercise prudent judgment before making any investment decisions. We assume no liability for any actions taken based on this content. For personalized guidance, it is recommended to consult a certified financial advisor.

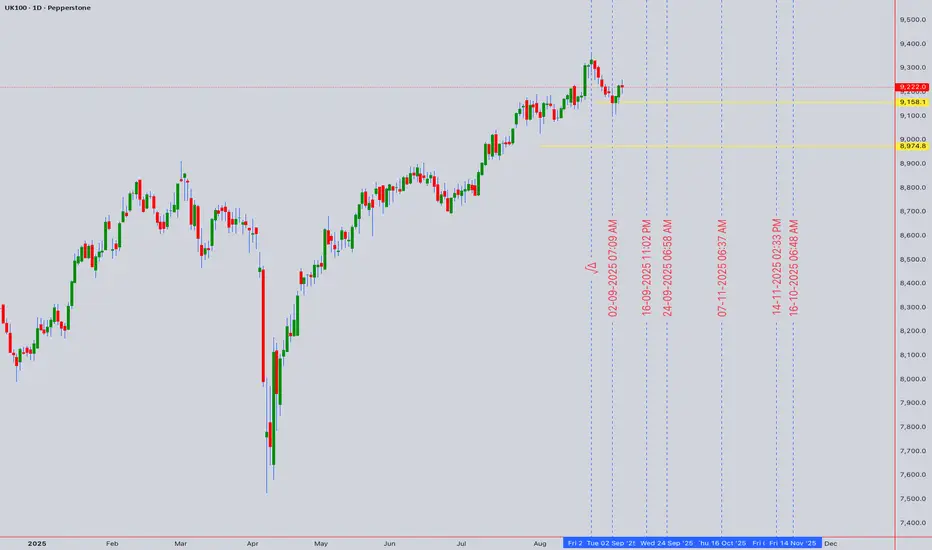
FTSE Challenges Key Resistance - Breakout or False Dawn?UK100 Technical Analysis: 🇬🇧 FTSE Challenges Key Resistance - Breakout or False Dawn? 🌅
Asset: UK100 (FTSE 100 Index CFD)
Analysis Date: September 5, 2025
Current Closing Price: 9,222.0 (as of 11:54 PM UTC+4)
Timeframes Analyzed: 1H, 4H, D, W
Executive Summary & Market Outlook 🧐
The UK100 is testing a critical technical and psychological resistance zone between 9,200 and 9,250. 🚧 This level has acted as a significant barrier in the past. The index is in a near-term uptrend but remains in a broader multi-month consolidation phase. A decisive breakout above 9,250 could signal the start of a new bullish leg, while a rejection here would reinforce the range-bound narrative and trigger a pullback. This analysis provides a clear roadmap for intraday 🎯 and swing traders 📈 navigating this pivotal level.
Multi-Timeframe Technical Analysis 🔍
1. Trend Analysis (Daily & 4-Hour Chart):
Primary Trend: 🟡 Range-Bound (Neutral). Price is trapped within a larger consolidation rectangle between ~8,800 and 9,250.
Short-Term Trend: 🟢 Bullish. The recent rally from the 9,000 support has been strong, bringing price to the upper boundary of the range.
2. Key Chart Patterns & Theories:
Range-Bound Consolidation 📊: The dominant pattern is a large rectangle. The current test of the range high (~9,250) is a make-or-break moment. A breakout would be significant, while a rejection is a classic range-trading signal.
Elliott Wave Theory 🌊: The move off the recent low looks corrective (3 waves), suggesting it may be a B-wave or part of a larger consolidation pattern within the range. This reinforces the importance of the 9,250 resistance.
Ichimoku Cloud (H4/D1) ☁️: Price is trading just above the Cloud on the daily chart, indicating a tentative bullish bias. However, the Cloud is relatively flat, reflecting the lack of a strong trend. A clear break above 9,250 would see price move decisively above the Cloud.
Wyckoff Method: The price action could be interpreted as part of a potential re-accumulation phase near the top of the range. A breakout on increasing volume would confirm this.
3. Critical Support & Resistance Levels:
Resistance (R1): 9,220 - 9,250 (Key Range High & Technical Ceiling) 🚨
Resistance (R2): 9,400 (Projected Target if breakout occurs)
Current Closing Price : ~9,222
Support (S1): 9,100 - 9,150 (Immediate Support & 21-period EMA) ✅
Support (S2): 9,000 - 9,050 (Major Range Support - Must Hold) 🛡️
Support (S3): 8,800 (Ultimate Range Low & 200-day EMA)
4. Indicator Consensus:
RSI (14-period on 4H/D): Reading is near 62, in bullish territory but not yet overbought. This suggests there is room for further upside if buyers can maintain control. A bearish divergence here would be a strong sell signal.
Bollinger Bands (4H) 📏: Price is pressing against the upper band, a sign of strong short-term momentum. A rejection here could see price move back towards the middle band.
Moving Averages: The 50 and 200-day EMAs are flat, confirming the range-bound nature. The 21-period EMA on the 4H chart is key short-term dynamic support.
Volume & VWAP: A breakout above 9,250 needs to be confirmed with a significant increase in volume to be trusted. Low-volume breakouts are often false.
Trading Strategy & Forecast 🎯
A. Intraday Trading Strategy (5M - 1H Charts):
Bearish Scenario (Range Rejection Play) ⬇️: This is a classic range trade. Fade the resistance with a short position.
Entry: On clear rejection signals at 9,240-9,250 (e.g., bearish pin bar, engulfing pattern).
Stop Loss: Tight, above 9,270.
Target: 9,150 (TP1), 9,100 (TP2).
Bullish Scenario (Breakout Play) ⬆️: If price breaks out with conviction, wait for a pullback for a better entry.
Entry: On a pullback to re-test 9,220-9,230 as new support.
Stop Loss: Below 9,200.
Target: 9,350 (TP1), 9,400 (TP2).
B. Swing Trading Strategy (4H - D Charts):
Strategy: RANGE TRADING OR BREAKOUT WAIT. The most logical play is to trade the range until it breaks.
Ideal Long Zone: Near the 9,000 - 9,050 support area. ✅
Ideal Short Zone: Near the 9,220 - 9,250 resistance area. ✅
Breakout Strategy: A daily close above 9,270 would be a strong buy signal targeting 9,400+. A daily close below 8,950 would be a strong sell signal.
Risk Management & Conclusion ⚠️
Key Risk Events: UK economic data (GDP, CPI, BoE decisions) and GBP volatility are key drivers. 🔥 As a heavily international index, the FTSE is also highly sensitive to global risk sentiment and commodity prices (particularly oil and mining stocks).
Position Sizing: Trading within a range requires tight stop losses. Ensure your position size allows for a stop placed just outside the range boundaries without incurring excessive risk.
Conclusion: The UK100 is at a critical juncture. ⚖️ The battle between the bulls and the bears is concentrated at the 9,220-9,250 resistance wall. Until a decisive break occurs, the range-bound strategy is favored. Swing traders should be patient for entries near support or a confirmed breakout. Intraday traders can fade the range extremes. The next major move will be dictated by the resolution of this level. 📊
Overall Bias: 🟢 Bullish above 9,270 | 🔴 Bearish below 8,950 | 🟡 Neutral/Range-Bound between 9,000-9,250
For individuals seeking to enhance their trading abilities based on the analyses provided, I recommend exploring the mentoring program offered by Shunya Trade. (Website: shunya dot trade)
I would appreciate your feedback on this analysis, as it will serve as a valuable resource for future endeavors.
Sincerely,
Shunya.Trade
Website: shunya dot trade
⚠️Disclaimer: This post is intended solely for educational purposes and does not constitute investment advice, financial advice, or trading recommendations. The views expressed herein are derived from technical analysis and are shared for informational purposes only. The stock market inherently carries risks, including the potential for capital loss. Therefore, readers are strongly advised to exercise prudent judgment before making any investment decisions. We assume no liability for any actions taken based on this content. For personalized guidance, it is recommended to consult a certified financial advisor.
FTSE100 is at critical pointFTSE100 of the 1H is at critical point. We have said before that once the price breaks the trend line is going to be reversl, that has to be adjusted a little a bit. but we have to consider the MAs on the 4H chart.
Good luck to you all,
MarketsTitan

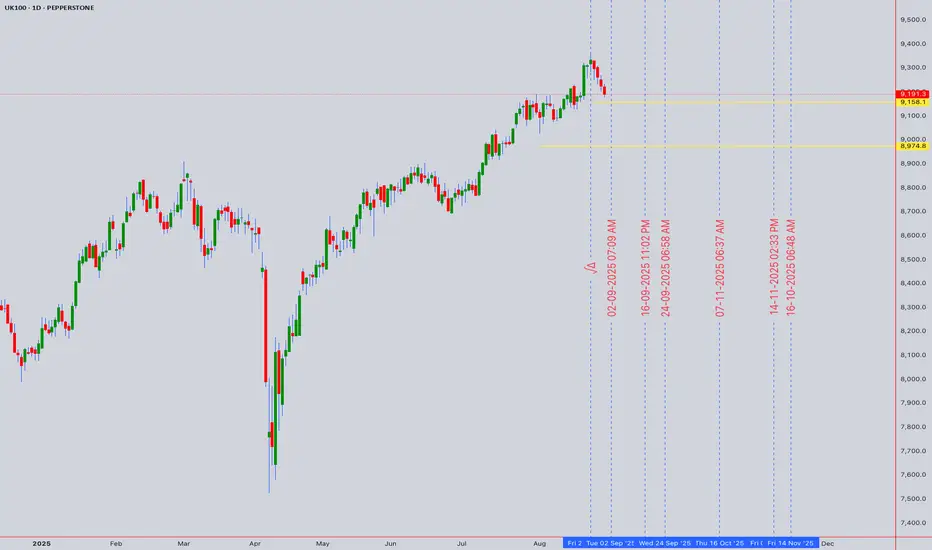
FTSE 100 UK100 Technical Analysis: Weekly Forecast# FTSE 100 UK100 Technical Analysis: Advanced Multi-Timeframe Trading Strategy & Weekly Forecast
Current Price: 9,191.30 (As of August 30, 2025, 11:54 AM UTC+4)
Asset Class: UK100 / FTSE 100 Index
Analysis Date: August 30, 2025
---
Executive Summary
The FTSE 100 Index (UK100) continues to demonstrate resilient performance, trading at 9,191.30 points with solid fundamental support from recent Bank of England policy accommodation. Recent market data shows the GB100 reached 9,199 points on August 29, 2025, maintaining a monthly gain of 0.68% and an impressive 9.82% year-over-year advance. Our comprehensive technical analysis reveals the index is positioned for potential continuation toward the 9,525.47 analytical target by year-end 2025, supported by dovish monetary policy and improving technical confluence across multiple timeframes.
---
Multi-Timeframe Technical Analysis
Elliott Wave Analysis
The FTSE 100 exhibits a complex corrective structure within a larger degree impulse sequence:
Primary Count: Completing Wave 5 of (3) within an extended bull market cycle
Alternative Count: ABC corrective completion transitioning to new impulse
Immediate Target: 9,300-9,400 (Wave 5 extension)
Extended Target: 9,525-9,600 (Major wave completion zone)
Invalidation Level: Break below 8,950 (Wave 4 low)
Long-term Projection: 10,200-10,500 potential by mid-2026
Wyckoff Market Structure Analysis
Current price action demonstrates characteristics of a Wyckoff Re-accumulation Phase:
Phase: Late Stage Re-accumulation with signs of Markup beginning
Volume Analysis: Institutional absorption evident on declines below 9,100
Price Action: Narrowing consolidation ranges with higher low formation
Composite Operator Activity: Smart money accumulation at support levels
Market Structure: Building energy for next major upward movement
W.D. Gann Comprehensive Analysis
Square of 9 Analysis:
- Current price 9,191.30 positioned near significant Gann resistance level
- Next major Gann square: 9,409 (180-degree rotation from recent low)
- Time and price convergence: September 15-22, 2025 (Autumn Equinox influence)
- Critical Gann levels: 9,216, 9,409, 9,604 (geometric progressions)
Angle Theory Application:
- 1x1 Rising Angle Support: 9,050-9,100 (primary trend support)
- 2x1 Accelerated Angle: 9,300-9,400 (next resistance cluster)
- 1x2 Support Angle: 8,850-8,950 (major correction boundary)
- 1x4 Long-term Support: 8,500-8,600 (secular bull market support)
Time Cycle Analysis:
- 84-day cycle completion anticipated: Mid-September 2025
- Seasonal Gann Pattern: September-October historically bullish for UK markets
- Major time window: October 8-18, 2025 (next significant turning point)
- Annual cycle: Year-end strength typically supports FTSE performance
Price Forecasting & Time Harmonics:
- Immediate resistance: 9,240-9,280
- Primary target: 9,350-9,400
- Extended projection: 9,525-9,600
- Time harmony suggests acceleration after September 18, 2025
---
Japanese Candlestick & Harmonic Pattern Analysis
Recent Candlestick Formations (Daily Chart)
Bullish Engulfing: August 26-27 showing strong buying pressure
Piercing Pattern: August 28-29 confirming support at 9,150 level
Long Lower Shadows: Multiple occurrences indicating accumulation
Volume Validation: Increasing volume on up days, declining on down days
Harmonic Pattern Recognition
Bullish Gartley Completion: 9,050-9,150 zone (recent successful test)
ABCD Pattern Active: Targeting 9,375-9,425 completion zone
Potential Butterfly Formation: Monitoring for completion at 9,500-9,600
Fibonacci Confluence: 1.618 extension projects to 9,387 from August low
Advanced Harmonic Analysis
Three Drives Pattern: Currently developing third drive toward 9,400+
Cypher Pattern Potential: Reversal consideration at 9,550-9,650
Deep Crab Formation: Long-term pattern suggesting 9,800+ targets
AB=CD Equality: Multiple time and price relationships converging
---
Ichimoku Kinko Hyo Analysis
Current Cloud Structure (Daily Chart)
Price Position: Above Kumo cloud indicating bullish trend continuation
Tenkan-sen (9-period): 9,167 (short-term dynamic support)
Kijun-sen (26-period): 9,124 (medium-term trend baseline)
Senkou Span A: 9,146 (leading span A - immediate support)
Senkou Span B: 9,087 (leading span B - key cloud support)
Chikou Span: Positioned above historical price action (bullish confirmation)
Future Kumo Analysis (26 periods ahead):
- Ascending cloud formation supporting continued bullish bias
- Future support zone: 9,200-9,300 (forward-looking cloud support)
- Kumo thickness increasing, suggesting strengthening trend
Ichimoku Trading Signals
TK Cross: Tenkan above Kijun (active bullish signal)
Price vs Cloud: Sustained positioning above cloud
Chikou Span Clear: No interference with historical price levels
Cloud Breakout: Recent bullish breakthrough confirmed
---
Technical Indicators Comprehensive Analysis
RSI (Relative Strength Index) Multi-Timeframe
Daily RSI: 62.4 (healthy bullish momentum, room for expansion)
Weekly RSI: 58.7 (positive trend with upside potential)
4H RSI: 65.8 (approaching but not yet overbought)
RSI Divergence Analysis: No bearish divergence detected, momentum intact
Bollinger Bands Analysis
Current Position: Price approaching upper band (9,220 level)
Band Width: Contracting after recent expansion (consolidation phase)
%B Indicator: 0.72 (strong positioning without extreme reading)
Squeeze Indicator: Preparing for next volatility expansion
VWAP Analysis (Volume Weighted Average Price)
Daily VWAP: 9,154 (key dynamic support level)
Weekly VWAP: 9,089 (intermediate support zone)
Monthly VWAP: 9,067 (major trend support)
Volume Profile: Significant acceptance above 9,100 level
Moving Average Structure Analysis
10 EMA: 9,158 (immediate dynamic support)
20 EMA: 9,136 (short-term trend support)
50 SMA: 9,087 (intermediate trend support)
100 SMA: 9,023 (key trend support)
200 SMA: 8,934 (major secular support)
Moving Average Alignment:
- Perfect bullish alignment across all timeframes
- Golden Cross pattern firmly established (50/200 SMA)
- Price trading above all major moving averages
---
Support & Resistance Analysis
Primary Resistance Levels
1. R1: 9,240-9,280 (immediate Gann resistance cluster)
2. R2: 9,350-9,400 (2x1 Gann angle and harmonic completion)
3. R3: 9,525-9,600 (Major Elliott Wave target and analytical forecast)
4. R4: 9,750-9,800 (Long-term harmonic projection)
5. R5: 10,000-10,200 (Psychological and secular targets)
Primary Support Levels
1. S1: 9,124 (Kijun-sen and recent swing support)
2. S2: 9,050-9,100 (1x1 Gann angle and harmonic support)
3. S3: 8,950-9,000 (Elliott Wave invalidation boundary)
4. S4: 8,850-8,900 (1x2 Gann angle and 100 SMA confluence)
5. S5: 8,750-8,800 (Major correction target zone)
Volume-Based Price Levels
High Volume Node: 9,050-9,150 (institutional accumulation zone)
Low Volume Gap: 9,200-9,300 (potential rapid movement area)
Volume Resistance: 9,400+ (historical distribution levels)
POC (Point of Control): 9,125 (maximum volume acceptance)
---
Multi-Timeframe Trading Strategy Framework
Scalping Strategy (5M & 15M Charts)
5-Minute Timeframe Methodology:
Entry Criteria: Pullbacks to 20 EMA with RSI <30 oversold
Profit Targets: 25-40 points per scalping trade
Stop Loss Parameters: 15-20 points maximum risk exposure
Volume Confirmation: Above-average volume required on breakouts
Optimal Time Windows: 8:00-10:00 AM and 2:00-4:00 PM GMT
15-Minute Scalping Framework:
Range Identification: Current consolidation 9,150-9,220
Breakout Methodology: Volume spike confirmation above 9,220
Mean Reversion: Fade extreme moves beyond 2 standard deviations
Risk Management: Maximum 3 positions simultaneously, 1:1.5 minimum R:R
Intraday Trading Strategies (30M, 1H, 4H)
30-Minute Chart Approach:
Trend Following: Long positions above EMA confluence (9,140)
Pattern Recognition: Flag and pennant completions near resistance
Target Methodology: Initial 9,280, extended 9,350-9,400
Risk Parameters: 50-70 point stops, 2:1 reward-to-risk minimum
1-Hour Chart Strategy:
Momentum Confirmation: MACD histogram expansion on bullish crossovers
Support Trading: Long entries from 9,100-9,150 support zone
Breakout Management: Monitor 9,240 level for continuation signals
Session Focus: London session volatility (8:00 AM - 4:30 PM GMT)
4-Hour Swing Framework:
Cloud Strategy: Long positions on successful Ichimoku cloud bounces
Elliott Wave Guidance: Ride Wave 5 extensions toward major targets
Fibonacci Utilization: 38.2% and 61.8% retracements for optimal entries
Position Duration: 2-7 days typical holding period for swing trades
Swing Trading Strategy (Daily, Weekly, Monthly)
Daily Chart Methodology:
Breakout Strategy: Long on sustained breaks above 9,240 with volume
Accumulation Zones: Build positions on tests of 9,050-9,150
Target Sequence: 9,350 → 9,525 → 9,750 progressive profit-taking
Position Management: Scale entries across multiple time frame confirmations
Weekly Chart Perspective:
Primary Trend: Strongly bullish above 8,950 weekly support
Swing Objectives: 9,525-9,600 zone for major profit realization
Risk Assessment: Weekly closes below 8,850 signal trend reversal
Monthly Chart Analysis:
Secular Trend: Multi-year bull market structure intact
Long-term Targets: 10,500-11,000 by 2026-2027 projections
Major Support: 8,200-8,500 (unlikely to test in current cycle)
---
Daily Trading Plan: September 2-6, 2025
Monday, September 2, 2025
Market Status: Full UK trading session
Technical Setup:
Resistance Levels: 9,240, 9,280, 9,320
Support Levels: 9,150, 9,100, 9,050
Expected Range: 9,120-9,260
Trading Strategy:
Morning Session (8:00-12:00 GMT): Monitor for overnight gap analysis
Afternoon Session (12:00-16:30 GMT): Focus on US market correlation
Primary Setup: Long 9,140-9,170 targeting 9,240-9,280
Alternative Setup: Fade any move above 9,280 without volume confirmation
Risk Considerations:
- Bank of England policy speculation impact
- End-of-month institutional flows
- Brexit-related news sensitivity
Tuesday, September 3, 2025
Market Outlook: Post-Labor Day momentum with full global participation
Key Events & Strategy:
UK Economic Data: Manufacturing PMI and construction data releases
Technical Focus: 9,240 breakout attempt with volume validation
Entry Strategy: Long 9,180-9,220 on consolidation completion
Target Areas: 9,300-9,350 on successful breakout scenarios
Risk Management:
- Reduced position sizes due to data event risk
- Monitor GBP/USD correlation for confirmation signals
- Prepare for potential volatility around PMI releases
Wednesday, September 4, 2025
Market Outlook: Mid-week consolidation with building momentum
Strategic Framework:
Technical Pattern: Monitor for bull flag or pennant completion
Volume Analysis: Require institutional participation for sustained moves
Support Testing: Strength of 9,150-9,180 zone crucial for continuation
Momentum Signals: MACD and RSI alignment for directional bias
Trading Approach:
Range Strategy: Buy support, sell resistance until breakout
Breakout Preparation: Position for 9,240+ level clearance
Risk Assessment: Political developments and central bank communications
Thursday, September 5, 2025
Market Outlook: Pre-weekly close positioning dynamics
Key Considerations:
Technical Levels: 9,300-9,350 resistance cluster testing
Institutional Activity: Pension fund rebalancing flows
Pattern Development: Harmonic pattern completion monitoring
Global Correlation: Monitor S&P 500 and DAX for confirmation
Execution Strategy:
Momentum Continuation: Above 9,280 favors 9,400 target
Profit-Taking Zones: Scale out at 9,320, 9,380, 9,425
Risk Management: Tighten stops as resistance approaches
Friday, September 6, 2025
Market Outlook: Weekly close significance and weekend positioning
Final Session Strategy:
Weekly Close Target: Above 9,200 maintains bullish structure
Profit Preservation: Secure gains from successful breakout trades
Gap Risk Management: Prepare for weekend news flow impact
Position Review: Maintain swing positions with appropriate stops
Critical Levels:
Weekly Bullish: Close above 9,220
Weekly Neutral: 9,150-9,220 range
Weekly Bearish: Close below 9,150
---
Macroeconomic & Policy Analysis
Bank of England Policy Impact
The Bank of England's recent monetary policy decisions significantly influence FTSE 100 performance. The Committee voted to reduce Bank Rate to 4% in August 2025, representing continued accommodation that supports equity valuations and corporate profitability across the index.
Interest Rate Environment
The next Bank Rate decision is due on September 18, 2025, with economists and markets expecting at least one more rate cut in 2025. This dovish policy trajectory provides fundamental support for equity market performance.
Economic Growth Outlook
The UK economic environment presents improving conditions with downside domestic and geopolitical risks around economic activity remaining, although trade policy uncertainty has diminished somewhat. This stabilization supports continued FTSE 100 outperformance.
Inflation Dynamics
The Bank of England predicted that inflation would follow a bumpy path and expects it to rise to around 4% in September, but this increase should be only temporary, and inflation should fall back to 2%.
Key Risk Factors
1. Monetary Policy Uncertainty: Timing and magnitude of future rate cuts
2. Global Trade Relations: Post-Brexit trade relationship developments
3. Currency Impact: GBP strength/weakness affecting multinational earnings
4. Energy Sector Exposure: Oil price volatility impacting major components
5. Political Stability: Government policy consistency and business confidence
---
Sector Analysis & FTSE 100 Component Review
Sector Performance Dynamics
Financial Services: Benefiting from interest rate normalization process
Energy Sector: Oil majors providing dividend yield attraction
Consumer Goods: Defensive characteristics supporting index stability
Technology: Limited exposure compared to global peers, potential upside
Healthcare: Pharmaceutical giants providing stability and growth
Dividend Yield Analysis
The FTSE 100's attractive dividend yield continues to support international investor interest, with share buybacks remaining a significant component of shareholder returns supported by robust cash generation of these companies.
Valuation Assessment
There's little doubt that the UK's blue-chip index is undervalued compared with overseas peers, providing fundamental support for continued outperformance and multiple expansion potential.
---
Multi-Asset Correlation Analysis
Currency Relationships
GBP/USD Impact: Inverse correlation with multinational earnings (0.65 negative)
EUR/GBP Influence: European trade relationship effects (0.45 positive)
USD Strength: Dollar appreciation pressures on international revenues
Global Index Correlations
S&P 500 Relationship: Moderate positive correlation (0.58)
DAX Connection: Strong European correlation (0.74)
Nikkei Influence: Asian market sentiment transmission (0.42)
Commodity Exposure
Oil Price Sensitivity: Energy sector weighting creates positive correlation
Gold Relationship: Limited direct exposure, inverse correlation during risk-off
Base Metals: Industrial exposure through mining components
---
Risk Management Comprehensive Framework
Position Sizing Methodology
Scalping Operations: 0.5-1% account risk per individual trade
Intraday Positions: 1-2% maximum account risk exposure
Swing Positions: 2-3% account risk per established position
Maximum Portfolio Exposure: 7% total UK100-related risk allocation
Stop-Loss Implementation
Scalping Stops: 15-25 points maximum loss per trade
Intraday Stops: 50-75 points based on volatility conditions
Swing Trading Stops: Below key support levels (9,050 for current longs)
Technical Invalidation: Elliott Wave and pattern breakdown levels
Profit-Taking Strategy
Scaling Method: Take 30% at first target, 40% at second target, hold 30%
Trailing Stops: Implement after achieving 2:1 favorable risk-reward
Time-Based Exits: Close before major BoE announcements and data releases
Pattern-Based Exits: Honor harmonic and Elliott Wave completion zones
Risk Monitoring Systems
Daily Risk Assessment: Maximum drawdown tolerance 3%
Weekly Risk Review: Position correlation and concentration analysis
Monthly Performance Evaluation: Strategy effectiveness and adjustment needs
Stress Testing: Scenario analysis for major market disruptions
---
Weekly Outlook Probability Matrix
Bullish Scenario (Probability: 70%)
Primary Catalysts:
- Bank of England maintains accommodative policy stance
- UK economic data shows continued stability/improvement
- Technical breakout above 9,240 with volume confirmation
- Global risk-on sentiment supporting equity markets
Price Objectives:
- Initial Target: 9,300-9,350
- Extended Target: 9,400-9,525
- Optimistic Scenario: 9,600+
Supporting Factors:
- Dividend yield attraction for international investors
- Undervaluation relative to global peers
- Technical momentum building across timeframes
Neutral/Consolidation Scenario (Probability: 20%)
Characteristics:
- Range-bound trading between 9,100-9,280
- Mixed economic signals and policy uncertainty
- Technical indecision at key resistance levels
- Reduced trading volumes and institutional activity
Trading Parameters:
- Upper Range: 9,250-9,280
- Lower Range: 9,100-9,150
- Strategy Focus: Range trading and volatility contraction plays
Bearish Scenario (Probability: 10%)
Risk Catalysts:
- Unexpected hawkish shift from Bank of England
- Significant deterioration in UK economic indicators
- Major geopolitical shock or financial system stress
- Technical breakdown below critical support at 9,050
Downside Objectives:
- Initial Target: 8,950-9,000
- Extended Target: 8,800-8,850
- Stress Scenario: 8,600-8,750
---
Advanced Trading Techniques & Market Microstructure
Order Flow Analysis
Institutional Activity: Large block trades above 9,150 indicate accumulation
Retail Sentiment: Contrarian indicator showing excessive bearishness
Options Market: Put/call ratio neutral, no extreme positioning detected
ETF Flows: Consistent inflows into UK equity ETFs supporting demand
High-Frequency Trading Considerations
Algorithmic Support: 9,150-9,180 zone shows HFT buying interest
Liquidity Zones: Deep liquidity above 9,200 and below 9,100
Speed of Execution: Critical during London market open and close
Spread Dynamics: Tightening spreads indicating improving liquidity
Options Market Intelligence
Gamma Exposure: Positive gamma above 9,180, negative below 9,100
Key Strike Concentrations: 9,200 calls and 9,100 puts high open interest
Implied Volatility: Currently underpriced relative to realized volatility
Options Skew: Slight put premium indicating modest hedging activity
---
Seasonal & Cyclical Analysis
Historical Seasonal Patterns
September Performance: Historically mixed, average +0.8% monthly return
Q4 Seasonality: Strong fourth quarter performance, average +4.2%
Year-End Effects: Portfolio rebalancing typically supports FTSE 100
Dividend Calendar: Major distributions in Q1 and Q3 affecting flows
Economic Cycle Positioning
Current Phase: Late cycle expansion with monetary accommodation
Sector Rotation: Value sectors outperforming growth in current environment
Interest Rate Cycle: Declining rate environment supporting equity multiples
Credit Cycle: Stable credit conditions supporting corporate expansion
---
Technology & Innovation Impact
Fintech Integration
Digital Banking: Major FTSE components adapting to digital transformation
Payment Systems: Evolution affecting traditional banking models
Regulatory Technology: Compliance costs and operational efficiency factors
Cryptocurrency Influence: Limited direct exposure, regulatory developments
ESG Considerations
Environmental Standards: Increasing focus on sustainability metrics
Social Governance: Stakeholder capitalism trends affecting valuations
Regulatory Compliance: ESG reporting requirements and investment flows
Transition Risks: Energy transition affecting traditional sector weights
---
Conclusion & Strategic Outlook
The FTSE 100 Index (UK100) presents a compelling technical and fundamental investment case with multiple confluences supporting continued upside momentum toward the analytical forecast target of £9,525.47 by the end of 2025. The combination of accommodative Bank of England policy, attractive dividend yields, and constructive technical patterns creates a favorable risk-reward environment.
Critical Success Factors:
1. Monetary Policy Support: Continued BoE accommodation through 2025
2. Technical Breakout Confirmation: Sustained move above 9,240 with volume
3. Economic Stability: UK data showing resilience and gradual improvement
4. Global Risk Environment: Maintained risk-on sentiment supporting equities
Key Monitoring Priorities:
1. September 18 BoE Decision: Next policy rate announcement impact
2. Technical Level Behavior: Price action at 9,240-9,280 resistance cluster
3. Volume Patterns: Institutional participation in breakout attempts
4. Global Correlation Changes: Relationship dynamics with major indices
Strategic Recommendation:
Maintain constructive bias with tactical flexibility, emphasizing disciplined risk management while positioning for probable continuation of the multi-year bull market in UK equities. The September 15-22 Gann time window represents a critical juncture for intermediate-term directional confirmation.
The confluence of technical, fundamental, and policy factors suggests high probability for achieving the 9,400-9,525 target zone within the forecast timeframe, while downside risk appears well-contained above the 9,050 support complex.
---
*This comprehensive analysis is provided for educational and informational purposes only. It does not constitute investment advice, and readers should conduct their own research and consult with qualified financial professionals before making investment decisions. Always implement appropriate risk management strategies and position sizing methodologies.*
---
For individuals seeking to enhance their trading abilities based on the analyses provided, I recommend exploring the mentoring program offered by Shunya Trade. (Website: shunya dot trade)
I would appreciate your feedback on this analysis, as it will serve as a valuable resource for future endeavors.
Sincerely,
Shunya.Trade
Website: shunya dot trade
Disclaimer: This post is intended solely for educational purposes and does not constitute investment advice, financial advice, or trading recommendations. The views expressed herein are derived from technical analysis and are shared for informational purposes only. The stock market inherently carries risks, including the potential for capital loss. Therefore, readers are strongly advised to exercise prudent judgment before making any investment decisions. We assume no liability for any actions taken based on this content. For personalized guidance, it is recommended to consult a certified financial advisor.
$GBIRYY - U.K Inflation Hits 18-Month High (July/2025)ECONOMICS:GBIRYY
July/2025
source: Office for National Statistics
- The UK’s annual inflation rate rose to 3.8% in July 2025 from 3.6% in June,
the highest since January 2024 and slightly above forecasts of 3.7%.
The uptick was led by higher transport costs linked to school summer holidays, with additional pressure from motor fuels, restaurants and hotels, and food and non-alcoholic beverages.
On a monthly basis, CPI rose 0.1%,
defying forecasts of a 0.1% decline but slowing from June’s 0.3% gain.
Core inflation inched up to 3.8% from 3.7%.

$GBIRYY - U.K Inflation Rises to a 2024 High (June/2025)ECONOMICS:GBIRYY
June/2025
source: Office for National Statistics
- The annual inflation rate in the UK rose to 3.6% in June, the highest since January 2024, up from 3.4% in May and above expectations that it would remain unchanged.
The main upward pressure came from transport prices, mostly motor fuel costs, airfares, rail fares and maintenance and repair of personal transport equipment.
On the other hand, services inflation remained steady at 4.7%.
Meanwhile, core inflation also accelerated, with the annual rate reaching 3.7%.

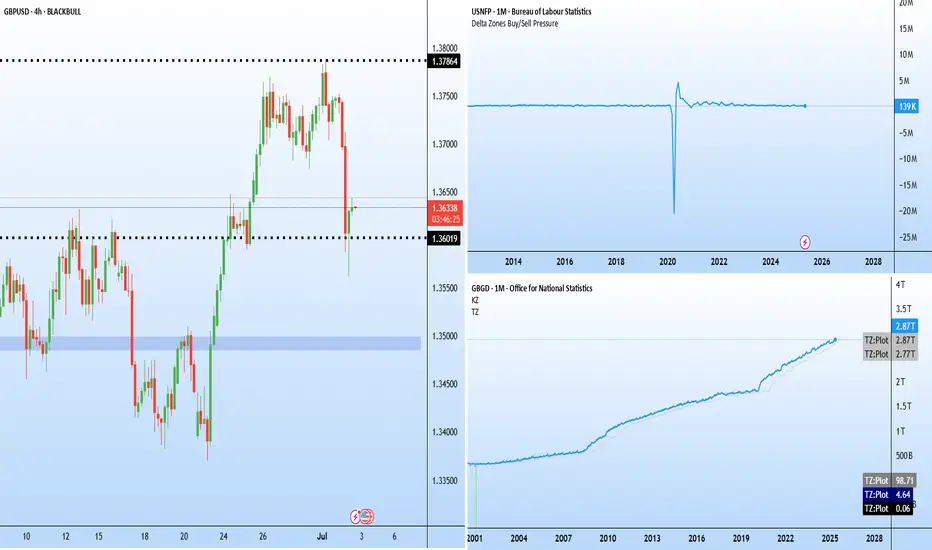
Jobs vs politics: GBPUSD caught in crossfire Two major stories are developing on either side of the Atlantic.
ADP reported a 33 k fall in June private payrolls (consensus +95 k). It is the third straight miss and sets the tone for Thursday’s early Non-Farm Payroll (NFP) release, brought forward because of the 4 July holiday.
In the UK, speculation is growing around the position of Chancellor Rachel Reeves after an emotional appearance in Parliament. Prime Minister Keir Starmer declined to confirm whether she would remain in the role, sparking questions over the government’s fiscal direction.
The political uncertainty helped accelerate the sell-off in GBPUSD, which has fallen sharply from recent highs near 1.38. The latest candles show a long lower wick around 1.3600, indicating that buyers are attempting to defend the area. If this support fails to hold, the next downside target lies near 1.3485–1.3500, which acted as a base for the late-June rally.
$GBIRYY - U.K Inflation Rate Accelerates (April/2025)ECONOMICS:GBIRYY
April/2025
source: Office for National Statistics
- The annual inflation rate in the UK jumped to 3.5% in April, the highest since January 2024, from 2.6% in March and above forecasts of 3.3%.
The main upward pressure came from higher electricity and gas prices after the Ofgem price cap increase, while new Vehicle Excise Duty on electric cars lifted transport costs, and food inflation also picked up.
Meanwhile, core inflation accelerated to 3.8%, the highest in a year.

Can FTSE100 keep the momentum all the way to the all-time high?The FTSE:UKX bulls continue to show resilience and push the index higher. But the big question is, can we see a move all the way to the current all-time high?
Let's dig in...
MARKETSCOM:UK100
Let us know what you think in the comments below.
Thank you.
77.3% of retail investor accounts lose money when trading CFDs with this provider. You should consider whether you understand how CFDs work and whether you can afford to take the high risk of losing your money. Past performance is not necessarily indicative of future results. The value of investments may fall as well as rise and the investor may not get back the amount initially invested. This content is not intended for nor applicable to residents of the UK. Cryptocurrency CFDs and spread bets are restricted in the UK for all retail clients.

GBPUSD - Bearish Pressure Soon!Hello TradingView Family / Fellow Traders. This is Richard, also known as theSignalyst.
📈As per our last GBPUSD analysis, it rejected the $1.27 - $1.28 support zone and has been trading higher.
This week, GBPUSD is approaching the upper bound of its rising wedge pattern marked in red.
Moreover, the blue zone around $1.34 is a strong resistance and previous weekly high.
🏹 Thus, the highlighted red circle is a strong area to look for sell setups as it is the intersection of the upper red trendline and resistance.
📚 As per my trading style:
As #GBPUSD retests the red circle zone, I will be looking for bearish reversal setups (like a double top pattern, trendline break , and so on...)
📚 Always follow your trading plan regarding entry, risk management, and trade management.
Good luck!
All Strategies Are Good; If Managed Properly!
~Rich
Disclosure: I am part of Trade Nation's Influencer program and receive a monthly fee for using their TradingView charts in my analysis.

$GBINTR -BoE Cuts Rates as Expected (May/2025)ECONOMICS:GBINTR
May/2025
source: Bank of England
- The Bank of England cut the Bank Rate by 25 basis points to 4.25%,
matching expectations but revealing a split 5–4 vote.
Two policymakers favored a deeper 50 bps cut, while two others wanted to hold at 4.5%.
It was the fourth cut since August 2024, amid concerns over slowing growth linked to Trump-era tariffs.

USA-UK: Trade Agreement and Impact
Hello, I am Trader Andrea Russo and today I want to talk to you about the meeting that will take place today, May 9, 2025, between the USA and the UK. The announcement of a new trade agreement between the United States and the United Kingdom by Donald Trump has immediately attracted the attention of global investors. Its economic scope could have significant repercussions on the main currencies, in particular on the GBP/USD pair.
The components of the agreement and the reactions of the markets
According to initial information, the agreement aims to strengthen trade relations between Washington and London, simplifying regulations on goods and services, reducing duties and incentivizing bilateral investments.
Immediate impact on the pound (GBP)
The GBP/USD pair has shown an initial reaction of volatility, with investors evaluating the details of the new agreement. If the agreement leads to greater economic stability and growth in the United Kingdom, the pound could benefit from a bullish trend in the short term. However, some analysts warn that the pound could suffer from more in-depth negotiations in the future, especially if the deal puts renewed pressure on UK financial markets.
The US dollar and the Fed’s monetary policy
The deal comes amid economic uncertainty in the US, with the Federal Reserve monitoring inflation and growth. If bilateral trade between the US and UK were to expand significantly, it could have a positive effect on the dollar’s strength, even against other currencies.
Economic sectors involved and impact on FX
The deal could affect several sectors:
Energy and raw materials: If trade in natural gas or oil between the two countries increases, it could have an impact on commodity futures and therefore on currencies linked to these markets, such as the CAD and AUD.
Technology and financial services: Expanded cooperation between technology and financial firms could attract investment on Wall Street and support the dollar.
Manufacturing and Exports: If the UK manages to secure favorable export terms, the pound could see increased demand in Forex.
Outlook
In the short term, the deal could lead to increased volatility in GBP/USD as investors await further details. In the long term, much will depend on the economic policies that follow the deal and the effects on the trade balances of the two countries.
Forex market analysts will continue to monitor investor reaction and future statements from the governments involved.

$GBIRYY - U.K CPI (March/2025)ECONOMICS:GBIRYY 2.6%
March/2025
source: Office for National Statistics
- The annual inflation rate in the UK slowed to 2.6% in March 2025 from 2.8% in February and below market and the BoE's forecasts of 2.7%.
The largest downward contributions came from recreation and culture (2.4% vs 3.4%), mainly games, toys and hobbies (-4.2%) and data processing equipment (-5.1%). Transport also contributed to the slowdown (1.2% vs 1.8%), largely due to a 5.3% fall in motor fuel prices.
In addition, prices rose less for restaurants and hotels (3%, the lowest since July 2021 vs 3.4%), mostly accommodation services (-0.6%); housing and utilities (1.8% vs 1.9%); and food and non-alcoholic beverages (3% vs 3.3%).
In contrast, the most significant upward contribution came from clothing and footwear (1.1% vs -0.6%), with prices usually rising in March as spring fashions continue to enter the shops.
Compared to the previous month, the CPI edged up 0.3%, slightly below both the previous month’s increase and expectations of 0.4%.
Annual core inflation slowed to 3.4% from 3.5%.

XAU/USD Outlook: Gold's Bullish Momentum Strengthens 📌 XAU/USD Analysis: Gold on a Strong Bullish Momentum Amid Economic Optimism 📈💰
✨ Overview:
Gold (XAU/USD) is currently demonstrating significant bullish momentum, driven by improved global economic sentiment. The recent 90-day tariff suspension among major global economies and hints from the recent FOMC meeting about potential rate cuts later this year are fueling investor optimism.
📊 Technical Analysis:
🔹 Key Resistance Levels:
3,146
3,162
3,168
🔸 Key Support Levels:
3,096
3,078
3,066
3,052
📈 Moving Averages Analysis:
MA 13 (Short-term): Clearly supports bullish momentum, offering buy signals as price sustains above this MA.
MA 34 (Medium-term): Supporting bullish sentiment with prices comfortably above.
MA 200 (Long-term): Reinforces the robust long-term bullish outlook with price consistently trading above this level.
🚀 Trading Strategy & Recommendations:
BUY Strategy (Preferred Scenario):
Entry Zone: 3,094 – 3,096
Stop Loss: 3,090
Take Profit Levels: 3,100 | 3,104 | 3,108 | 3,112 | 3,116 | 3,120
SELL Strategy (Cautious Approach):
Entry Zone: 3,164 – 3,166
Stop Loss: 3,170
Take Profit Levels: 3,160 | 3,156 | 3,152 | 3,148 | 3,144 | 3,140
🌍 Fundamental Context:
Positive Market Sentiment: The global economic outlook has turned favorable due to tariff suspensions and strong performance in equity markets.
Interest Rate Outlook: Recent signals from the FOMC regarding possible interest rate cuts are providing further support for gold’s upward trajectory.
⚠️ Risk Management:
Emphasize caution when engaging in short positions, given the prevailing bullish conditions.
Always implement strict stop-loss measures and maintain risk-to-reward ratios of at least 1:2.
Avoid over-leverage and ensure trades are sized appropriately.
💡 Conclusion & Final Thoughts:
Gold remains strongly bullish, backed by both technical indicators and a positive fundamental backdrop. Traders are encouraged to focus primarily on buy opportunities near significant support levels and remain alert to potential trend reversals at key resistance zones.
🗨️ Engage with Us:
What are your current strategies for gold? Share your insights and views in the comments section below! 💬👇
