Is Brent Crude Setting Up for a Deeper Pullback?🔥 BRUTAL BRENT (UKOIL) SELL BLUEPRINT — Day & Swing Trade Guide! 🔥
Asset: BRENT “UKOIL” — Energies Market Trade Opportunity Guide (Day / Swing Trade)
Bias: Bearish Plan 📉
📍 Trade Setup Overview
The market is showing a clear downside narrative as liquidity continues shifting away from buyer strength. Volatility pockets + premium zones are forming the ideal backdrop for a controlled bearish play.
🎯 Entry
ANY PRICE LEVEL ENTRY
This setup focuses on structure, not perfection. Price exploration zones offer multiple opportunities to position short as long as the bearish narrative remains intact.
🛡️ Stop Loss
This is the Thief SL @ 62.500
Dear Ladies & Gentleman (Thief OG’s), adjust your SL based on your own system, risk comfort, and volatility tolerance.
Note: I am not recommending that you set only my SL — your capital, your control, your rules. Manage risk like a professional.
💰 Target
We have strong support, oversold confluence, and visible trap behaviour forming below, so the smart exit is clean and disciplined.
Target @ 59.500
Note: Dear Ladies & Gentleman (Thief OG’s), I am not recommending that you use only my TP. Make money, take money — at your own execution style & risk preference.
🔗 Related Pairs to Watch (Correlation Guide)
1️⃣ WTI Crude Oil — USOIL / CL
Moves closely with Brent (UKOIL).
If WTI weakens, Brent often mirrors the same bearish energy.
Watch for supply-zone rejections & macro oil inventory pressure.
2️⃣ Natural Gas — NGAS / XNGUSD
Energy sector sentiment often overlaps.
When overall energy demand weakens, oil tends to follow with downside momentum.
Good for gauging sentiment shifts.
3️⃣ CAD Pairs — USDCAD, CADJPY
Canada is an oil-exporting economy.
If oil falls, CAD weakens, making USDCAD push upward.
A great indirect correlation filter for confidence.
4️⃣ DXY — US Dollar Index TVC:DXY
A rising dollar = pressure on commodities.
Strong USD typically accelerates bearish moves on Brent.
5️⃣ S&P500 Energy Sector — AMEX:XLE
If energy equities sell off, it often preludes oil weakness.
Good higher-timeframe sentiment indicator.
🧩 Why These Correlations Matter
They help filter noise and add multi-asset confirmation.
When multiple correlated markets align, your trade idea gains more precision, timing, and conviction.
Smart traders don’t look at a single chart — they watch the entire ecosystem.
Ukoilanalysis

UKOIL H1 | Potential bearish reversalBased on the H1 chart analysis, we can see that the price has rejected off our sell entry level at 70.87, which is a swing high resistance.
Our stop loss is set at 70.87, which is a pullback resistance.
Our take profit is set at 68.71, an overlap support slightly below the 50% Fibonacci retracement.
High Risk Investment Warning
Stratos Markets Limited fxcm.com Stratos Europe Ltd fxcm.com
CFDs are complex instruments and come with a high risk of losing money rapidly due to leverage. 69% of retail investor accounts lose money when trading CFDs with this provider. You should consider whether you understand how CFDs work and whether you can afford to take the high risk of losing your money.
Stratos Global LLC fxcm.com Losses can exceed deposits.
Please be advised that the information presented on TradingView is provided to FXCM (‘Company’, ‘we’) by a third-party provider (‘TFA Global Pte Ltd’). Please be reminded that you are solely responsible for the trading decisions on your account. Any information and/or content is intended entirely for research, educational and informational purposes only and does not constitute investment or consultation advice or investment strategy. The information is not tailored to the investment needs of any specific person and therefore does not involve a consideration of any of the investment objectives, financial situation or needs of any viewer that may receive it. Past performance is not a reliable indicator of future results. Actual results may differ materially from those anticipated in forward-looking or past performance statements. We assume no liability as to the accuracy or completeness of any of the information and/or content provided herein and the Company cannot be held responsible for any omission, mistake nor for any loss or damage including without limitation to any loss of profit which may arise from reliance on any information supplied by TFA Global Pte Ltd.
Stratos Trading Pty. Limited fxcm.com
Trading FX/CFDs carries significant risks. FXCM AU (AFSL 309763), please read the Financial Services Guide, Product Disclosure Statement, Target Market Determination and Terms of Business at fxcm.com

UKOIL H1 | Bullish Momentum BuildingBased on the H1 chart analysis, we could see the price fall to our buy entry level at 68.29, which is a pullback support that aligns with the 50% Fibonacci retracement.
Our stop loss is set at 67.28, which is a pullback support.
Our take profit is set at 69.90, which is a swing high resistance.
High Risk Investment Warning
Stratos Markets Limited fxcm.com Stratos Europe Ltd fxcm.com
CFDs are complex instruments and come with a high risk of losing money rapidly due to leverage. 69% of retail investor accounts lose money when trading CFDs with this provider. You should consider whether you understand how CFDs work and whether you can afford to take the high risk of losing your money.
Stratos Global LLC fxcm.com Losses can exceed deposits.
Please be advised that the information presented on TradingView is provided to FXCM (‘Company’, ‘we’) by a third-party provider (‘TFA Global Pte Ltd’). Please be reminded that you are solely responsible for the trading decisions on your account. Any information and/or content is intended entirely for research, educational and informational purposes only and does not constitute investment or consultation advice or investment strategy. The information is not tailored to the investment needs of any specific person and therefore does not involve a consideration of any of the investment objectives, financial situation or needs of any viewer that may receive it. Past performance is not a reliable indicator of future results. Actual results may differ materially from those anticipated in forward-looking or past performance statements. We assume no liability as to the accuracy or completeness of any of the information and/or content provided herein and the Company cannot be held responsible for any omission, mistake nor for any loss or damage including without limitation to any loss of profit which may arise from reliance on any information supplied by TFA Global Pte Ltd.
Stratos Trading Pty. Limited fxcm.com
Trading FX/CFDs carries significant risks. FXCM AU (AFSL 309763), please read the Financial Services Guide, Product Disclosure Statement, Target Market Determination and Terms of Business at fxcm.com

This oil does not show a good outlook...This oil does not show a good outlook???
It may be due to the policies of seizure (you read theft) of oil wells, and after the seizure of oil, we had up to 3 times the price in history, which has become expensive to cover the costs of shameless war by killing children and men and of course women in certain parts of the world.
In the meantime: a number of countries played the role of executioners (they are still killing)
A number of countries played the role of supplying goods for the world after high oil prices (China)
And a number of countries played the role of sellers of expensive oil and small amounts of goods supplied with expensive oil to some people! (Oil well owners)
With the great theft of Venezuelan oil, this behavior will probably be repeated again!
We will have to spend a lot of time on the road to realize this scenario again
We hope for God's justice to eliminate the corrupt and those who participate in corruption, whether on earth or activists and participants in Ep/stein's personal island
Introduce me to your friends so we can build a bigger community together.

BRENT Oil → Bullish Breakout | Capital Flow Confirmed🛢️ BRENT CRUDE OIL (UKOIL) - Energy Market Capital Flow Blueprint ⚡
Swing/Day Trade | Bullish Triangular Breakout Strategy
📊 ASSET OVERVIEW
Asset Ticker: BRENT CRUDE / UKOIL (ICE Futures Europe)
Current Price Zone: $64.12 USD/BBL (As of Jan 26, 2026)
Market Status: 📈 Bullish Formation Testing Resistance
Trading Type: Swing Trade / Day Trade Setup
🎯 TECHNICAL PLAN - BULLISH BREAKDOWN
Primary Bias: BULLISH CONFIRMED ✅
Setup: Triangular Moving Average (TMA) Breakout & Retest Pattern
Structure: Clean impulsive move with shallow corrective pullback
Confirmation: No structural breakdown signals observed
Timeframe: Multiple timeframes (H1, H4, D1 alignment)
💰 ENTRY STRATEGY - "THIEF LAYERING SYSTEM" 🎯
Multi-Level Limit Order Entry (Pyramid Strategy)
The "Thief Method" = Smart accumulation on dips using multiple buy limits
Primary Entry Layers (Build Position Progressively):
🔵 Layer 1: $63.50 (20% Position Size)
🔵 Layer 2: $64.00 (25% Position Size)
🔵 Layer 3: $64.50 (30% Position Size)
🔵 Layer 4: $65.00 (25% Position Size)
💡 Pro Tip: Adjust layer density (add $63.75, $64.25, etc.) based on your account size & risk tolerance. This layering approach averages your entry cost and reduces emotional decisions!
Entry Confirmation:
✓ Price bounces from support zone $63.00-$63.50
✓ Volume surge on upside break
✓ TMA bullish crossover
✓ Break above triangular resistance
🎪 PROFIT TARGETS - ESCAPE WITH GAINS! 🚀
Primary Target: $67.50 USD/BBL
Logic: Simple Moving Average (SMA 200) acts as dynamic resistance + Overbought zone + Historical swing high
Risk/Reward: Typically 2.0-2.5:1 depending on entry
Secondary Targets (Pyramid Out):
📍 Target 1: $66.50 (Partial TP - 40% position)
📍 Target 2: $67.00 (Partial TP - 35% position)
📍 Target 3: $67.50 (Full TP - 25% position)
⚠️ IMPORTANT DISCLAIMER:
These are suggested levels. As traders, YOU have full autonomy on your profit targets. Take profits at your own discretion based on market conditions, risk management, and personal strategy. Never risk more than you can afford to lose! 💪
🛡️ STOP LOSS - PROTECTION FIRST!
Stop Loss Level: $63.00 USD/BBL
Placement: Positioned BELOW the key moving average support
Logic: Clean break below this level = trend invalidation
Position Risk: Typically 1-1.5% of account per trade (strict!)
⚠️ CRITICAL DISCLAIMER:
SL placement shown is a GUIDE ONLY. Your risk management is YOUR responsibility. Adjust SL based on your risk tolerance, position size, and account protection strategy. Never ignore your stops! 🚨
📈 RELATED PAIRS TO WATCH - CORRELATION TRADING 🔗
1️⃣ WTI CRUDE OIL / TVC:USOIL
Correlation: POSITIVE (Brent/WTI typically move together)
Current: ~$61.83/barrel
Key Level: Watch $60.00 support zone
Why Watch: WTI breaks often precede BRENT moves
Strategy Tip: Confirm BRENT signals with WTI chart alignment
2️⃣ US DOLLAR INDEX ( TVC:DXY )
Correlation: DYNAMIC (Recently shifted from inverse to positive)
Current Zone: 98.68-99.38 (Testing resistance)
Key Info: 🔄 Since 2021, rising oil prices = stronger USD (Modern relationship!)
Impact: Stronger DXY = Potential headwind for oil
Watch Level: DXY breakdown below 98.23 = Dollar weakness = Oil support
Why It Matters: Oil priced in USD - dollar strength makes oil more expensive globally
3️⃣ FX:EURUSD 💶
Correlation: INVERSE to Oil (Weaker euro = Oil strength)
Current: Monitor ECB policy signals
Trade Hint: EUR/USD breakdown often coincides with oil strength
Key Level: 1.0700 zone critical
4️⃣ FX:GBPUSD
Correlation: INVERSE (Weaker pound = Oil bullish)
Why: UK oil exports increase when GBP softens
Watch: Bank of England rate decisions
Sweet Spot: GBP/USD dips = BRENT strength likely
5️⃣ COPPER / METALS
Correlation: POSITIVE (Economic growth proxy)
Logic: Rising copper = Industrial demand = Oil demand up
Watch: Copper above $4.00 = Oil tailwind; Below = Headwind
Macro Signal: Copper strength validates risk-on environment
6️⃣ GOLD ( OANDA:XAUUSD ) 🏆
Correlation: MIXED (Risk sentiment dependent)
Inverse Risk Indicator: Gold spike = Flight to safety = Oil weakness
Current: Monitor inflation expectations
Edge: Gold spike above $2,100 = Caution for oil shorts
📰 FUNDAMENTAL & ECONOMIC FACTORS - WHAT'S MOVING THE MARKET 🌍
🔴 BEARISH PRESSURES (Short-term headwinds)
1. Global Oil Oversupply⚖️
IEA Projection: 3.8 million bpd surplus forecast for 2026
EIA Outlook: Brent average declining to $56/barrel in 2026 (vs $66+ current)
Driver: OPEC+ restraint + US production records + Guyana scaling + Canadian output
Impact: ⬇️ Price ceiling pressure - Don't expect explosive rallies
2. Abundant Global Inventories 📦
Status: Chinese onshore inventories at RECORD HIGHS
US Data: Crude oil storage volumes climbing above recent lows
Signal: Market well-supplied = Limited upside surprise
3. OPEC+ Production Pause ⏸️
Decision: 8 OPEC+ members pausing output increases Jan-Mar 2026 (Seasonality reasons)
Members: Saudi Arabia, Russia, UAE, Kazakhstan, Kuwait, Iraq, Algeria, Oman
Next Review: February 1, 2026 - KEY DATE TO WATCH
Context: 1.65 million bpd voluntary cuts could be restored gradually
Implication: No fresh production cuts coming - Supply likely to grow
4. Weak Demand Growth 📉
Global Demand Growth: ~1.2% annually (MODEST)
Context: Not enough to absorb supply growth
Risk: Structural oversupply becomes normalized
🟢 BULLISH CATALYSTS (Support factors)
1. Geopolitical Risk Premium ⚠️
Status: ACTIVE - Iran tensions elevated
Trump Position: Armada deployed toward Iran region
Risk Event: Potential military escalation = Supply disruption fear
Oil Response: Every Iran threat = $0.50-$2.00 premium added
Probability: Remains tail-risk but keeps bids elevated
2. Middle East Supply Disruptions 🔥
Kazakhstan Issue: Tengiz oilfield production still hasn't fully resumed
Impact: Estimated production shortfall present
Status: Repairs ongoing - Completion timeline critical
3. Softer US Dollar Support 💵
Current DXY: Trending down from recent highs (Positive for oil)
US-Europe Tensions: Strains weighing on dollar
Ukraine Uncertainty: Unresolved peace talks = Safe-haven weakness
Implication: Weak dollar = Oil cheaper for foreign buyers = Demand lift
4. China Strategic Reserves Demand 🇨🇳
Estimated Rate: Nearly 1.0 million bpd being added to strategic stockpiles
Duration: Continuing through 2026 (potential support)
Impact: Artificial demand creation = Price floor supporter
Note: Rate decreases ~33% in 2027 - Watch this transition
5. Strong Global Oil Demand Momentum 📊
2025 Achievement: Record oil consumption globally
2026 Projection: OPEC expects +1.4 million bpd growth
OPEC Confidence: Cartel maintaining bullish demand outlook despite IEA skepticism
Key Driver: AI infrastructure energy needs, aviation recovery, industrial activity
📅 CRITICAL DATES & ECONOMIC CALENDAR - WHAT TO MONITOR 🗓️
IMMEDIATE (Next 2 Weeks)
Jan 28-29: US CPI Release - MAJOR (Impacts Fed expectations & dollar)
If hot: USD strength = Oil headwind
If cool: USD weakness = Oil support
Feb 1, 2026: OPEC+ Monthly Meeting - WATCH CLOSELY
Production decision review
Any hints at Q2/Q3 production changes?
Cartel messaging critical
February 2026
Feb 7: US Jobs Report (NFP)
Economic health indicator - impacts oil demand expectations
Feb 14: OPEC Monthly Oil Market Report Release
Updated 2026 demand/supply forecasts
Sentiment gauge
Q1 2026 Focus
ECB Policy: European Central Bank meetings - EUR weakness = Oil strength
Fed Stance: Rate hold expectations - Dollar direction crucial
China Data: Manufacturing PMI, economic activity signals
⚡ TRADE EXECUTION CHECKLIST
BEFORE ENTRY ✅
Confirm TMA breakout on H4/D1 chart
Check volume surge on breakout candle
Verify no negative divergences on MACD
Monitor DXY position (avoid entry if DXY spiking higher)
Check geopolitical news - Any Iran/Middle East developments?
Confirm all 4 layers placed at limits
POSITION MANAGEMENT 🎯
Set 50% TP at $67.00 (secure profits early!)
Move SL to breakeven after 1.5R profit
Pyramid out of position gradually
Trail stops on partial profits
NO holding through FOMC/OPEC meetings without hedges
EXIT SIGNALS 🚨
❌ Break below $63.00 = Stop loss hit (exit 100%)
❌ Close below 200-SMA = Trend invalidation
❌ Major DXY rally begins = Risk/reward deteriorates
❌ Negative gap opens (overnight) = Reassess position
🎓 STRATEGY SUMMARY
Best Case Scenario:
Break above $65.50 → Run to $67.50 TP = 2.5:1 Risk/Reward ✅
Worst Case Scenario:
Rejection at $65.00 → Fall to SL $63.00 = 1:1.5 Risk Loss ✅ (Managed)
Breakeven Trade:
Bounce to $64.50 then reversal = Tighten SL, exit flat
⚠️ FINAL RISK DISCLAIMER
Oil trading involves substantial risk:
Volatility: Brent can swing $1-3/barrel intraday on news
Geopolitical Risk: Unexpected escalations can gap prices overnight
Liquidity Events: Thin volume periods can cause slippage
Leverage Risk: If using leverage, losses amplify quickly
Margin Calls: Futures trading can wipe accounts quickly
YOU are responsible for:
✓ Your position sizing (risk max 1-2% per trade)
✓ Your stops (ALWAYS set them)
✓ Your profits targets (take them!)
✓ Your research (verify all signals yourself)
✓ Your broker selection (regulated, reputable)
Trade with discipline. Trade with a plan. Trade what you can afford to lose. 💪
🚀 ENGAGEMENT BOOST TIPS FOR TRADERS
Share this idea if:
✅ You believe in the bullish breakout thesis
✅ You're tracking geopolitical oil risks
✅ You're using this for swing trade confirmation
✅ You found the layering strategy useful
✅ You're monitoring OPEC+ next move (Feb 1)
Questions? Comments? Drop them below - Let's discuss the setup! 💬
Good luck, fellow traders! May your entries be timely and your stops be tight! 🎯

UKOIL H4 | Potential Bullish RiseMomentum: Bullish
The price has bounced off the buy entry, which has been identified as a pullback support.
Buy entry: 61.75
Pullback support
Stop loss: 60.59
Pullback support
Take profit: 63.86
Swing high resistance
High Risk Investment Warning
Stratos Markets Limited (tradu.com ), Stratos Europe Ltd (tradu.com ):
CFDs are complex instruments and come with a high risk of losing money rapidly due to leverage. 70% of retail investor accounts lose money when trading CFDs with this provider. You should consider whether you understand how CFDs work and whether you can afford to take the high risk of losing your money.
Stratos Global LLC (tradu.com ): Losses can exceed deposits.
Please be advised that the information presented on TradingView is provided to Tradu (‘Company’, ‘we’) by a third-party provider (‘TFA Global Pte Ltd’). Please be reminded that you are solely responsible for the trading decisions on your account. Any information and/or content is intended entirely for research, educational and informational purposes only and does not constitute investment or consultation advice or investment strategy. The information is not tailored to the investment needs of any specific person and therefore does not involve a consideration of any of the investment objectives, financial situation or needs of any viewer that may receive it. Past performance is not a reliable indicator of future results. Actual results may differ materially from those anticipated in forward-looking or past performance statements. We assume no liability as to the accuracy or completeness of any of the information and/or content provided herein and the Company cannot be held responsible for any omission, mistake nor for any loss or damage including without limitation to any loss of profit which may arise from reliance on any information supplied by TFA Global Pte Ltd.

Brent Oil Under Pressure – Key Resistance Zone Holding Strong!🔥 UKOIL / BRENT Energies Market Opportunity Blueprint (Day & Swing Plan) ⚡️
📉 Plan Overview:
Thief is spotting a Bearish Blueprint on UKOIL / Brent — price confirming rejection around the Triangular Moving Average (TMA) zone 📊. A clean pullback and retest structure are forming — time for a layered sell approach to capitalize on energy market volatility ⚙️
🎯 Entry Idea:
Thief enters with multiple limit layers (Layering Strategy) — scaling in smartly with precision entries:
🔹 Sell Limits @ 64.500 / 64.000 / 63.500
(You can increase or adjust the layers based on your own conviction & market timing 🕰️)
🛑 Stop-Loss Guidance:
This is Thief’s SL @ 65.000 💣
Dear Ladies & Gentlemen (Thief OG’s), adjust your stop loss based on your risk appetite and confirmation setups. Risk management is the crown 👑 of consistency.
💰 Target Zone:
Watch out for the Police Barricade Zone @ 60.500 — this level aligns with strong support, potential oversold condition, and a trap + correction scenario 🔦
Escape with profits before liquidity hunts you — take money when you see money 💵
📘 Note to Thief OG’s:
I’m not recommending my SL or TP as mandatory levels — it’s your chart, your strategy, your risk, your reward. Trade smart, not emotional 🧠
🧩 Related Market Pairs to Watch:
🔸 WTI Crude (USOIL/USD) – Highly correlated with UKOIL. A bearish structure here often confirms momentum for Brent.
🔸 USD/CAD 💵 – Inverse correlation! A rising USD/CAD often strengthens the bearish sentiment in crude markets.
🔸 XLE (Energy ETF) – Keeps track of energy sector performance; confirmation of trend strength adds confluence to your trade.
📊 Key Market Correlations:
Oil reacts strongly to USD strength, global demand outlook, and OPEC sentiment. Keep an eye on DXY (US Dollar Index) — stronger dollar usually pressures Brent prices lower 💹
🚀 Thief Quote of the Day:
"Patience pays more than panic — layer in silence, exit in profit." 🕶️
#UKOIL #Brent #EnergyMarket #ThiefTrader #BearishSetup #LayeringStrategy #SwingTrade #OilMarket #WTI #USD #Commodities #TechnicalAnalysis

UKOIL H4 | Bullish Bounce OffBased on the H4 chart analysis, we can see that the price is reacting off the buy entry which is a pullback support that aligns with the 38.2% Fibonacci retracement and could bounce from this level to the upside.
Buy entry is at 63.40, which is a pullback support that aligns with the 38.2% Fibonacci retracement
Stop loss is at 62.64, which is a pullback support that aligns witht he 61.8% Fibonacci retracement.
Take profit is at 66.51, which is a multi swing high resitance.
Stratos Markets Limited (tradu.com ):
CFDs are complex instruments and come with a high risk of losing money rapidly due to leverage. 68% of retail investor accounts lose money when trading CFDs with this provider. You should consider whether you understand how CFDs work and whether you can afford to take the high risk of losing your money.
Stratos Europe Ltd (tradu.com ):
CFDs are complex instruments and come with a high risk of losing money rapidly due to leverage. 70% of retail investor accounts lose money when trading CFDs with this provider. You should consider whether you understand how CFDs work and whether you can afford to take the high risk of losing your money.

UKOIL H1 Bearish Reversal Forming at Key ResistanceUKOIL is rising towards the sell entry, which is an overlap resistance and could reverse from this level to the downside.
Sell entry is at 65.05, whic is an overlap resistance.
Stop loss is at 65.77, whic his a pullback resistance that lines up with the 138.2% Fibonacci extension.
Take profit is at 53.84, whic is an overlap support.
Stratos Markets Limited (tradu.com ):
CFDs are complex instruments and come with a high risk of losing money rapidly due to leverage. 68% of retail investor accounts lose money when trading CFDs with this provider. You should consider whether you understand how CFDs work and whether you can afford to take the high risk of losing your money.
Stratos Europe Ltd (tradu.com ):
CFDs are complex instruments and come with a high risk of losing money rapidly due to leverage. 70% of retail investor accounts lose money when trading CFDs with this provider. You should consider whether you understand how CFDs work and whether you can afford to take the high risk of losing your money.

UKOIL H1 | Bearish Momentum BuildingBased on the H1 chart analysis, we can see the price rise to the sell entry, which is a pullback resistance, and could drop from this level.
Sell entry is at 64.43, whichis a pullback resitance.
Stop loss is at 65.10, whichis an overlap resistance.
Take profit is at 62.99, which aligns with the 78.6% Fibonacci projection and serves as a pullback support.
Stratos Markets Limited (tradu.com ):
CFDs are complex instruments and come with a high risk of losing money rapidly due to leverage. 68% of retail investor accounts lose money when trading CFDs with this provider. You should consider whether you understand how CFDs work and whether you can afford to take the high risk of losing your money.
Stratos Europe Ltd (tradu.com ):
CFDs are complex instruments and come with a high risk of losing money rapidly due to leverage. 70% of retail investor accounts lose money when trading CFDs with this provider. You should consider whether you understand how CFDs work and whether you can afford to take the high risk of losing your money.

UKOILSPOT H4 | Falling Towards 50% Fibonacci SupportBased on the H4 chart analysis, we could see the price fall towards the buy entry, which is a pullback support that aligns with the 50% Fibonacci retracement and could bounce from this level to the upside.
Buy entry is at 63.02, whichis a pullback support that lines up witht the 50% Fibonacci retracemnt.
Stop loss is at 61.88, which is a pullback support that is slightly below the 61.8% Fibonacci projection.
Take profit is at 65.61, whichis an overlap resistance.
Stratos Markets Limited (tradu.com ):
CFDs are complex instruments and come with a high risk of losing money rapidly due to leverage. 68% of retail investor accounts lose money when trading CFDs with this provider. You should consider whether you understand how CFDs work and whether you can afford to take the high risk of losing your money.
Stratos Europe Ltd (tradu.com/eu ):
CFDs are complex instruments and come with a high risk of losing money rapidly due to leverage. 70% of retail investor accounts lose money when trading CFDs with this provider. You should consider whether you understand how CFDs work and whether you can afford to take the high risk of losing your money.

UKOIL M30 | Potential Bullish riseUKOIL has bounced off the buy entry aat 60.69, whichis a pullback support and could rise from this level to the upside.
Stop loss is at 59.83, which lines up with the 61.8% Fibonacci projection.
Take profit is at 62.94, which is a swing high resistance.
High Risk Investment Warning
Trading Forex/CFDs on margin carries a high level of risk and may not be suitable for all investors. Leverage can work against you.
Stratos Markets Limited (tradu.com ):
CFDs are complex instruments and come with a high risk of losing money rapidly due to leverage. 65% of retail investor accounts lose money when trading CFDs with this provider. You should consider whether you understand how CFDs work and whether you can afford to take the high risk of losing your money.
Stratos Europe Ltd (tradu.com ):
CFDs are complex instruments and come with a high risk of losing money rapidly due to leverage. 66% of retail investor accounts lose money when trading CFDs with this provider. You should consider whether you understand how CFDs work and whether you can afford to take the high risk of losing your money.
Stratos Global LLC (tradu.com ):
Losses can exceed deposits.
Please be advised that the information presented on TradingView is provided to Tradu (‘Company’, ‘we’) by a third-party provider (‘TFA Global Pte Ltd’). Please be reminded that you are solely responsible for the trading decisions on your account. There is a very high degree of risk involved in trading. Any information and/or content is intended entirely for research, educational and informational purposes only and does not constitute investment or consultation advice or investment strategy. The information is not tailored to the investment needs of any specific person and therefore does not involve a consideration of any of the investment objectives, financial situation or needs of any viewer that may receive it. Kindly also note that past performance is not a reliable indicator of future results. Actual results may differ materially from those anticipated in forward-looking or past performance statements. We assume no liability as to the accuracy or completeness of any of the information and/or content provided herein and the Company cannot be held responsible for any omission, mistake nor for any loss or damage including without limitation to any loss of profit which may arise from reliance on any information supplied by TFA Global Pte Ltd.
The speaker(s) is neither an employee, agent nor representative of Tradu and is therefore acting independently. The opinions given are their own, constitute general market commentary, and do not constitute the opinion or advice of Tradu or any form of personal or investment advice. Tradu neither endorses nor guarantees offerings of third-party speakers, nor is Tradu responsible for the content, veracity or opinions of third-party speakers, presenters or participants.

UKOIL H4 | Falling Towards Fibonacci Confluence LevelUKOIL is falling towards the buy entry at 62.35, which lines up with the 161.8% Fibonacci extension and the 61.8% Fibonacci projection and could bounce from this level to the take profit.
Stop loss is at 61.32, which lines up with the 78.6% Fibonacci projection.
Take profit is at 64.20, which is a pullback resistance.
High Risk Investment Warning
Trading Forex/CFDs on margin carries a high level of risk and may not be suitable for all investors. Leverage can work against you.
Stratos Markets Limited (tradu.com ):
CFDs are complex instruments and come with a high risk of losing money rapidly due to leverage. 65% of retail investor accounts lose money when trading CFDs with this provider. You should consider whether you understand how CFDs work and whether you can afford to take the high risk of losing your money.
Stratos Europe Ltd (tradu.com ):
CFDs are complex instruments and come with a high risk of losing money rapidly due to leverage. 66% of retail investor accounts lose money when trading CFDs with this provider. You should consider whether you understand how CFDs work and whether you can afford to take the high risk of losing your money.
Stratos Global LLC (tradu.com ):
Losses can exceed deposits.
Please be advised that the information presented on TradingView is provided to Tradu (‘Company’, ‘we’) by a third-party provider (‘TFA Global Pte Ltd’). Please be reminded that you are solely responsible for the trading decisions on your account. There is a very high degree of risk involved in trading. Any information and/or content is intended entirely for research, educational and informational purposes only and does not constitute investment or consultation advice or investment strategy. The information is not tailored to the investment needs of any specific person and therefore does not involve a consideration of any of the investment objectives, financial situation or needs of any viewer that may receive it. Kindly also note that past performance is not a reliable indicator of future results. Actual results may differ materially from those anticipated in forward-looking or past performance statements. We assume no liability as to the accuracy or completeness of any of the information and/or content provided herein and the Company cannot be held responsible for any omission, mistake nor for any loss or damage including without limitation to any loss of profit which may arise from reliance on any information supplied by TFA Global Pte Ltd.
The speaker(s) is neither an employee, agent nor representative of Tradu and is therefore acting independently. The opinions given are their own, constitute general market commentary, and do not constitute the opinion or advice of Tradu or any form of personal or investment advice. Tradu neither endorses nor guarantees offerings of third-party speakers, nor is Tradu responsible for the content, veracity or opinions of third-party speakers, presenters or participants.

UKOIL H1 | Bullish Momentum BuildingBased on the H1 chart analysis, we could see the price reacting off the buy entry, which is a pullback support, and a bounce from this level could lead the price to rise to the upside.
Buy entry is at 65.77, which is a pullback support.
Stop loss is at 64.97, which is an overlap support.
Take profit is at 67.13, which is a pullback resistance that is slightly below the 50% Fibonacci retracement.
High Risk Investment Warning
Trading Forex/CFDs on margin carries a high level of risk and may not be suitable for all investors. Leverage can work against you.
Stratos Markets Limited (tradu.com ):
CFDs are complex instruments and come with a high risk of losing money rapidly due to leverage. 65% of retail investor accounts lose money when trading CFDs with this provider. You should consider whether you understand how CFDs work and whether you can afford to take the high risk of losing your money.
Stratos Europe Ltd (tradu.com ):
CFDs are complex instruments and come with a high risk of losing money rapidly due to leverage. 66% of retail investor accounts lose money when trading CFDs with this provider. You should consider whether you understand how CFDs work and whether you can afford to take the high risk of losing your money.
Stratos Global LLC (tradu.com ):
Losses can exceed deposits.
Please be advised that the information presented on TradingView is provided to Tradu (‘Company’, ‘we’) by a third-party provider (‘TFA Global Pte Ltd’). Please be reminded that you are solely responsible for the trading decisions on your account. There is a very high degree of risk involved in trading. Any information and/or content is intended entirely for research, educational and informational purposes only and does not constitute investment or consultation advice or investment strategy. The information is not tailored to the investment needs of any specific person and therefore does not involve a consideration of any of the investment objectives, financial situation or needs of any viewer that may receive it. Kindly also note that past performance is not a reliable indicator of future results. Actual results may differ materially from those anticipated in forward-looking or past performance statements. We assume no liability as to the accuracy or completeness of any of the information and/or content provided herein and the Company cannot be held responsible for any omission, mistake nor for any loss or damage including without limitation to any loss of profit which may arise from reliance on any information supplied by TFA Global Pte Ltd.
The speaker(s) is neither an employee, agent nor representative of Tradu and is therefore acting independently. The opinions given are their own, constitute general market commentary, and do not constitute the opinion or advice of Tradu or any form of personal or investment advice. Tradu neither endorses nor guarantees offerings of third-party speakers, nor is Tradu responsible for the content, veracity or opinions of third-party speakers, presenters or participants.

UKOIL H1 | Potential Bearish Drop AheadBased on the H1 chart analysis, we could see the price rise to the sell entry, which is an overlap resistance that aligns with the 23.6% Fibonacci retracement and could reverse from his levle to the take profit.
Sell entry is at 65.70, which is an overlap resistance that aligns with the 23.6% Fibonacci retracement.
Stop loss is at 66.69, which is a pullback resistance that aligns with the 38.2% Fibonacci retracement.
Take profit is at 64.03, which is a pullback support.
High Risk Investment Warning
Trading Forex/CFDs on margin carries a high level of risk and may not be suitable for all investors. Leverage can work against you.
Stratos Markets Limited (tradu.com ):
CFDs are complex instruments and come with a high risk of losing money rapidly due to leverage. 65% of retail investor accounts lose money when trading CFDs with this provider. You should consider whether you understand how CFDs work and whether you can afford to take the high risk of losing your money.
Stratos Europe Ltd (tradu.com ):
CFDs are complex instruments and come with a high risk of losing money rapidly due to leverage. 66% of retail investor accounts lose money when trading CFDs with this provider. You should consider whether you understand how CFDs work and whether you can afford to take the high risk of losing your money.
Stratos Global LLC (tradu.com ):
Losses can exceed deposits.
Please be advised that the information presented on TradingView is provided to Tradu (‘Company’, ‘we’) by a third-party provider (‘TFA Global Pte Ltd’). Please be reminded that you are solely responsible for the trading decisions on your account. There is a very high degree of risk involved in trading. Any information and/or content is intended entirely for research, educational and informational purposes only and does not constitute investment or consultation advice or investment strategy. The information is not tailored to the investment needs of any specific person and therefore does not involve a consideration of any of the investment objectives, financial situation or needs of any viewer that may receive it. Kindly also note that past performance is not a reliable indicator of future results. Actual results may differ materially from those anticipated in forward-looking or past performance statements. We assume no liability as to the accuracy or completeness of any of the information and/or content provided herein and the Company cannot be held responsible for any omission, mistake nor for any loss or damage including without limitation to any loss of profit which may arise from reliance on any information supplied by TFA Global Pte Ltd.
The speaker(s) is neither an employee, agent nor representative of Tradu and is therefore acting independently. The opinions given are their own, constitute general market commentary, and do not constitute the opinion or advice of Tradu or any form of personal or investment advice. Tradu neither endorses nor guarantees offerings of third-party speakers, nor is Tradu responsible for the content, veracity or opinions of third-party speakers, presenters or participants.

UKOIL H4 | Bullish Reversal in PlayBased on the H4 chart analysis, we can see that the price has bounced off the entry, which is a pullback support that could potentially rise from this level to the upside.
Buy entry is at 65.58, which his a pullback support.
Stop loss is at 64.54, which aligns with the 127.2% Fibonacci extension.
Take profit is at 68.44, which his a pullback resistance that lines up with the 61.8% Fibonacci retracement.
High Risk Investment Warning
Trading Forex/CFDs on margin carries a high level of risk and may not be suitable for all investors. Leverage can work against you.
Stratos Markets Limited (tradu.com ):
CFDs are complex instruments and come with a high risk of losing money rapidly due to leverage. 65% of retail investor accounts lose money when trading CFDs with this provider. You should consider whether you understand how CFDs work and whether you can afford to take the high risk of losing your money.
Stratos Europe Ltd (tradu.com ):
CFDs are complex instruments and come with a high risk of losing money rapidly due to leverage. 66% of retail investor accounts lose money when trading CFDs with this provider. You should consider whether you understand how CFDs work and whether you can afford to take the high risk of losing your money.
Stratos Global LLC (tradu.com ):
Losses can exceed deposits.
Please be advised that the information presented on TradingView is provided to Tradu (‘Company’, ‘we’) by a third-party provider (‘TFA Global Pte Ltd’). Please be reminded that you are solely responsible for the trading decisions on your account. There is a very high degree of risk involved in trading. Any information and/or content is intended entirely for research, educational and informational purposes only and does not constitute investment or consultation advice or investment strategy. The information is not tailored to the investment needs of any specific person and therefore does not involve a consideration of any of the investment objectives, financial situation or needs of any viewer that may receive it. Kindly also note that past performance is not a reliable indicator of future results. Actual results may differ materially from those anticipated in forward-looking or past performance statements. We assume no liability as to the accuracy or completeness of any of the information and/or content provided herein and the Company cannot be held responsible for any omission, mistake nor for any loss or damage including without limitation to any loss of profit which may arise from reliance on any information supplied by TFA Global Pte Ltd.
The speaker(s) is neither an employee, agent nor representative of Tradu and is therefore acting independently. The opinions given are their own, constitute general market commentary, and do not constitute the opinion or advice of Tradu or any form of personal or investment advice. Tradu neither endorses nor guarantees offerings of third-party speakers, nor is Tradu responsible for the content, veracity or opinions of third-party speakers, presenters or participants.

UKOIL H4 | Based on the H4 chart analysis, we could see the price fall to the buy entry which is a pullback support that aligns with the 50% Fibonacci retracement and could bounce from this levle to the upside.
Buy entry is at 68.47, which is a pullback support that aligns with the 50% Fibonacci retracement.
Stop loss is at 67.17, which is a pullback support that is slightly above the 78.6% Fibonacci retracement.
Take profit is at 70.53, which is a swing high resistance.
High Risk Investment Warning
Trading Forex/CFDs on margin carries a high level of risk and may not be suitable for all investors. Leverage can work against you.
Stratos Markets Limited (tradu.com ):
CFDs are complex instruments and come with a high risk of losing money rapidly due to leverage. 65% of retail investor accounts lose money when trading CFDs with this provider. You should consider whether you understand how CFDs work and whether you can afford to take the high risk of losing your money.
Stratos Europe Ltd (tradu.com ):
CFDs are complex instruments and come with a high risk of losing money rapidly due to leverage. 66% of retail investor accounts lose money when trading CFDs with this provider. You should consider whether you understand how CFDs work and whether you can afford to take the high risk of losing your money.
Stratos Global LLC (tradu.com ):
Losses can exceed deposits.
Please be advised that the information presented on TradingView is provided to Tradu (‘Company’, ‘we’) by a third-party provider (‘TFA Global Pte Ltd’). Please be reminded that you are solely responsible for the trading decisions on your account. There is a very high degree of risk involved in trading. Any information and/or content is intended entirely for research, educational and informational purposes only and does not constitute investment or consultation advice or investment strategy. The information is not tailored to the investment needs of any specific person and therefore does not involve a consideration of any of the investment objectives, financial situation or needs of any viewer that may receive it. Kindly also note that past performance is not a reliable indicator of future results. Actual results may differ materially from those anticipated in forward-looking or past performance statements. We assume no liability as to the accuracy or completeness of any of the information and/or content provided herein and the Company cannot be held responsible for any omission, mistake nor for any loss or damage including without limitation to any loss of profit which may arise from reliance on any information supplied by TFA Global Pte Ltd.
The speaker(s) is neither an employee, agent nor representative of Tradu and is therefore acting independently. The opinions given are their own, constitute general market commentary, and do not constitute the opinion or advice of Tradu or any form of personal or investment advice. Tradu neither endorses nor guarantees offerings of third-party speakers, nor is Tradu responsible for the content, veracity or opinions of third-party speakers, presenters or participants.

UKOIL H4 | Potential bearish dropUKOIL has rejected the sell entry which is a pullback resistance and could drop from this level to the downside.
Sell entry is at 66.770, which is a pullback resistance.
Stop loss is at 67.67, which is a pullback resistance.
Take profit is at 65.04, which is a multi swing low support.
High Risk Investment Warning
Trading Forex/CFDs on margin carries a high level of risk and may not be suitable for all investors. Leverage can work against you.
Stratos Markets Limited (tradu.com ):
CFDs are complex instruments and come with a high risk of losing money rapidly due to leverage. 65% of retail investor accounts lose money when trading CFDs with this provider. You should consider whether you understand how CFDs work and whether you can afford to take the high risk of losing your money.
Stratos Europe Ltd (tradu.com ):
CFDs are complex instruments and come with a high risk of losing money rapidly due to leverage. 66% of retail investor accounts lose money when trading CFDs with this provider. You should consider whether you understand how CFDs work and whether you can afford to take the high risk of losing your money.
Stratos Global LLC (tradu.com ):
Losses can exceed deposits.
Please be advised that the information presented on TradingView is provided to Tradu (‘Company’, ‘we’) by a third-party provider (‘TFA Global Pte Ltd’). Please be reminded that you are solely responsible for the trading decisions on your account. There is a very high degree of risk involved in trading. Any information and/or content is intended entirely for research, educational and informational purposes only and does not constitute investment or consultation advice or investment strategy. The information is not tailored to the investment needs of any specific person and therefore does not involve a consideration of any of the investment objectives, financial situation or needs of any viewer that may receive it. Kindly also note that past performance is not a reliable indicator of future results. Actual results may differ materially from those anticipated in forward-looking or past performance statements. We assume no liability as to the accuracy or completeness of any of the information and/or content provided herein and the Company cannot be held responsible for any omission, mistake nor for any loss or damage including without limitation to any loss of profit which may arise from reliance on any information supplied by TFA Global Pte Ltd.
The speaker(s) is neither an employee, agent nor representative of Tradu and is therefore acting independently. The opinions given are their own, constitute general market commentary, and do not constitute the opinion or advice of Tradu or any form of personal or investment advice. Tradu neither endorses nor guarantees offerings of third-party speakers, nor is Tradu responsible for the content, veracity or opinions of third-party speakers, presenters or participants.

UKOIL H4 | Bearish reversal off 50% Fibonacci resistanceBased on the H4 chart analysis, we could see the price rise to the sell entry, which is a pullback resistance that aligns with the 50% Fibonacci retracement and could reverse from this level to the downside.
Sell entry is at 67.65, which is a pullback resistance that aligns with the 50% Fibonacci retracement.
Stop loss is at 68.69, which is a swing high resistance level.
Take profit is at 65.78, which is a pullback support level.
High Risk Investment Warning
Trading Forex/CFDs on margin carries a high level of risk and may not be suitable for all investors. Leverage can work against you.
Stratos Markets Limited (tradu.com ):
CFDs are complex instruments and come with a high risk of losing money rapidly due to leverage. 65% of retail investor accounts lose money when trading CFDs with this provider. You should consider whether you understand how CFDs work and whether you can afford to take the high risk of losing your money.
Stratos Europe Ltd (tradu.com ):
CFDs are complex instruments and come with a high risk of losing money rapidly due to leverage. 66% of retail investor accounts lose money when trading CFDs with this provider. You should consider whether you understand how CFDs work and whether you can afford to take the high risk of losing your money.
Stratos Global LLC (tradu.com ):
Losses can exceed deposits.
Please be advised that the information presented on TradingView is provided to Tradu (‘Company’, ‘we’) by a third-party provider (‘TFA Global Pte Ltd’). Please be reminded that you are solely responsible for the trading decisions on your account. There is a very high degree of risk involved in trading. Any information and/or content is intended entirely for research, educational and informational purposes only and does not constitute investment or consultation advice or investment strategy. The information is not tailored to the investment needs of any specific person and therefore does not involve a consideration of any of the investment objectives, financial situation or needs of any viewer that may receive it. Kindly also note that past performance is not a reliable indicator of future results. Actual results may differ materially from those anticipated in forward-looking or past performance statements. We assume no liability as to the accuracy or completeness of any of the information and/or content provided herein and the Company cannot be held responsible for any omission, mistake nor for any loss or damage including without limitation to any loss of profit which may arise from reliance on any information supplied by TFA Global Pte Ltd.
The speaker(s) is neither an employee, agent nor representative of Tradu and is therefore acting independently. The opinions given are their own, constitute general market commentary, and do not constitute the opinion or advice of Tradu or any form of personal or investment advice. Tradu neither endorses nor guarantees offerings of third-party speakers, nor is Tradu responsible for the content, veracity or opinions of third-party speakers, presenters or participants.

UKOIL H1 | Potential bearish dropBased on the H1 chart analysis, we can see that the price has reacted off the sell entry, which is a pullback resistance, and could drop from this level to the downside.
Sell entry is at 66.41, which is a pullback resistance.
Stop loss is at 67.10, which is a pullback resistance.
Take profit is at 65.09, which is a swing high support.
High Risk Investment Warning
Trading Forex/CFDs on margin carries a high level of risk and may not be suitable for all investors. Leverage can work against you.
Stratos Markets Limited (tradu.com ):
CFDs are complex instruments and come with a high risk of losing money rapidly due to leverage. 65% of retail investor accounts lose money when trading CFDs with this provider. You should consider whether you understand how CFDs work and whether you can afford to take the high risk of losing your money.
Stratos Europe Ltd (tradu.com ):
CFDs are complex instruments and come with a high risk of losing money rapidly due to leverage. 66% of retail investor accounts lose money when trading CFDs with this provider. You should consider whether you understand how CFDs work and whether you can afford to take the high risk of losing your money.
Stratos Global LLC (tradu.com ):
Losses can exceed deposits.
Please be advised that the information presented on TradingView is provided to Tradu (‘Company’, ‘we’) by a third-party provider (‘TFA Global Pte Ltd’). Please be reminded that you are solely responsible for the trading decisions on your account. There is a very high degree of risk involved in trading. Any information and/or content is intended entirely for research, educational and informational purposes only and does not constitute investment or consultation advice or investment strategy. The information is not tailored to the investment needs of any specific person and therefore does not involve a consideration of any of the investment objectives, financial situation or needs of any viewer that may receive it. Kindly also note that past performance is not a reliable indicator of future results. Actual results may differ materially from those anticipated in forward-looking or past performance statements. We assume no liability as to the accuracy or completeness of any of the information and/or content provided herein and the Company cannot be held responsible for any omission, mistake nor for any loss or damage including without limitation to any loss of profit which may arise from reliance on any information supplied by TFA Global Pte Ltd.
The speaker(s) is neither an employee, agent nor representative of Tradu and is therefore acting independently. The opinions given are their own, constitute general market commentary, and do not constitute the opinion or advice of Tradu or any form of personal or investment advice. Tradu neither endorses nor guarantees offerings of third-party speakers, nor is Tradu responsible for the content, veracity or opinions of third-party speakers, presenters or participants.

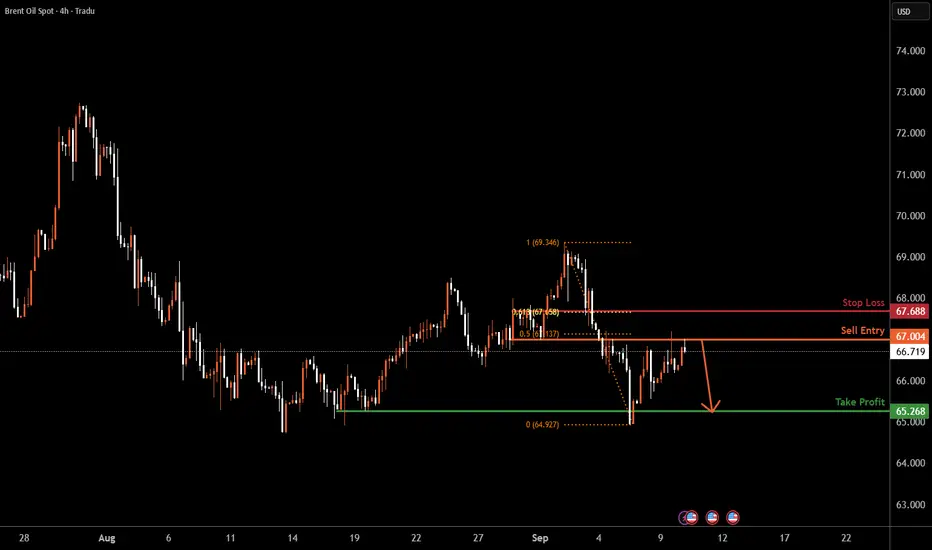
UKOILSPOT H4 | Potential bearish drop offBased on the H4 chart analysis, we can see that the price is reacting off the sell entry which is a pullback resistance that aligns with the 50% Fibonacci retracement and could drop from this level to the downside.
Sell entry is at 67.00, which is a pullback resistance that lines up with he 50% Fibonacci retracement.
Stop loss is at 67.68, which is a pullback resistance that aligns with the 61.8% Fibonacci retracement.
Take profit is at 65.26, which is a pullback support.
High Risk Investment Warning
Trading Forex/CFDs on margin carries a high level of risk and may not be suitable for all investors. Leverage can work against you.
Stratos Markets Limited (tradu.com ):
CFDs are complex instruments and come with a high risk of losing money rapidly due to leverage. 65% of retail investor accounts lose money when trading CFDs with this provider. You should consider whether you understand how CFDs work and whether you can afford to take the high risk of losing your money.
Stratos Europe Ltd (tradu.com ):
CFDs are complex instruments and come with a high risk of losing money rapidly due to leverage. 66% of retail investor accounts lose money when trading CFDs with this provider. You should consider whether you understand how CFDs work and whether you can afford to take the high risk of losing your money.
Stratos Global LLC (tradu.com ):
Losses can exceed deposits.
Please be advised that the information presented on TradingView is provided to Tradu (‘Company’, ‘we’) by a third-party provider (‘TFA Global Pte Ltd’). Please be reminded that you are solely responsible for the trading decisions on your account. There is a very high degree of risk involved in trading. Any information and/or content is intended entirely for research, educational and informational purposes only and does not constitute investment or consultation advice or investment strategy. The information is not tailored to the investment needs of any specific person and therefore does not involve a consideration of any of the investment objectives, financial situation or needs of any viewer that may receive it. Kindly also note that past performance is not a reliable indicator of future results. Actual results may differ materially from those anticipated in forward-looking or past performance statements. We assume no liability as to the accuracy or completeness of any of the information and/or content provided herein and the Company cannot be held responsible for any omission, mistake nor for any loss or damage including without limitation to any loss of profit which may arise from reliance on any information supplied by TFA Global Pte Ltd.
The speaker(s) is neither an employee, agent nor representative of Tradu and is therefore acting independently. The opinions given are their own, constitute general market commentary, and do not constitute the opinion or advice of Tradu or any form of personal or investment advice. Tradu neither endorses nor guarantees offerings of third-party speakers, nor is Tradu responsible for the content, veracity or opinions of third-party speakers, presenters or participants.
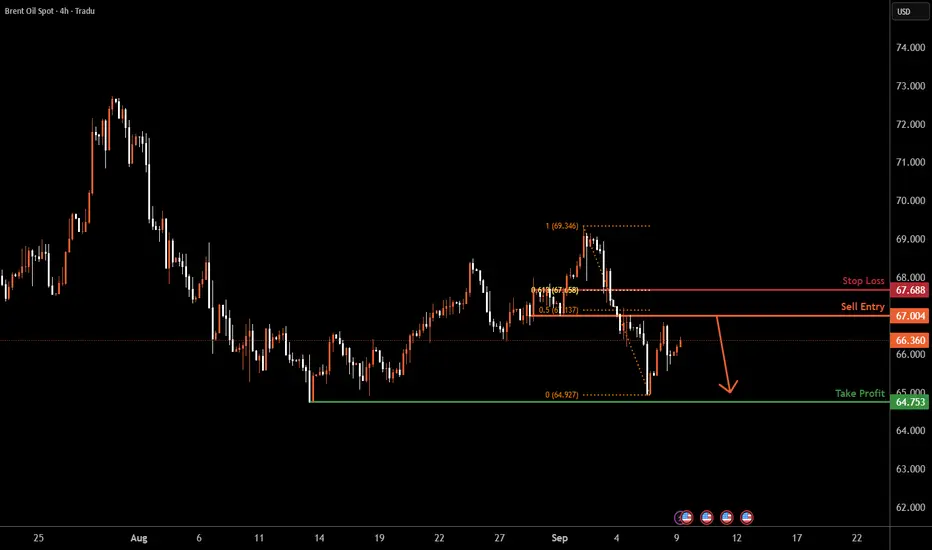
UKOILSPOT H4 | Bearish reversal off 50% Fibonacci resistanceBased on the H4 chart analysis, we could see the price rise to the sell entry, which is a pullback resistance that aligns with the 50% Fibonacci retracement and could reverse from this level to the downside.
Sell entry is at 67.00, which is a pullback resistance lines up with the 50% Fibonacci retracement.
Stop loss is at 67.68, which is a pullback resistance that aligns with the 61.8% Fibonacci retracement.
Take profit is at 64.75, which is a swing low support.
High Risk Investment Warning
Trading Forex/CFDs on margin carries a high level of risk and may not be suitable for all investors. Leverage can work against you.
Stratos Markets Limited (tradu.com ):
CFDs are complex instruments and come with a high risk of losing money rapidly due to leverage. 65% of retail investor accounts lose money when trading CFDs with this provider. You should consider whether you understand how CFDs work and whether you can afford to take the high risk of losing your money.
Stratos Europe Ltd (tradu.com ):
CFDs are complex instruments and come with a high risk of losing money rapidly due to leverage. 66% of retail investor accounts lose money when trading CFDs with this provider. You should consider whether you understand how CFDs work and whether you can afford to take the high risk of losing your money.
Stratos Global LLC (tradu.com ):
Losses can exceed deposits.
Please be advised that the information presented on TradingView is provided to Tradu (‘Company’, ‘we’) by a third-party provider (‘TFA Global Pte Ltd’). Please be reminded that you are solely responsible for the trading decisions on your account. There is a very high degree of risk involved in trading. Any information and/or content is intended entirely for research, educational and informational purposes only and does not constitute investment or consultation advice or investment strategy. The information is not tailored to the investment needs of any specific person and therefore does not involve a consideration of any of the investment objectives, financial situation or needs of any viewer that may receive it. Kindly also note that past performance is not a reliable indicator of future results. Actual results may differ materially from those anticipated in forward-looking or past performance statements. We assume no liability as to the accuracy or completeness of any of the information and/or content provided herein and the Company cannot be held responsible for any omission, mistake nor for any loss or damage including without limitation to any loss of profit which may arise from reliance on any information supplied by TFA Global Pte Ltd.
The speaker(s) is neither an employee, agent nor representative of Tradu and is therefore acting independently. The opinions given are their own, constitute general market commentary, and do not constitute the opinion or advice of Tradu or any form of personal or investment advice. Tradu neither endorses nor guarantees offerings of third-party speakers, nor is Tradu responsible for the content, veracity or opinions of third-party speakers, presenters or participants.
UKOIL H4 | Bullish momentum to extendUKOIL is falling towards the buy entry at 68.28, which is a pullback support that aligns with the 50% Fibonacci retracement and could bounce from this level to the upside.
Stop loss is at 66.95, whichis an overlap support that lines up with he 61.8% Fibonacci retracement.
Take profit is at 70.43, which is a pullback resistance that lines up with the 61.8% Fibonacci retracement.
High Risk Investment Warning
Trading Forex/CFDs on margin carries a high level of risk and may not be suitable for all investors. Leverage can work against you.
Stratos Markets Limited (tradu.com ):
CFDs are complex instruments and come with a high risk of losing money rapidly due to leverage. 65% of retail investor accounts lose money when trading CFDs with this provider. You should consider whether you understand how CFDs work and whether you can afford to take the high risk of losing your money.
Stratos Europe Ltd (tradu.com ):
CFDs are complex instruments and come with a high risk of losing money rapidly due to leverage. 66% of retail investor accounts lose money when trading CFDs with this provider. You should consider whether you understand how CFDs work and whether you can afford to take the high risk of losing your money.
Stratos Global LLC (tradu.com ):
Losses can exceed deposits.
Please be advised that the information presented on TradingView is provided to Tradu (‘Company’, ‘we’) by a third-party provider (‘TFA Global Pte Ltd’). Please be reminded that you are solely responsible for the trading decisions on your account. There is a very high degree of risk involved in trading. Any information and/or content is intended entirely for research, educational and informational purposes only and does not constitute investment or consultation advice or investment strategy. The information is not tailored to the investment needs of any specific person and therefore does not involve a consideration of any of the investment objectives, financial situation or needs of any viewer that may receive it. Kindly also note that past performance is not a reliable indicator of future results. Actual results may differ materially from those anticipated in forward-looking or past performance statements. We assume no liability as to the accuracy or completeness of any of the information and/or content provided herein and the Company cannot be held responsible for any omission, mistake nor for any loss or damage including without limitation to any loss of profit which may arise from reliance on any information supplied by TFA Global Pte Ltd.
The speaker(s) is neither an employee, agent nor representative of Tradu and is therefore acting independently. The opinions given are their own, constitute general market commentary, and do not constitute the opinion or advice of Tradu or any form of personal or investment advice. Tradu neither endorses nor guarantees offerings of third-party speakers, nor is Tradu responsible for the content, veracity or opinions of third-party speakers, presenters or participants.
