Uniswap (UNI) - March 22Hello?
Dear traders, nice to meet you.
By "following" you can always get new information quickly.
Please also click "Like".
Have a good day.
-------------------------------------------------- -----
We need to see if it can rise along the uptrend line (2).
If you fall at 30.316, you need a short stop loss.
However, it may rise along the uptrend line (3), so careful trading is necessary.
Trading volume started to decline from February 18th, and trading volume has been low so far.
As a result, rapid movement may occur, so careful trading is necessary.
--------------------------------------
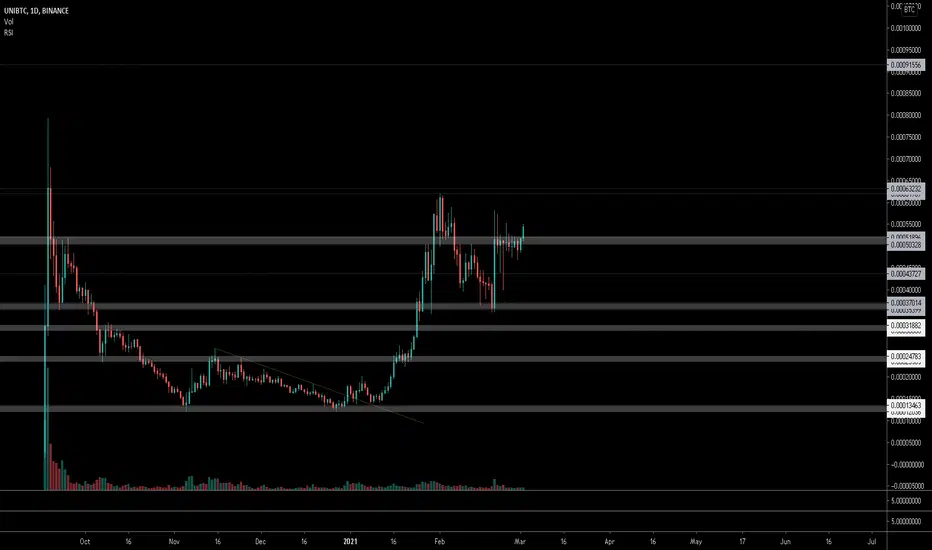
(UNIBTC 1D chart)
We must see if it can rise above the 0.00061028 point by following the uptrend line.
If you fall from the 0.00053565 point, you need a short stop loss.
However, you need to trade carefully as you can gain support and climb in the 0.00044983-0.00048994 range.
-------------------------------------------------- -------------------------------------------
** All indicators are lagging indicators.
So, it's important to be aware that the indicator moves accordingly with the movement of price and volume.
Just for the sake of convenience, we are talking upside down for interpretation of the indicators.
** The wRSI_SR indicator is an indicator created by adding settings and options from the existing Stochastic RSI indicator.
Therefore, the interpretation is the same as the conventional stochastic RSI indicator. (K, D line -> R, S line)
** The OBV indicator was re-created by applying a formula to the DepthHouse Trading indicator, an indicator published by oh92. (Thank you for this.)
** Check support, resistance, and abbreviation points.
** Support or resistance is based on the closing price of the 1D chart.
** All explanations are for reference only and do not guarantee profit or loss on investment.
Explanation of abbreviations displayed on the chart
R: A point or section of resistance that requires a response to preserve profits
S-L: Stop Loss point or section
S: A point or segment that can be bought for profit generation as a support point or segment
(Short-term Stop Loss can be said to be a point where profits and losses can be preserved or additionally entered through installment transactions. It is a short-term investment perspective.)
GAP refers to the difference in prices that occurred when the stock market, CME, and BAKKT exchanges were closed because they are not trading 24 hours a day.
G1: Closing price when closed
G2: Cigar at the time of opening
(Example) Gap (G1-G2)
Unibtc

$uni - #uniswap looks amazing here 🚀#uni 🧞🚀If it is able to break above the 50 day MA then we will move higher where we need 1 major flip of the resistance to reach our targets. The first target will be achieved, very quickly once we flip the 50 day MA.

UNI - $40 TargetA quick view of UNI. in the immediate term - Trying to break up into channel above. I think I saw something similar in Link.
$40 target seems reasonable by end of March. Stretch target of $45
Note these charts take me about 60 seconds to build so they are not always 100% inline with support / resistance but I'd argue they are 99% accurate and do a good enough job to identify key trends :)
Best, Hard Forky

$UNIUSD | Model Gives Bullish Signal | Identifies New ATH'sHello Traders,
The Model has identified new targets in UNIUSD. Targets and Support identified on the chart.
The model tries to identify pressure points in any given market. The pressure points themselves identify the breadth and strength of the move to come. It exists in all time frames and can be applied to any market. The targets are printed as data is fed into the algorithm. The further away from the pressure point, the lower probability it has of attaining such levels and the higher the probability of a correction/reversal.


$UNI, Seems its swaps days..$UNI
Seems its swaps days..
UCTS 1D buy flashing as its trying to break from accumulation range above ~50k sats support level
#UNI

UNIBTC - Descison Time: Strong Trend Holding but will it?Hello Traders,
Yes, a confusing tagline. UNI is holding an upward trendline as of lately on multiple time frames.
We've formed somewhat of a symmetrical triangle. This can lead to two different options and consolidation I don't believe is one of them.
In the coming hours/ day we will see a strong movement to the downside or up. Being an optimist, I'll point to the upside but optimism has never moved markets. So, my second fallback is looking at the charts, reading market sentiment, and using price confirmations to make decisions.
As you see above, there is a green rectangle. The price is just below it. Once we see a break to the upside and a close holding above it, I will enter a long position. Choppy markets like this, will usually create opportunities for smaller gains but gains never the less. I'm shooting for 20% gains and I'm holding a very tight stop loss right below the bottom line of the triangle.
Good luck!

Long UNIBTC (D1)1/ Descending resistance breakout on decent volume
2/ support confirmed
3/ R/R = 6:1

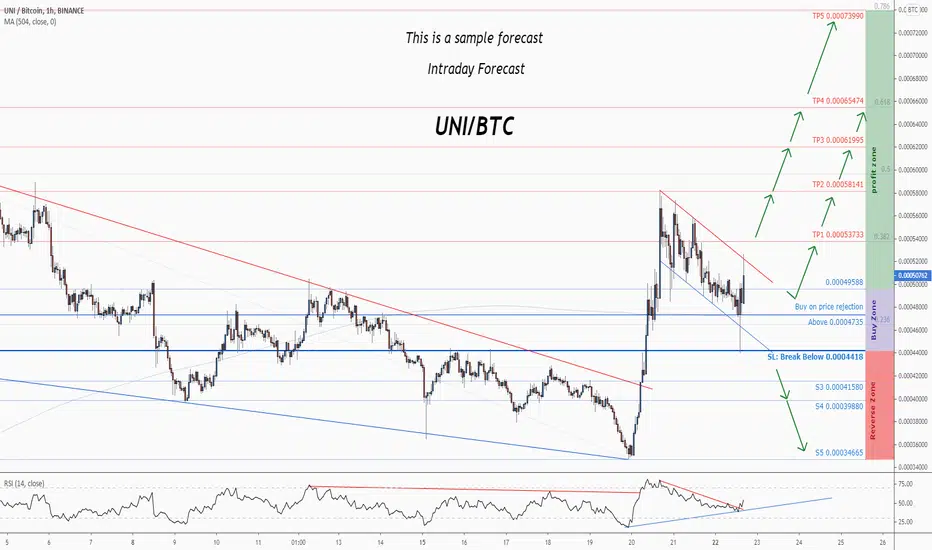
It's a great buy opportunity in UNIBTC @Uniswap @Bitcoin Trading suggestion:
. There is a possibility of temporary retracement to suggested support line (0.00047350). if so, traders can set orders based on Price Action and expect to reach short-term targets.
Technical analysis:
. UNIBTC UNI Bitcoin is in a range bound and the beginning of uptrend is expected.
.The price is above the 21-Day WEMA which acts as a dynamic support.
. The RSI is at 58.
Take Profits:
TP1= @ 0.00053733
TP2= @ 0.00058141
TP3= @ 0.00061995
TP4= @ 0.00065474
TP5= @ 0.00073990
SL= Break below S2
❤️ If you find this helpful and want more FREE forecasts in TradingView
. . . . . Please show your support back,
. . . . . . . . Hit the 👍 LIKE button,
. . . . . . . . . . . Drop some feedback below in the comment!
❤️ Your Support is very much 🙏 appreciated! ❤️
💎 Want us to help you become a better Forex trader ?
Now, It's your turn !
Be sure to leave a comment let us know how do you see this opportunity and forecast.
Trade well, ❤️
ForecastCity English Support Team ❤️
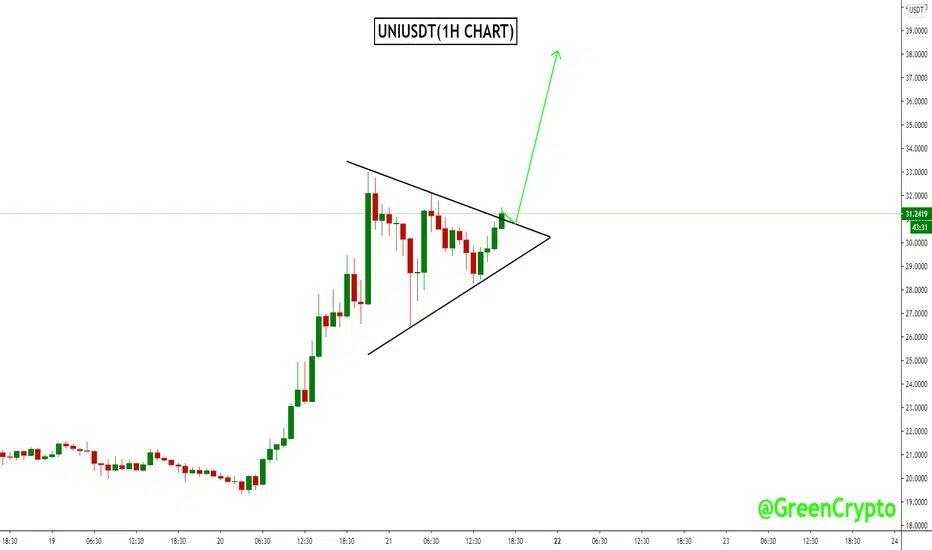
UNIUSDT (UNISWAP) Symmetric Triangle UNIUSDT (1H CHART) Technical Analysis Update
Triangle Breakout
UNI/USDT currently trading at $31.00
Buy-level: above $31.50
Stop loss: below $28.25
Target 1: $35.00
Target 2: $40.00
Max Leverage: 3X
ALWAYS KEEP STOP LOSS...
Follow Our Tradingview Account for More Technical Analysis Updates, | Like, Share and Comment Your thoughts.
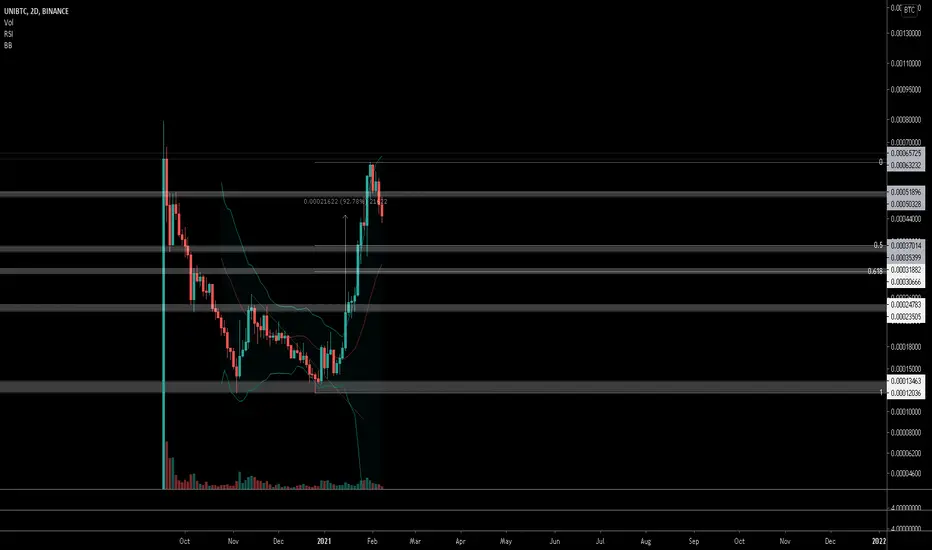
UNISWAP-Ending diagonal patternIn the 240-minute chart, the first 5 ascending waves are completed in the range of 61986 Satoshi, and the corrective movement is completed in the range of 34774 with Ending Diagonal pattern. Due to the price increase, there is a scenario that wave 3 has been started, the initial target of which is 134977 Satoshi and the final is the targets of 235459 Satoshi.

long uni. good for $44 USDUNI is into price exploration mode and could get as high as $44 USD before correcting!

UNI TargetsBINANCE:UNIBTC take profits at blue lines. Good luck! Oh, and as always, use a stop-loss.

UNI - cup and handleUNI - cup and handle
Took some my ada profits and put some in UNI, btc chart looks like a cup and handle to me!

UNIUSDT (UNISWAP) Cup and Handle PatternUNIUSDT (4H CHART) Technical Analysis Update
Cup and handle pattern breakout
UNI/USDT currently trading at $23
Buy-level: $22.5 to $23.00
Stop loss: below $ 20
Target 1: $25
Target 2: $30
Max Leverage: 2X
ALWAYS KEEP STOP LOSS...
Follow Our Tradingview Account for More Technical Analysis Updates, | Like, Share and Comment Your thoughts.

UNISWAP 🦄 WHAT IS NEXT? CHECK IT OUT💸UNI - Uniswap!🦄
Good afternoon everyone! Over here my uniswap analysis for today. Uniswap is one of the most important DEX (decentralised exchange) right now! It hasn't been today too much for the last 2 weeks, and that's mostly s good sign, this means it cooled of and is ready to go again 💪🏼💪🏼
So, over here you can see the breakout with the volume confirmation (2nd pic). 🚀🚀
We might see very soon levels of;
1.24.5 - 25.9
2. 28 - 31.4
Those two are for the coming time, might UNI break these levels, I'll update you guys on the next targets! 😍

$UNI, Looking for lower levels unless..$UNI
Looking for lower levels(37-31k) as a potential re-entry invalidation and signal of continuation to new highs if it quickly recovers ~52k sats..
UCTS remaining bullish on higher timeframes for now.
#UNI
UNISWAP - The Simplest Trading Strategy in the WorldUNISWAP
The Simplest Trading Strategy in the World. be patient and let the trade comes to you
Trading Responsibly: Your Ticket to Long Term Success
Resistance 1 --- 19.14
Resistance 2 --- 20.25
Resistance 3 -- 21.39
Resistance 4 -- 22.56
Resistance 5 --- 23.77 Breakout

UNIUSDT (UNI) - POTENTIAL BREAKOUT ANALYSIS 🔎
- UNIUSDT is printing an ascending triangle pattern.
- This is a bullish build up pattern.
- There's an upward breakout potential.
BUY ENTRY ⬆️
- Breakout above the ascending triangle's horizontal resistance.
TARGETS 🎯
- Fibonacci extension levels.
SETUP INVALIDATION ❌
- Breakdown below the ascending triangle's inclined support.
