ETH Base Formation Under Bearish PressureCRYPTOCAP:ETH is forming a solid base near the bottom, which is a positive sign for a potential short-term bounce.
However, the overall trend remains bearish, with price still capped below the descending trendline and resistance zone.
Any upside from here is likely corrective unless ETH breaks and holds above key resistance.
DYOR, NFA
Please hit the like button if you like it, and share your views in the comments section.
Unichartz

BTC Structure Under PressureCRYPTOCAP:BTC has broken its key rising trendline, signaling a loss of bullish momentum. Price is now consolidating around the 100 EMA, which is acting as the last major dynamic support.
As long as BTC holds this zone, we may see stabilization or a bounce, but a clean breakdown below the 100 EMA could open the door for further downside and a short-term shift in market structure.
DYOR, NFA
Please hit the like button if you like it, and share your views in the comments section.

AVNT Testing Key Resistance After Trendline BreakNYSE:AVNT is testing a key resistance zone after breaking above the descending trendline. While this bounce looks promising, price needs to hold above this level for any sustained upside.
A rejection here could lead to another pullback, so confirmation is key.
DYOR, NFA

Altcoin Market Cap Building Energy Before Next ExpansionThe total crypto market cap excluding the top 10 continues to follow a familiar cycle of accumulation, breakout, expansion, and consolidation. After strong moves, the market typically ranges for a period before the next leg.
Currently, it is consolidating within a wide range, similar to past phases before major expansions. This suggests the market is building energy, not distributing.
A breakout above the range could trigger the next expansion phase for altcoins, while patience is needed until that happens.
NFA
Please hit the like button if you like it, and share your views in the comments section.

Critical USDT.D Test: Altcoin Relief or More Pain?USDT dominance is pushing into its long-term trendline resistance again. If this level rejects, it usually signals fresh money rotating back into altcoins.
But if USDT.D breaks out and holds above the trendline, it could put pressure on alts and slow down their momentum.
This is a key spot for the altcoin market.
DYOR, NFA
Please hit the like button if you like it, and share your views in the comments section.

BTC at Risk: Structure Break + RSI Warning$BTC/USDT is showing some concern on the monthly chart as price has broken below the rising wedge and is now retesting a major demand zone. Losing this zone could trigger a deeper correction.
At the same time, RSI is showing a clear multi-year bearish divergence, highlighting weakening momentum.
Until BTC reclaims the wedge support or closes back above the resistance band, downside risk remains elevated.
DYOR, NFA
Please hit the like button if you like it, and share your views in the comments section.

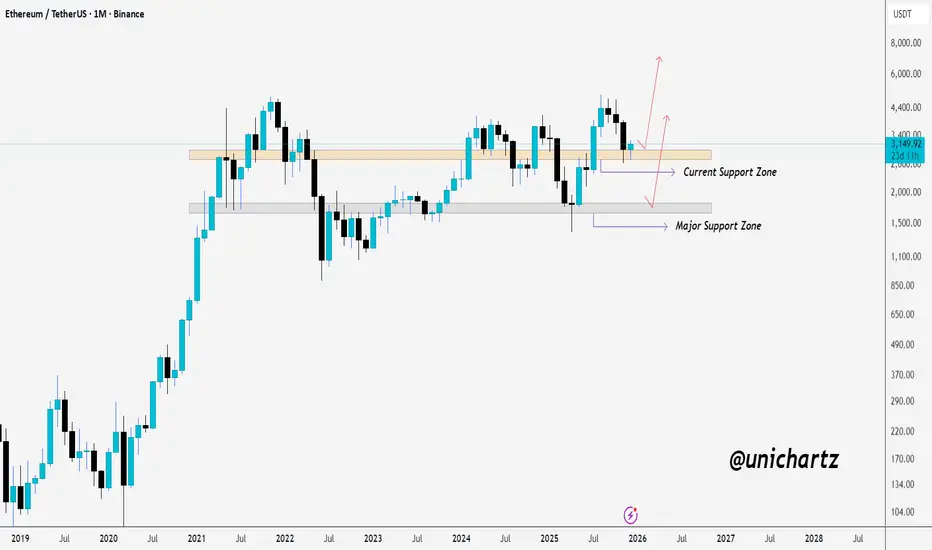
ETH Monthly Structure Intact Above SupportCRYPTOCAP:ETH is holding its monthly support zone once again, showing buyers are still defending this level.
As long as the price stays above this area, the structure favors a bounce toward the upper range.
A breakdown, however, would shift focus to the major support zone below.
DYOR, NFA
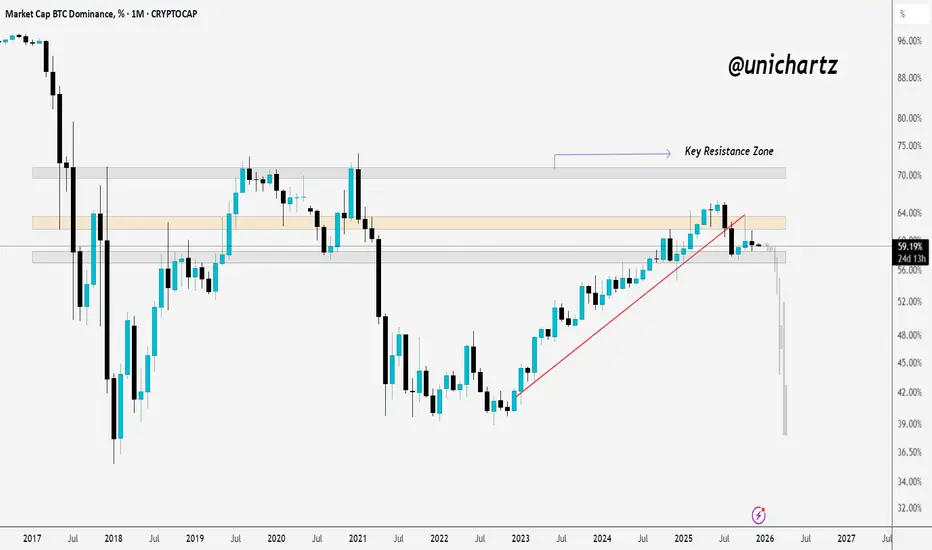
BTC.D Rejected From Key Monthly ResistanceBTC dominance is still sitting below the key monthly resistance zone, showing clear rejection from the top.
As long as dominance stays under this area, it suggests money isn’t aggressively flowing into BTC, leaving room for altcoins to stabilize or gain some strength.
A breakout above the resistance would shift momentum back toward BTC, but for now the structure looks capped below this zone.
DYOR, NFA
Altcoins Get a Boost as ETH/BTC Breaks StructureETH/BTC breaking out of the falling wedge is a positive sign for the altcoin market.
When this pair starts gaining strength, it usually boosts overall altcoin performance.
If ETH holds this breakout, it could ignite a broader altcoin rotation in the coming sessions.
DYOR, NFA
#PEACE
Please hit the like button if you like it, and share your views in the comments section.

SOL Near Inflection PointCRYPTOCAP:SOL is holding well above the mid S/R zone and showing solid strength. If it continues to rebound from this area, price could push back toward the upper resistance.
But if SOL breaks below this zone, it may slide down toward the $80 levels.
DYOR, NFA
Please hit the like button if you like it, and share your views in the comments section.

LINK Showing Strength at Long-Term Support ZoneBIST:LINK is bouncing cleanly from its long-term weekly trendline support, keeping the bullish structure intact.
Price is still moving inside a large wedge, and if this rebound continues, a retest of the upper resistance line is likely.
A breakout above that level could open the door for a stronger move.
DYOR, NFA
Please hit the like button if you like it, and share your views in the comments section.

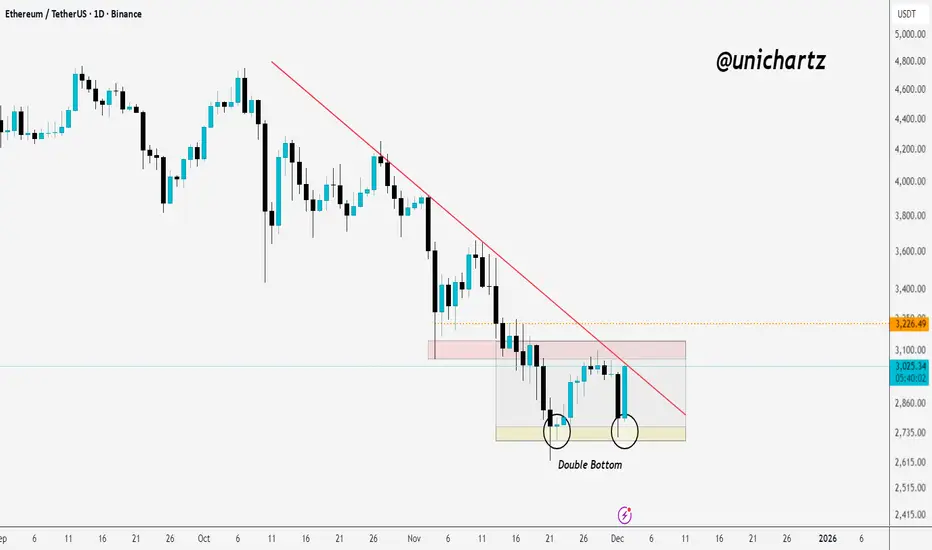
ETH Daily Structure Turning Bullish?CRYPTOCAP:ETH has formed a clear double-bottom pattern on the daily timeframe.
A breakout above the trendline and the consolidation zone would be a strong signal of a potential trend reversal.
Keep an eye on this setup, it could turn bullish quickly if confirmed.
DYOR, NFA
Please hit the like button if you like it, and share your views in the comments section.
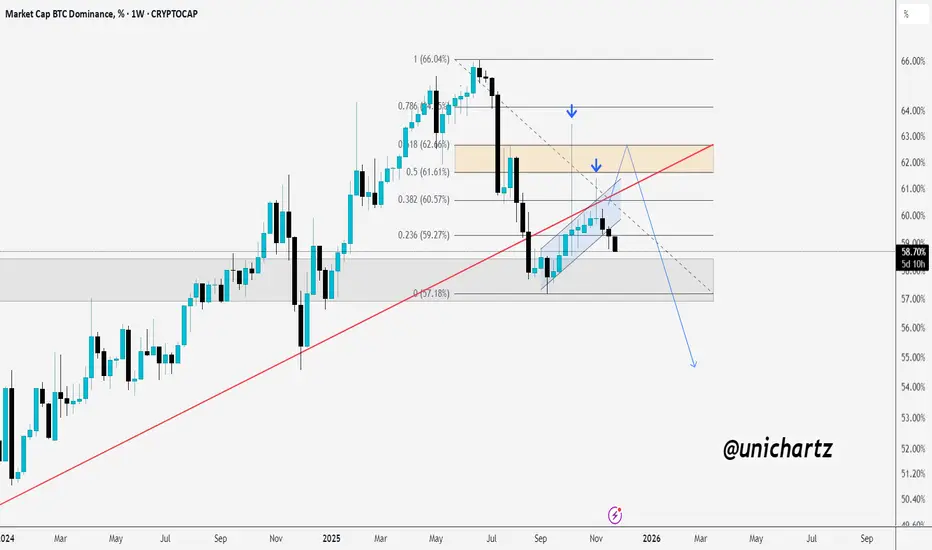
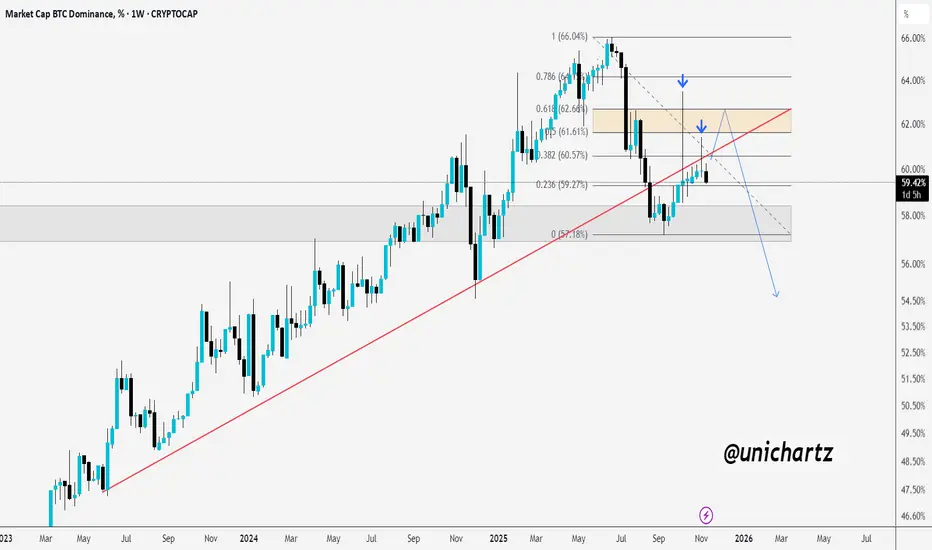
BTC.D Pullback Could Open Doors for AltsBTC dominance has broken below its long-term trendline and is currently holding near the 58–59% support zone, but momentum still appears weak.
The key resistance area sits between 61% and 62.5%, and any retest of this zone may struggle to break higher, especially with its alignment to major Fibonacci levels.
If BTC dominance fails to reclaim this zone with strength, the broader structure points toward continued downside, potentially targeting the 57% level and possibly lower if that support breaks.
A continued decline in dominance would generally favor altcoins, so it’s best to wait for clear confirmation before making any decisions.
DYOR, NFA
Please hit the like button if you like it, and share your views in the comments section.
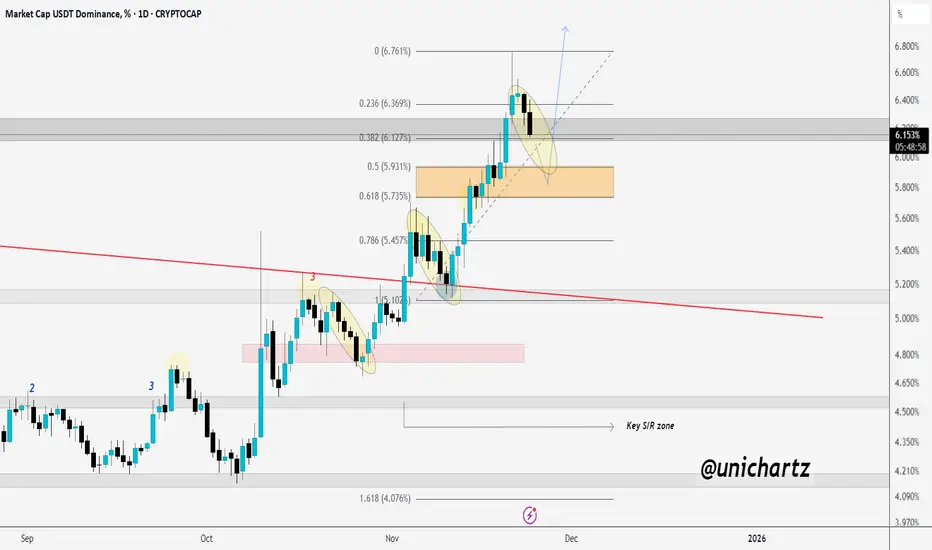
Golden Zone Test: Will USDT.D Extend Higher?USDT.D appears to be retesting the zone after breaking out, and it could push higher since this structure has repeated many times in the past.
The marked golden zone is crucial and will play a key role in determining the next major direction of the market.
DYOR, NFA
ETH Approaching Lower Key Zone If Support FailsCRYPTOCAP:ETH is holding the current support zone after a sharp decline, showing its first signs of slowing down. As long as this zone holds, we could see a short-term bounce or consolidation.
But if this support breaks, price may head toward the lower key zone highlighted on the chart.
For now, this support acts as the main level to watch.
DYOR, NFA

BTC Loses 50 EMA: Can the 10 EMA Hold?#BTC/USDT has slipped below the 50 EMA, which was acting as dynamic support. However, price is now showing a small bounce around the 100 EMA. If Bitcoin manages to hold this level, we could see a healthy rebound from here.
But if it fails to maintain this support, further correction in the coming days becomes likely.
DYOR, NFA
Please hit the like button if you like it, and share your views in the comments section.

BTC Dips Below Key Zone — Is $73K the Next Stop?$BTC/USDT has broken below the support trendline and the key support zone.
The next major support to watch is around the $73K level.
DYOR, NFA

LTC: Don’t FOMO, Wait for Confirmation$LTC/USDT is getting squeezed between the rising trendline and the overhead resistance zone. Price has tested this resistance multiple times before but failed to break through.
A potential upside move could develop if we finally see a clean close above the marked zone.
Until then, it’s best to stay patient, don’t FOMO, wait for a clear breakout pattern.
DYOR, NFA

BTC Slips Below 50 EMA: Caution RequiredThings could get uglier as CRYPTOCAP:BTC has now broken below the 50 EMA, a key long-term dynamic support level.
This breakdown signals growing weakness and may open the door for deeper downside if buyers don’t step in soon.
DYOR, NFA

STRK Finally Escapes the RangeNASDAQ:STRK has finally broken out of its long consolidation zone and pushed above the descending trendline—something the chart hasn’t managed to do for months. This breakout shows a clear shift in momentum, with buyers stepping in strongly.
As long as price holds above this zone, STRK could be gearing up for a continuation move to the upside. The structure looks healthier now, and the breakout suggests the trend may be turning in favor of the bulls.
DYOR, NFA
Please hit the like button if you like it, and share your views in the comments section.

TRB Squeezing Into a Tight RangeLSE:TRB is holding above a key support zone while trading under a long-term downtrend line.
Price is stuck in a narrow consolidation, suggesting a bigger move is building.
A breakout from this range will likely decide the next direction.
DYOR, NFA
Please hit the like button if you like it, and share your views in the comments section.

Altcoins Setting Up?BTC.D just faced a clear rejection from the upper zone, showing that dominance is losing strength. If it breaks below the 57% level, it could open the door for a strong altcoin rally.
Keep an eye on this level, a drop here often sparks powerful moves in the alt market.
DYOR, NFA
If USDT.D Breaks 6.2%, Say Goodbye to AltsUSDT.D is now heading toward a key resistance zone. Until it reaches that level, altcoins could continue to face selling pressure.
If USDT.D breaks and holds above the marked zone, it could signal the start of a broader bearish phase for the market. However, historically, this level has acted as a strong rejection zone, so a pullback from around 6.2% could once again bring relief for altcoins.
Keep a close eye on how dominance reacts here, the next move could decide the short-term trend for the entire market.
DYOR, NFA
