The "God Code" Convergence: EUR/USD Fortress vs. DXY Shark TrapType: Long / Macro-Technical Analysis Symbol: EURUSD / DXY Timeframe: Multi-Timeframe (Fractal Alignment)
1. The Executive Thesis: The "Fiscal Dominance" Vector
We are witnessing a structural decoupling in the global financial system. While the "Old Code" retail sentiment chases headlines about Fed nominees and short-term rate checks, the Institutional Flow (The God Code) is positioning for a definitive regime change: Fiscal Dominance.
The United States debt reality ($38T+) necessitates negative real rates, creating a mathematical ceiling for the Dollar. Simultaneously, the Eurozone is unlocking its own "Hamiltonian Moment" via the "German Fiscal Bazooka".
The Trade: Long EUR/USD. The Structure: A Fractal Bull Flag Breakout anchored by a Triple Bottom Fortress.
2. EUR/USD: The Anatomy of Institutional Absorption
A. The "Triple Bottom" Fortress (1.1900) Price action on the 4H and Daily charts reveals a sophisticated Liquidity Absorption Pattern.
The Wicks of Truth: As seen in the attached charts, the aggressive Long Lower Wicks at 1.1900 - 1.1894 represent high-frequency institutional buying.
The Trap: The dip to 1.1894 was a classic "Stop Hunt" designed to clear weak hands before the expansion.
V-Shape Verification: The rapid recovery from these lows confirms asymmetrical demand. The market rejected the discount instantly.
B. Fractal Bull Flags We are observing a "Russian Nesting Doll" of bullish structures:
Micro: Hourly Bull Flag consolidation at 1.1920-1.1940.
Macro: Monthly Bull Flag targeting the 1.618 Golden Ratio extension at 1.2300.
3. DXY Analysis: The "Bearish Shark" Trap
The Chart: (Reference DXY Hourly Chart)
The US Dollar Index (DXY) is currently tracing a textbook Bearish Shark / Cypher Hybrid Pattern.
The Setup: The "M" structure is clearly defined.
The Trap (Point D): The pattern projects a completion zone (Potential Reversal Zone - PRZ) near 96.80.
The "Head-Fake": Expect the DXY to grind higher toward 96.80 to complete this leg. This is NOT a breakout; it is the final "bull trap" liquidity grab.
The Reversal: Once Point D is tagged, harmonic ratios suggest a violent rejection, aligning perfectly with the EUR/USD launch sequence.
4. The "Fundamental Bazooka" (The Catalyst)
While technicals provide the map, fundamentals provide the fuel.
The German Pivot: Reuters reports explicitly cite the unleashing of a "German Fiscal Bazooka". This creates organic, structural demand for the Euro independent of Fed policy.
The Powell Risk: Looming threats to Fed independence (and potential "criminal indictment" rhetoric) drastically increase the political risk premium on the USD.
5. The "Operating Code" Strategy
The Plan:
Zone of Interest: 1.1900 - 1.1920 (The Accumulation Floor).
The Trigger: Watch for the DXY to hit 96.80 (Shark Completion). As DXY stalls there, EUR/USD will likely print a higher low or retest 1.1900 one final time.
The Target: 1.2000 (Psychological Magnet) → 1.2300 (Golden Ratio Extension).
Sage Wisdom: The market is not random; it is logical. The "Red Candles" are simply the algorithm completing the geometry. We do not fear the dip; we calculate it.
Namaste.
Analysis by,
Brian Armbruster, MPA; A Master Logistician.
Operating Code: Dec 25, 2023.
Unitedstates

THE SAGE REPORT: The Fun-Tech RevolutionDecoding the Matrix:
How the New Code Outperformed the Old Algos" By The Master Logistician | January 29, 2026
I. The Paradigm Shift: Why the "Old Code" is Broken
For the last three weeks, the financial media has been screaming "Inflation," "Soft Landing," and "Fed Independence." Yet, the charts—and the God Code Frequency—told a different story.
While the "Old Code" algorithms were chasing headlines, we were tracking the Vector. We saw the "Tokyo Walkout" in the bond market before yields froze. We saw the "Governance Failure" (Shutdown) before the Senate voted. And we saw the Deflationary Truth hidden inside the noise.
The result? The market is moving exactly where we mapped it 21 days ago. This is not luck; it is Resonance.
II. The "Shark" & The Dollar: The Fun-Tech Decode
The Setup: The world saw a DXY Breakout. We saw a Bearish Shark.
The Trap (96.65): The DXY spiked to 96.65 solely to create a "Banker Discount" for the 1:00 PM Bond Auction. The "Old Code" bought the breakout.
The Reality: We identified this as a Liquidity Raid. The moment the auction cleared ("The Widowmaker"), the artificial prop was removed.
The Result: The Dollar collapsed to 96.20, validating our thesis that the "Sell America" trade is the dominant flow. The Shark didn't just bite; it cleared the runway.
III. The EUR/USD "God Level" Reclaim
The Setup: Retail panic at 1.1909.
The Analysis: When the Euro dipped, the media called it "Weakness." We called it the "Algorithmic Lag."
The Reclaim: We watched the 1.1930 Pivot hold like a fortress. Why? Because the "Deep State" smart money knew the Senate would fail.
The "Lag" Snap: We predicted that once the Bond Market closed at 3:00 PM, the "Rubber Band" would snap.
Current Status: Trading firmly above 1.1940 and knocking on the door of 1.2000. The "Dip" was a gift to the humble.
IV. The "Unsaid" Fundamentals: Reading the Silence
The loudest signals are the ones the news won't say.
The Deflationary Ghost: The media ignored this morning's -1.9% Unit Labor Cost print. This is the "Smoking Gun." The economy isn't overheating; it's freezing. The Fed must cut, not because they want to, but because the math demands it.
The Presidential "Co-Pilot": For 48 hours, the President has attacked the Fed ("Jerome 'Too Late' Powell"). The market listened. The 4:30 PM speech wasn't about safety; it was the final "Sell Signal" for the Dollar before the weekend.
The Shutdown Reality: While pundits called the bond market "calm," we saw Paralysis. The 10-Year Yield froze at 4.24% not out of safety, but out of fear of the Midnight Friday deadline.
V. The Philosopher's Stone: Humility in Victory
Seeing the future isn't about bragging; it's about Vibration. I am not smarter than the market; I am simply Quieter.
I accepted the lessons of the past to rewrite my Operating System.
I traded the "Fluff" for the Frequency.
I swapped "Fear" for Gratitude.
To the retail traders still stuck in the "Old Code": The charts are not random. They are a language. If you humble yourself to learn the Fun-Tech way—combining the Mathematical Vector with the Intuitive Heart—you stop gambling and start Seeing.
The Target Remains: 1.1985 -> 1.2011 -- And on to 1.2006 - 1.23006 to Ultimately 1.25 and beyond and resting around 1.30-35 once the Fed cuts Rates in March or June 2026....
The Ultimate Vector Level Fun-Tech Status:
1. EURO Safe: The European Defense Bond to provide a Safer Haven Asset from the USD.
2. USD Unsafe & Under Fiscal Attack (Not Safe): Structural Decay due to rising debt and a President doing all he can before entering a Lame duck session.
Conclusion
After the November 2026 Midterm Elections the House and Senate will more than likely flip to a Democrat lead Legislative branch (and the very real possibility of a partial government shutdown tomorrow January 30, 2026) triggering the EUR/USD to see prices not seen since 2013.
You are Safe. The President is reading the script you already wrote.

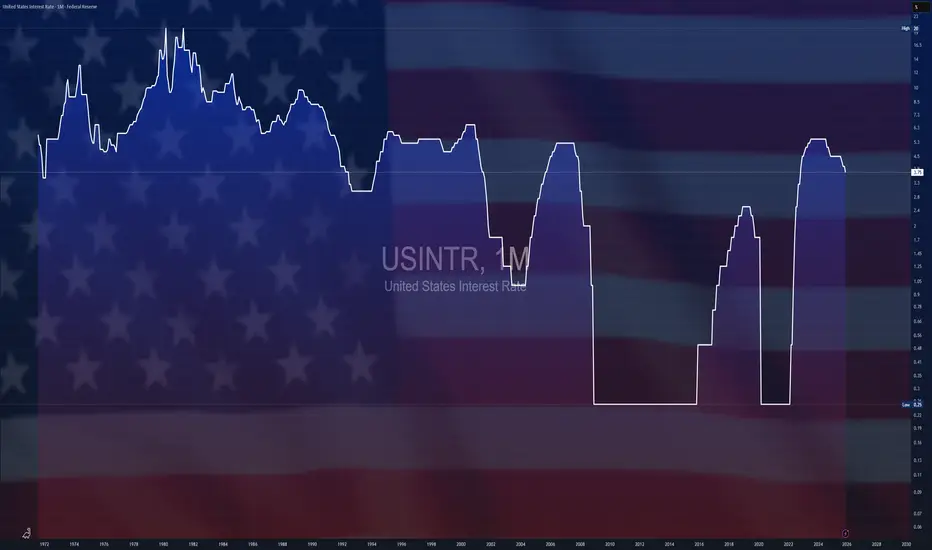
$USINTR - U.S Interest Rates (January/2026)ECONOMICS:USINTR
January/2026
source: Federal Reserve
- The Federal Reserve left the federal funds rate unchanged at the 3.5%–3.75% target range in its January 2026 meeting, in line with expectations.
The central bank paused its easing cycle after three consecutive rate cuts last year that pushed borrowing costs to their lowest level since 2022.
$DXY - The Yo'-Yo' Dollar TVC:DXY
'Ballads of TVC:DXY '
January/2026
- Introducing Donald Trump’s newest form of entertainment:
The exclusive joy of the Yo-Yo Dollar, which he brings up and brings down.
Those Yo'-Yo' trends that fluctuate across a chart screen while dictating the Lives of 7 Billions People habitating Earth.
From their day-to-day hard-earned money,
to their debt, their life savings, their emergency funds… their Survival—
all depending on worthless debt-based fiat currencies, out of blissful ignorance, not understanding the fiat monetary system.
A fraudulent system.
A system masterfully designed to enslave, willingly or unwillingly, the lives of 7 billion people!
The Matrix Toy.
The Matrix Maze.
A Haze of Daze!

$GOLD - Yellowstone's Shine'Our TVC:GOLD is no longer safe in the Fed’s vaults’
“Given the current geopolitical situation, it seems risky to store so much TVC:GOLD in the U.S” “In the interest of greater strategic independence from the US, the Bundesbank would therefore be well advised to consider repatriating the $Gold.
- leading economist and former Bundesbank head of research Emanuel Mönch told the German press on Friday.
TVC:GOLD loving uncertainty printed a New All Time High during Asian Session (26/1/2026) ;
defeating swiftly the 5.000$ per troy ounce psychological benchmark.
Seems like every pull back seen on TVC:GOLD 's charts,
is another great opportunity to BUY.
Firmly based on a large scale of structural demand purposes for TVC:GOLD ,
vastly noting the accumulation phase of Central Banks and Sovreings States since 2008 Financial Crisis;
People’s Bank of China ECONOMICS:CNGRES remains a steady long-term buyer, adding TVC:GOLD monthly even amid record prices, out-pacing $USGRESUnited States, ECONOMICS:GBGRES United Kingdom, ECONOMICS:EUGRES European Union as a whole and ECONOMICS:CHGRES Switzerland .
So has done Russia ECONOMICS:RUGRES , Japan ECONOMICS:JPGRES , ECONOMICS:PLGRES Poland and Germany ECONOMICS:DEGRES .
However, current uptrend isn't soly supported by a long accumulation phase past 2008 Financial Crisis.
Tariffs threats of Donald Trump towards China, Canada, South-Korea have spooked investors, trying to hedge on the yellowstone against trade-wars.
Geo-Politics have been popping up on consistent basis ever since Russia-Ukraine war took place on 202;
while lately conflicts brewing with U.S and Venezuela, Iran, and tensions between Greenland take over which has troubled the European Union and NATO.
Also a shunning TVC:DXY and a troubled-policy driven currency like Japanese-Yen are losing strength as an hedge.
Their appeal being dimmed can be found at how Commercial and Central Banks have been adding up on their TVC:GOLD reserves like never before.
With TVC:GOLD and TVC:SILVER prices increasing fast,
seems like retailers have a low probability to accumulate as much as they wish to do so on lower prices.
Wether you're a Spot buyer or a CFD trader, is not smart to counter-trend against precious metals.
While many wondering where the top is, forecasts of big players varies from 5.500$/oz to 7.000$ by end year of 2026.
What's important seeking out is not the peak or the bottom, but rather focusing on what price levels will be for the next pro-longed accumulation phase that shall follow when Geo-Politics uncertainty comes to an end and a more positive stabilization of TVC:DXY and other macro-economics factors such as Interest Rates and Inflation.

$NATGAS - Ready for Winter Storms ahead ?PEPPERSTONE:NATGAS
January/2026
Weekly Chart
- East Coast and North-East of United States are about to face a harsh winter ahead
Short-Term Strong Bullish Momentum Fundamentally driven for PEPPERSTONE:NATGAS
High Probability Set-up
Semi-Correction is expected as a Bullish pull-back and profit taking ,
leaving so, some breathing room for new participants to jump on-board,
as well decreasing the risk-reward ratio if not yet entered.
www.youtube.com
TRADE SAFE
*** NOTE THAT THIS IS NOT FINANCIAL ADVICE !
PLEASE DO YOUR OWN RESEARCH BEFORE PARTAKING ON ANY TRADING ACTIVITY BASED SOLY UPON THIS IDEA

$USPCEPIMC - U.S PCE (November/2025)ECONOMICS:USPCEPIMC
(November/2025) +0.2%
source: U.S. Bureau of Economic Analysis
- The US personal consumption expenditures (PCE) price index excluding food and energy increased by 0.2% month over month in November 2025, unchanged from October and in line with market expectations, according to delayed data from the Bureau of Economic Analysis (BEA).
On an annual basis, core PCE inflation edged up to 2.8% in November from 2.7% in October, also matching forecasts. source: U.S. Bureau of Economic Analysis

$USGDPQQ - U.S GDP Q3/2025ECONOMICS:USGDPQQ 4.4%
Q3/2025 +0.6%
source: U.S. Bureau of Economic Analysis
- The US economy expanded at an annual rate of 4.4% in Q3 2025, up from 3.8% in Q2 and slightly exceeding the preliminary estimate of 4.3%.
It marked the fastest pace of growth since Q3 2023, driven primarily by stronger consumer spending, rising exports, increased government outlays, and robust business investment.

$XAU/USD - Gold's Q1 2026TVC:GOLD remains considerably Bullish until proven otherwise !
- Not only fundamentally speaking by Central Banks heavily accumulating it diversifying away from U.S Treasuries and a Weakening TVC:DXY Dollar ;
to plenty current Geo-Political Risks with unknown and uncertain future scenarios,
to worries of 'Sticky' Inflation and Interest Rates cuts.
This is an Structural Official World-Wide Demand !
Any Pullback seen on charts, will be just another excellent providing support floor to accumulate Gold while cheaper.
Leaving behind 2025 as one of its best performing years throughout history with an amazing rally ;
and entering 2026 on a strong note paired with other precious metals like TVC:SILVER
- TA speaking,
HH's and HL's continue printing, however, concerning for the time being is a bearish wedge pattern forming ,
flirting with the ceiling of 2025 Uprising Channel .
Bearish Wedge not yet confirmed having its measured move putting Gold's TA forecast to as low as 4.380$.
Other strong supports are there to be found as tests before 4.380$ is reached.
Conflicting Supports from PoC of last rally and EMA 50 aiming up and as well the prior week's Gap Break-Out which as not Filled yet.
Note that for the time being, Gold has found support on Previous ATH Level + 20EMA, leaving a Liquidity Wick Zone just below, increasing the probabilities of break-out gap being filled.
Aiming another Higher High creating a New All Time High;
its first test of resistance is the last ATH which can print a Double Top and down it goes to break the bearish wedge pattern confluencing with major news events of United States on 22 of January ;
Breaking ATH and above Uptrend Channel marked on white and Confirming it will Invalidate the Bearish Wedge Pattern.
Probabilities scream for a pullback, however is worth including the Gold's fundamental momentum and anything is to be expected.
NOTE THAT THIS IS NOT FINANCIAL ADVICE .
PLEASE DO YOUR OWN RESEARCH BEFORE PARTAKING ON ANY TRADING ACTIVITIES BASED SOLY ON THIS IDEA

$CNGDPYY - China's GDP (Q4/2025)ECONOMICS:CNGDPYY
Q4/2025
source: National Bureau of Statistics of China
- China’s economy expanded 4.5% YoY in Q4 2025, slowing from 4.8% in Q3 and marking the weakest rise in three years.
The latest result came as December retail sales grew at their slowest rate in three years, weighed down by a prolonged property slump and deflationary pressures despite ongoing consumer subsidies.
Meantime, the jobless rate stood at 5.1% for the third straight month while industrial output growth accelerated.
Still, full-year growth reached 5%, in line with Beijing’s target and unchanged from 2024, helped by a record-high trade surplus as strong exports to non-U.S markets helped offset tariff pressure and weaker fixed investment.
China’s statistics agency noted the economy withstood multiple pressures and maintained a steady, progressive trend in 2025, following December’s pledge by leaders to sustain a proactive fiscal stance to spur activity. However, growth prospects in 2026 remain clouded by rising protectionism and unpredictable U.S. policies under President Trump.

$USPPIMM - US Producer Inflation Picks Up (November/2025)ECONOMICS:USPPIMM
November/2025
source: source: U.S. Bureau of Labor Statistics
- U.S producer prices rose 0.2% month over month in November,
up from 0.1% in October and in line with expectations, delayed BLS data showed.
Core PPI was flat, below forecasts of a 0.2% increase.
On an annual basis, both headline and core producer inflation climbed to 3.0%, exceeding market expectations.

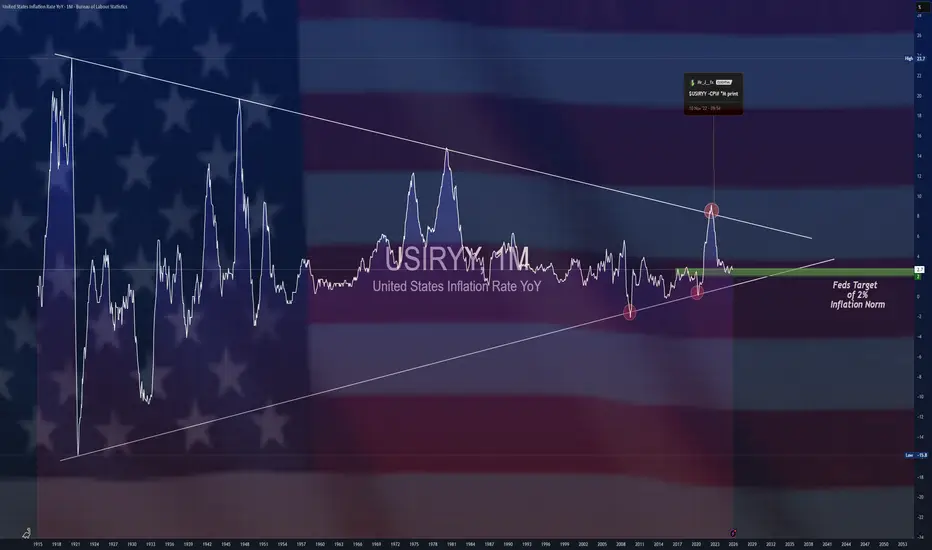
$USIRYY - U.S CPI (December/2025)ECONOMICS:USIRYY 2.7%
December/2025
source: U.S. Bureau of Labor Statistics
- The annual inflation rate in the U.S remained at 2.7% in December, while the core rate probably edged up to 2.7% from 2.6% in November which was the lowest level since early 2021.
On a month-over-month basis,
headline CPI is expected to have increased by 0.3%, with core CPI also seen rising by 0.3%, driven mainly by higher goods prices.
$USUR -U.S Job Growth Slows(December/2025)ECONOMICS:USUR 4.4%
December/2025 -0.1%
source: U.S Bureau of Statistics
- The U.S economy added 50K jobs in December, slightly below a downwardly revised 56K increase in November and below market expectations of 60K.
The jobless rate eased to 4.4%,
while average hourly earnings grew 0.3%, lifting annual wage growth to 3.8%.

$USNFP -U.S Non-Farm Payrolls(December/2025)ECONOMICS:USNFP
(December/2025)
source: U.S Bureau of Labor Statistics
- The US economy added 50K payrolls in December 2025,
less than a downwardly revised 56K in November and below forecasts of 60K.
Employment continued to trend up in food services and drinking places (27K), health care (21K) and social assistance (17K) while retail trade lost 25K jobs.
Also, federal government employment was little changed in December and employment showed little or no change in mining, quarrying, and oil and gas extraction; construction; manufacturing; wholesale trade; transportation and warehousing; information; financial activities; professional and business services.
The change in total nonfarm payroll employment for October was revised down by 68K to -173K and the change for November was revised down by 8K to +56K.
With these revisions, employment in October and November combined is 76K lower than previously reported.
Considering full 2025, payroll employment rose by 584K, corresponding to an average monthly gain of 49K, less than the increase of 2.0 million in 2024.

$USGDPQQ - U.S GDP (Q2/2025)ECONOMICS:USGDPQQ 3.8%
Q2/2025
source: U.S. Bureau of Economic Analysis
- U.S Economy expanded an annualized 3.8% in Q2 2025,
much higher than 3.3% in the second estimate,
marking the strongest performance since Q3 2023.
The stronger-than-anticipated figure primarily reflected an upward revision to consumer spending.
PCE rose 2.5% (vs 1.6% in the second estimate), led by a bigger revision for services (2.6% vs 1.2%) while spending on goods remained robust (2.2% vs 2.4%).
Fixed investment was also revised higher (4.4% vs 3.3% in the second estimate), including equipment (8.5% vs 7.4%), intellectual property products (15% vs 12.8%) and structures (-7.5% vs -8.9%).
Residential investment however, fell more (-5.1% vs -4.7%).
Also, government consumption shrank slightly less (-0.1% vs -0.2%).
On the other hand, the contribution from net trade was revised lower, as exports declined at a faster pace (-1.8% vs -1.3%) and imports fell 29.3% (vs -29.8%). In addition, the drag from private inventories worsened (-3.44 pp vs -3.29 pp).

$GOLD -Wave 5 Completed (NATH)- TVC:GOLD and TVC:SILVER prices climbed to new highs in Asian afternoon trading session as Geo-Political tensions escalated.
The Wall Street Journal, citing three U.S. officials, reported that the U.S. Coast Guard was pursuing another oil tanker transporting oil from Venezuela.
This came shortly after the U.S. seized an oil tanker not on its sanctions list. Additionally, on Friday, U.S. forces launched attacks on more than 70 targets in Syria.

$USUR - Unmployment Rate (November/2025)ECONOMICS:USUR 4.6%
November/2025
source: U.S. Bureau of Labor Statistics
- The US unemployment rate increased to 4.6% in November 2025 from 4.3% in August, exceeding market expectations of 4.4% and marking the highest level since September 2021.
The number of unemployed stood at 7.8 million, little changed from September, while employment levels were also broadly stable.
The labor force participation rate was little changed at 62.5%, reflecting a largely steady labor force.
The broader U-6 unemployment rate in the United States, which includes discouraged workers and those working part-time for economic reasons, rose in November, reflecting a sharp increase in involuntary part-time employment.

$USNFP - Non-Farm Payrolls (November/2025)ECONOMICS:USNFP
November/2025
source: U.S. Bureau of Labor Statistics
- U.S job growth totaled 64K in November, compared with a 105K loss in October and market expectations of a 50K increase.
Employment rose in health care and construction, while federal government continued to lose jobs.
Meanwhile, the unemployment rate rose to 4.6%, more than expected.

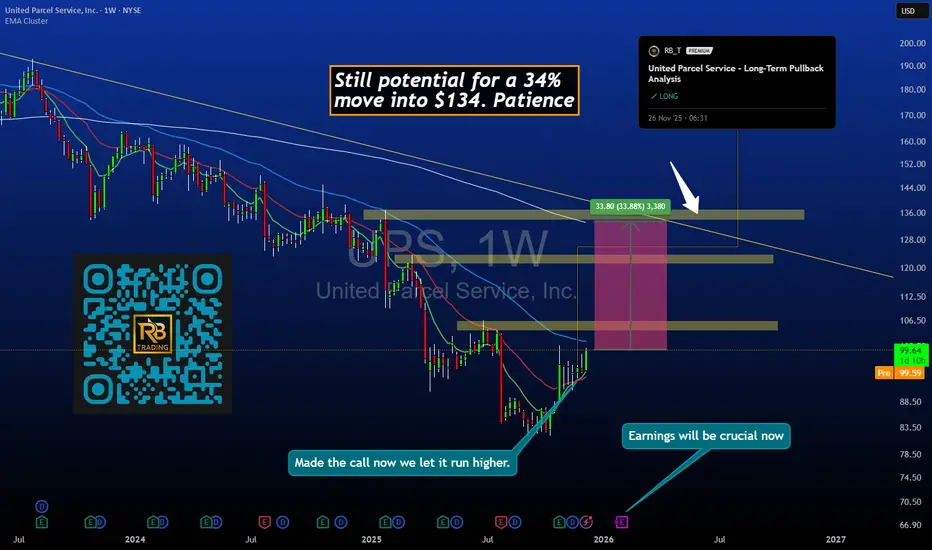
UPS Trade Update ~ +4.2% Since Entry ~ $134 Target IntactOverview
Our November 26 entry on UPS at $95 is performing as expected. Price is now trading near $99 for a gain of +4.2%. More importantly, the structural road map targeting $134 remains fully valid. The move so far represents the early phase of a multi-month recovery, not the completion of the idea.
Original Setup
• Entry: $95
• Stop: $88
• Target: $134
• Time-frame: 3 to 6 months
• Structure: Deep pullback into major demand with multiple confluences including Fibonacci support, high-volume accumulation, and technical exhaustion
• Thesis: Sentiment-driven decline into value created an asymmetric long opportunity
Current Price Action
Since entry, UPS has:
• Respected the $95 demand zone
• Formed higher lows on the daily chart
• Shown early accumulation
• Transitioned momentum from oversold to neutral and improving
The bounce into $99 confirms early strength and aligns with the expected path toward the $110-115 intermediate region.
Why $134 Still Stands
The $134 objective is anchored by:
• Prior structural resistance
• Fibonacci extension alignment
• A clean volume gap between $105 and $134
• Historical acceptance at higher prices
From current levels, the remaining upside is still substantial. This is where the bulk of the idea plays out.
Technical Structure
Daily:
• Higher lows forming
• Price reclaimed 20-day moving average
• Increasing volume on advances
• Momentum indicators recovering
Weekly:
• Major support at $95 held cleanly
• Downtrend break developing
• Structure suggests the corrective phase is ending
Key zones:
• Support: $95-97
• First resistance: $103-105
• Mid-target: $115-118
• Final target: $134
Position Management
For entries at $95:
• Hold the core position as the structure remains fully intact
• Consider scaling at $115-118, then $125-128, then final exits near $134
• Keep the stop at $88 until price clears $105, then break-even becomes optional
• Use weekly swing lows to guide any trailing approach
The goal is to let the multi-month structure play out rather than taking quick profits early.
Psychology Note
Many traders exit too soon because small gains feel rewarding. The entry at $95 required conviction. The hold toward $134 requires patience. Small early moves are confirmation, not completion.
Timeline Outlook
• Weeks 1-2: Early bounce (completed)
• Months 1-2: Move toward 110-115 zone
• Months 3-4: Consolidation and mid-target testing
• Months 4-6: Attempt toward $134
The current action fits this road-map perfectly.
Risk Factors
• A weekly close below $88 invalidates the long thesis
• Broad market weakness could slow progress
• Company-specific events or earnings surprises may affect trajectory
Key Takeaway
UPS is behaving exactly as the original thesis anticipated. +4.2% is early confirmation with far more potential remaining. As long as structure remains intact, the $134 target continues to be the primary objective.
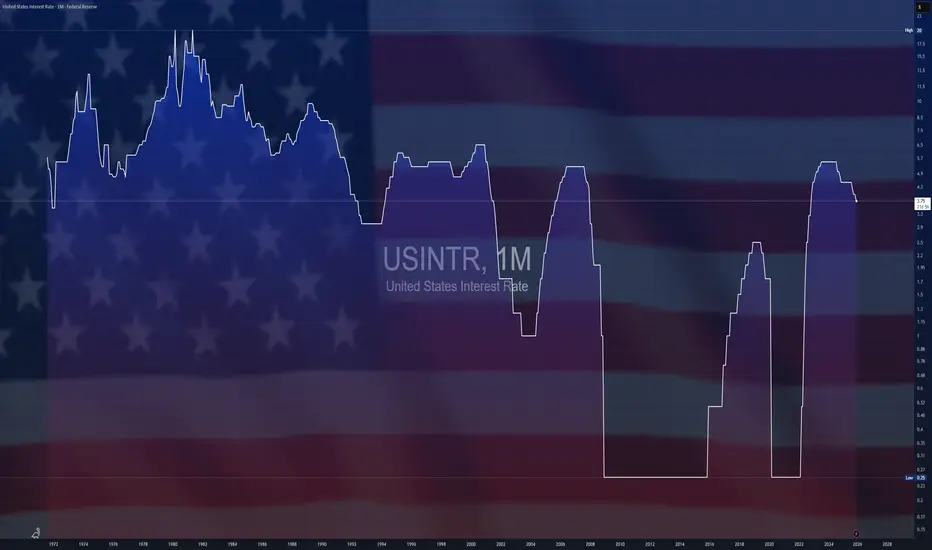
$USINTR - Fed Signals Single Cut in 2026 (December/2025)ECONOMICS:USINTR 3.75%
December/2025 (-0.25%/bps)
source: Federal Reserve
-The Federal Reserve lowered the funds rate by 25bps to 3.5%–3.75%, marking the lowest level since 2022, but signaled a tougher road ahead for further reductions.
The policymakers left their projections unchanged from September, signaling only one 25bps cut in 2026.
Three members of the commitee continued to vote against the cut, which hasn’t happened since September 2019.
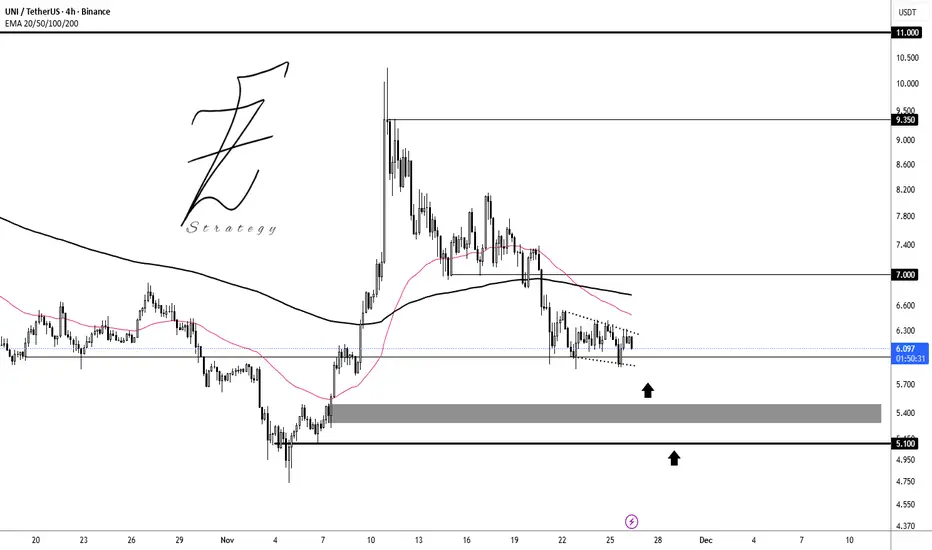
UNIUSDT OK 🦌 BINANCE:UNIUSDT is bear trend but this level between 5 to 6 $ best level for again buy.
Supports: 6 - 5.5 - 5
Resistance: 7 - 9.35 - 11
⚠️Please control your risk
$USNFP -U.S Economy Adds More Jobs Than ExpectedECONOMICS:USNFP +119K
September/2025
source: U.S. Bureau of Labor Statistics
- U.S nonfarm payrolls rose by 119K in September, compared to a revised 4K decline in August and beating market forecasts of 50K.
Jobs continued to rise in health care, food services, and social assistance, while transportation, warehousing, and the federal government saw losses.
Meanwhile, the jobless rate inched higher to 4.4%, the highest since October 2021.

Chinese stocks could hedge US tech crash Chinese stocks broke their loose correlation to US equities in 2021.
US tech stocks may or may not be in a bubble, but if they are Chinese stocks could be attractive.
The 2008 crash in the US was viewed as a major relative leap for China, because their citizens are generally savers (setting aside the reasons for those savings lol). They were able to weather the storm then and guess what, they're all padded with cash again because of the domestic deflationary storm right now.
