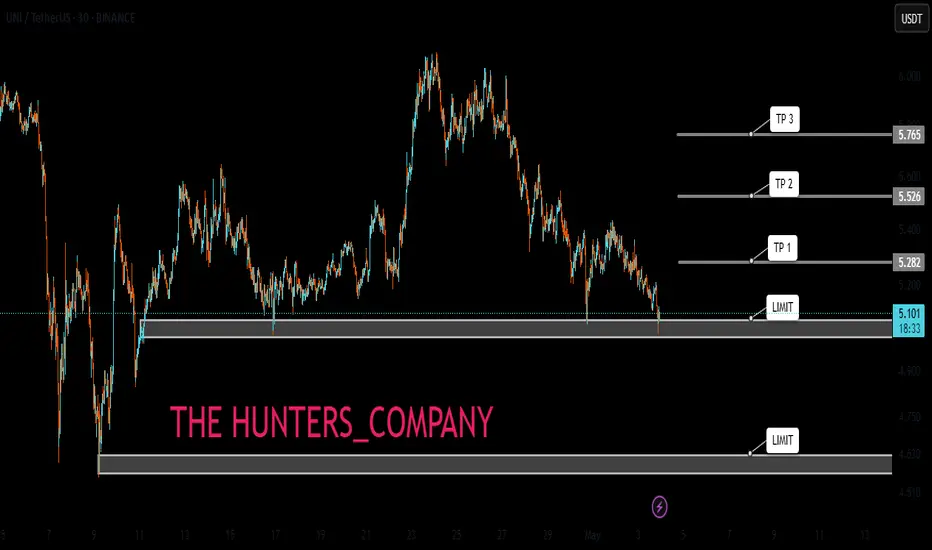
#UNI/USDT Forming Bullish Continuation#UNI
The price is moving within a descending channel on the hourly timeframe. It has reached the upper boundary and is heading towards breaking it. A retest of this boundary is expected.
The Relative Strength Index (RSI) is showing an upward trend, as it has approached the upper boundary. A bearish reversal is expected.
There is a key support zone in green at 5.10. The price has bounced from this zone several times and is expected to bounce again.
A consolidation trend is observed above the 100-period moving average, which we are approaching. This trend supports a decline towards this level.
Entry Price: 5.36
Target 1: 5.40
Target 2: 5.60
Target 3: 5.79
Stop Loss: Above the green support zone.
Remember this simple thing: Money management.
For any questions, please leave a comment.
Thank you.
UNIUSD

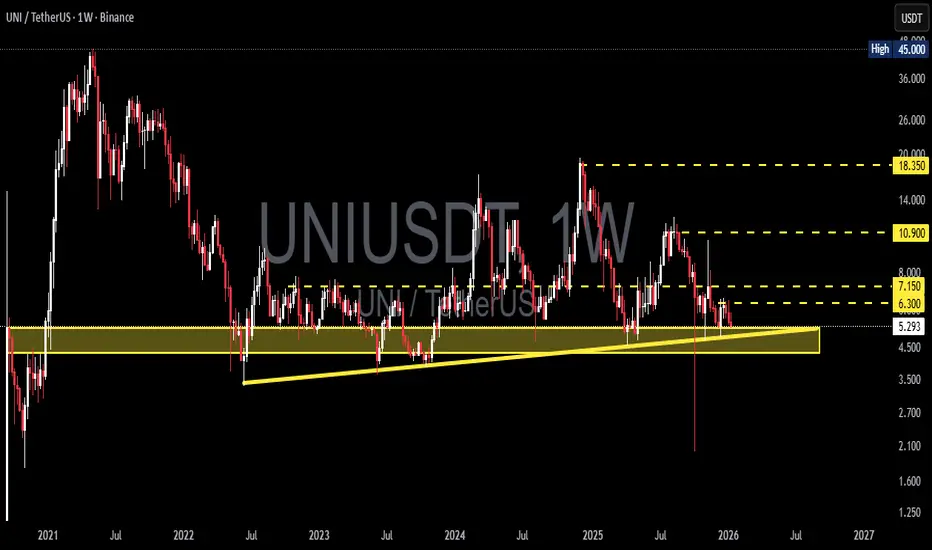
UNI/USDT at Critical Support — Accumulation or Breakdown?UNI/USDT is currently trading on the Weekly (1W) timeframe and remains within a broad range following a prolonged downtrend from its historical peak. Price has returned to test a key demand zone (yellow box 5.2 – 4.3), which has acted as a strong historical support since 2022.
The current market structure reflects compression and re-accumulation, indicating that UNI is positioned at a critical decision area for medium- to long-term price direction.
---
Key Levels & Zones
Major Demand / Accumulation Zone: 5.2 – 4.3 (yellow zone – critical support)
Intermediate Resistance: 6.3 – 7.15
Major Resistance: 10.9
Upper Resistance / Bullish Target: 18.35
ATH Reference: 45.00
---
Pattern & Structure Explanation
1. Ascending Support Trendline (Weekly)
A clear rising trendline can be observed from the 2022 → 2023 → 2024 lows. Price is still holding above this trendline, keeping the higher-low structure intact.
2. Range Accumulation (Wyckoff-like Structure)
Since 2023, price has been moving sideways within a broad range. The yellow zone acts as a Spring / Last Point of Support (LPS).
3. Long Wick Rejection
Strong lower-wick rejections indicate active buyers defending the demand zone.
---
Bullish Scenario
As long as price holds above the 5.2 – 4.3 zone, the bullish scenario remains valid.
Bullish confirmation strengthens if:
Weekly close holds above 5.2
Break and close above 6.3 – 7.15
Bullish Targets:
1. 7.15 (minor range high)
2. 10.90 (major resistance)
3. 18.35 (upper range / supply zone)
A breakout above 10.9 could shift the structure into a macro bullish continuation.
---
Bearish Scenario
The bearish scenario activates if:
A strong weekly close below 4.3
Breakdown of the ascending support trendline
Bearish implications:
Higher-low structure fails
Potential continuation toward 3.5 – 3.0
In extreme conditions, a revisit of 2.0 – 2.5
A breakdown of the yellow zone would signal failed accumulation and bearish continuation.
---
Conclusion
UNI/USDT is currently trading at a major long-term decision zone.
The 5.2 – 4.3 area remains the key level to watch:
Holding the zone → potential reversal and upside expansion
Losing the zone → bearish continuation
The market has not yet confirmed direction, making weekly candle confirmation critical before taking aggressive positions.
#UNIUSDT #UNISWAP #CryptoAnalysis #WeeklyChart #AccumulationZone #DemandZone #SupportResistance #AltcoinAnalysis
#UNI/USDT Forming Bullish Continuation#UNI
The price is moving in a descending channel on the 1-hour timeframe. It has reached the lower boundary and is heading towards a breakout, with a retest of the upper boundary expected.
We are seeing a bearish bias in the Relative Strength Index (RSI), which has reached near the lower boundary, and an upward bounce is expected.
There is a key support zone in green at 5.58, and the price has bounced from this level several times. Another bounce is expected.
We are seeing a trend towards stabilizing above the 100-period moving average, which we are approaching, supporting the upward trend.
Entry Price: 5.73
First Target: 5.90
Second Target: 6.12
Third Target: 6.36
Place your stop-loss order below the green support zone.
Remember a simple principle: Money Management.
For any questions, please leave a comment.
Thank you.

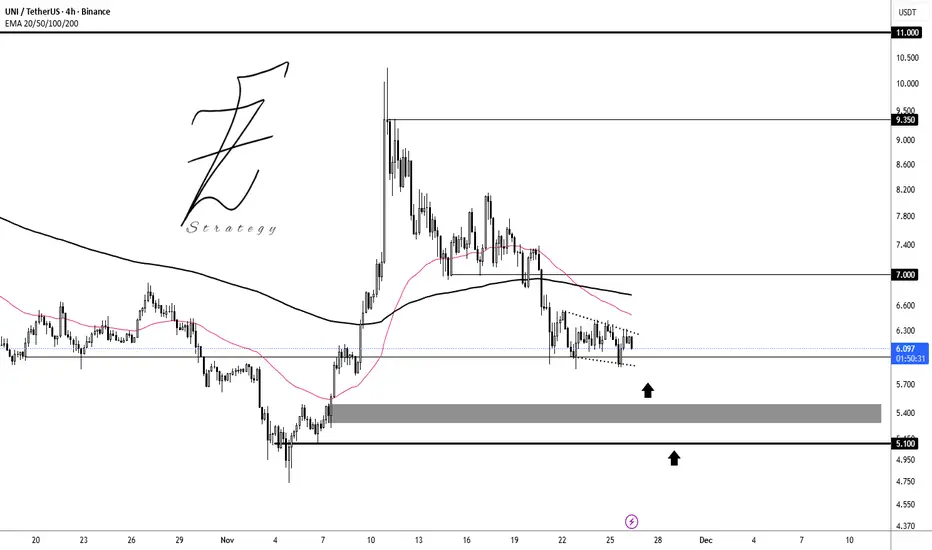
UNI Analysis (4H)A trigger line has been broken on the chart. We have a bullish CH, and a Three Drive pattern is also visible at the bottom. These patterns usually push price upward toward the nearest supply zone. Price has been fueled from a strong origin, suggesting sufficient buy-side orders.
We currently have two re-buy entry points. If price pulls back to the downside, we can enter the position using a DCA approach.
The targets are marked on the chart.
Please note: if price reaches our entry zones before touching the red supply zone, we will enter the position. However, if price first reaches the supply zone and then returns to our entry area, we will not enter.
A daily candle close below the invalidation level will invalidate this analysis.
For risk management, please don't forget stop loss and capital management
When we reach the first target, save some profit and then change the stop to entry
Comment if you have any questions
Thank You

FireHoseReel | Uniswap Is Approaching a Market Decision Zone🔥 Welcome To FireHoseReel !
Let’s jump into Uni Swap (UNI) market analysis.
👀 UNI 4H Overview
UNI is currently trading inside a range box, with resistance at $5.858 and support at $5.445.
A breakout from either side can lead to a major move. Looking at the chart history, every strong upside move has been followed by a deep correction, yet the impulses themselves have been very sharp and aggressive.
📊 Volume Analysis
UNI volume on Binance is currently not very strong, so clear confirmation is still missing.
However, when UNI starts printing high volume on Binance as well, it signals increased trader attention.
A rise in volume would be a logical confirmation for the next price move.
✍️ UNI Trading Scenarios
🟢 Long Scenario:
A breakout above $5.858 can activate our long trigger, but this setup requires a clear increase in buying volume for confirmation.
🔴 Short Scenario:
A breakdown below the $5.44 support can push price toward the next demand zone.
This move should be confirmed with a strong rise in selling volume, making it a valid short opportunity.
🧠 Protect your capital first. No setup is worth blowing your account. If risk isn’t controlled, profit means nothing. Trade with rules, not emotions.

UNIUSDT OK 🦌 BINANCE:UNIUSDT is bear trend but this level between 5 to 6 $ best level for again buy.
Supports: 6 - 5.5 - 5
Resistance: 7 - 9.35 - 11
⚠️Please control your risk
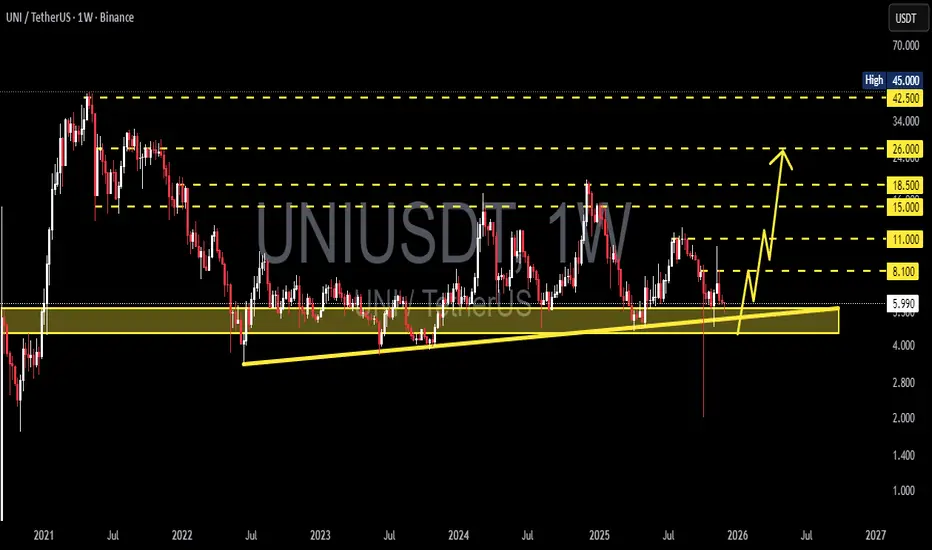
UNI/USDT — The Decision Zone: A Major Rebound or Full Breakdown?UNI is now sitting at the most critical level since 2022.
Price has returned to the golden support zone at 5.7–4.5, an area that has repeatedly acted as the final defense before massive moves — either explosive rallies or deep capitulation.
The weekly structure reveals one thing clearly:
The market is testing long-term investor conviction.
---
🔶 Market Structure & Dominant Pattern
UNI has been forming a multi-year accumulation range, with a remarkably consistent base at 5.7–4.5.
An ascending base formation has slowly taken shape from 2022 to 2025, showing subtle higher lows.
Price action here will determine whether this structure becomes:
Re-accumulation before a new uptrend, or
Distribution before a major breakdown.
This zone is not just support —
it is a liquidity battlefield where large buyers and market makers typically operate.
---
🟩 Bullish Scenario — If 5.7–4.5 Holds
If UNI shows strong weekly rejection from this zone:
1. Expect a bullish reversal candle (pin bar / long wick) confirming buyer aggression.
2. First target: 8.1 — the initial key resistance.
3. If momentum continues, price could expand toward
11 → 15 → 18.5.
4. A clean break above 15 usually signals the beginning of a mid-term expansion phase.
This is the scenario where UNI reclaims strength as one of the main DeFi assets.
---
🟥 Bearish Scenario — If 4.5 Breaks
A weekly close below 4.5 would be a major structural failure:
The multi-year accumulation pattern becomes invalid.
Market likely enters a capitulation phase.
Downside targets would shift to:
3.0
And potentially 2.0 if selling accelerates.
This scenario only unfolds if investors completely abandon the support zone.
---
🔍 Why the 5.7–4.5 Zone Is Critical
Almost every UNI rally since 2022 has started from this box.
Massive liquidity sits here: stop-loss clusters, limit orders, and margin liquidations.
Historical wicks repeatedly show aggressive buybacks from this region.
Market makers tend to accumulate here before large directional moves.
Simply put:
If UNI is going to launch a new uptrend, this is the most strategic zone to do it.
---
🧭 Bottom Line
UNI is in a make-or-break phase.
Holding above 5.7–4.5 opens a pathway toward 11–18.
Breaking below 4.5 sets the stage for a deeper bearish continuation.
This chart has no middle ground —
The next weekly closing will define UNI’s trajectory for 2025.
---
🔖 Hashtags for TradingView
#UNI #UNIUSDT #Uniswap #CryptoAnalysis #WeeklyChart #SupportZone #BreakoutOrBreakdown #BullishScenario #BearishScenario #CryptoMarket
UNIUSDT Better Long Setups Coming...Patience PaysI'm seeing a lot of bullish setups and decided to give me two cents.
Current UNI/USDT price action is raising a red flag for potential long entries. History shows this specific Rate of Change (ROC) zone has often marked a local top.
Historic ROC Overbought: Every time the price has pushed into this ROC zone in the past, it quickly resulted in a break of the bullish market structure. Followed by a corrective move down toward the support/accumulation zone. We are seeing that pattern play as of right now.
Balance Volume (OBV) indicator trendline has been broken. This confirms that buying volume is no longer supporting the price momentum.
This is not a good spot for a buy signal.
I personally would wait for the test of the support zone then look for buy. Then we can aim for our potential targets.
Good Luck!

#UNI --- Uniswap to soar back into the 20'sAs a brand
how do u compete with a leader
Uniswap being the leader of on-chain exchange
Coke is the brand to invest in
(what stock did Buffet buy?)
not Pepsi
not RC cola
Do you get where I'm coming from
And I am not getting into to who, what or how
they have been infiltrated
but clearly they have
As an investor
you MUST pick the best of breed
That has historically been the best route to success.
UNI to rip is my prediction

UNI SWAPHello friends
As you know and the news has spread, UNI has grown well, which indicates the arrival of buyers.
Now that the price is correcting, we have two scenarios:
The first scenario is that the price breaks the specified channel from here and moves to the specified targets.
The second scenario is that the price corrects further, which is also better because you can buy at lower prices.
Please note that our suggestion is to buy a ladder with capital and risk management and be careful to observe capital management and not act emotionally.
*Trade safely with us*

UNIUSDT - The Best Going to Retest!The coin skyrocketed 45% in a single daily candle right after breaking out of the red rectangle.
That rectangle represents a major support zone on the chart — so as long as it’s pulling back, it’s likely just retesting that zone before starting a new bullish leg upward.
This area lines up with the 0.618 Fibonacci level, plus both the 25 EMA and 50 EMA, which are getting ready to form a golden cross, and it also matches the descending trendline.
⚠️ Caution with futures trading though — market makers can easily play psychological tricks around this exact zone
Best Regards:
Ceciliones🎯

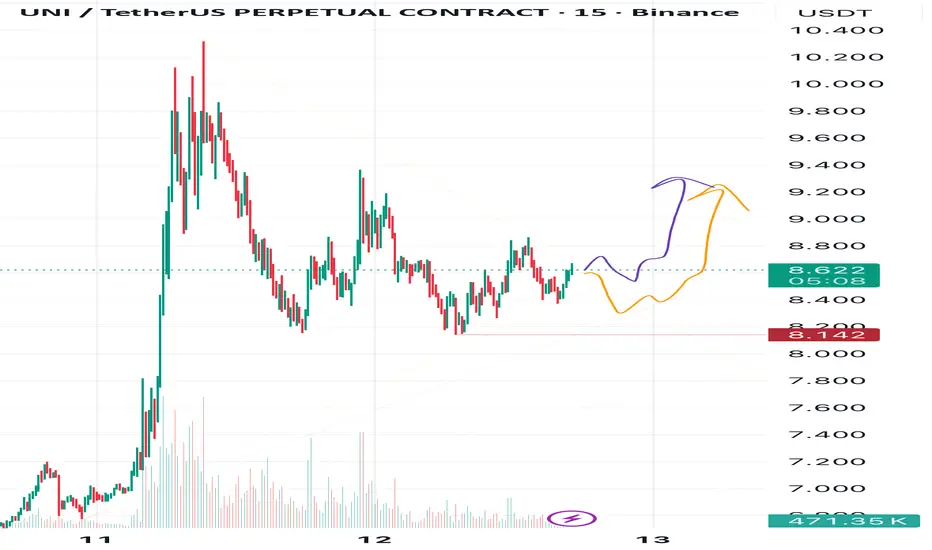
UNI Rising Soon — Triangle in TuneThe situation in UNI right now looks almost identical to what I recently showed in my post about NEAR.
We’re seeing a corrective triangle, and a breakout to the upside seems likely.
As always, I see two possible scenarios — shown by the orange and purple arrows on my chart.
🎯 Targets:
• Target 1: 9.000
• Target 2: 9.400
• Target 3: 10.000
For now, my main focus remains on Target 1, since we’re still in a corrective phase.
❌ Invalidation zone: 8.142
⚠️ Disclaimer:
This is not a financial signal, just my personal view of the market.
Trade according to your own risk management, and never trade without stop-losses.
💬 Drop your comments and reactions below — and hit follow if you’d like me to keep sharing regular updates and forecasts on UNI!
UNIUSDT — at Golden Zone: Major Reversal or the Final Breakdown?Main Narrative
UNI is currently trading at one of the most decisive levels in its entire price history — the $4.0–$5.0 zone, a multi-year fortress of demand that has repeatedly triggered strong rebounds since 2021.
Each time price entered this zone, buyers stepped in aggressively. However, this time the structure looks different — lower highs have been forming consistently, indicating sustained selling pressure.
This is a make-or-break moment for UNI: either it defends this golden zone and starts a new uptrend, or it breaks down into uncharted territory.
---
Technical Analysis
Timeframe: Weekly (mid-to-long-term structure).
Current price: Around $6.39, sitting just above the critical golden zone.
Key levels:
Support zone: $4.0–$5.0 → major historical accumulation area since 2021–2024.
Resistance levels: $8.77 → $11.04 → $14.31 → $18.33 → $26.41 → $42.82.
All-Time High: $45.00.
Price structure:
Continuous lower highs since early 2024, showing sustained bearish control.
Price is moving within a multi-year accumulation range roughly between $4 and $18 — forming a type of megaphone compression that’s nearing its resolution point.
Notice the long lower wick below the current range — a clear liquidity sweep or stop-hunt, often a precursor to trend reversals.
Main pattern formation:
Descending structure (lower highs) → bearish compression.
Potential double bottom / spring setup → if a bullish candle forms in this zone, a macro reversal may begin.
Long-term accumulation range → suggests the market is building energy for a large move soon.
---
Bullish Scenario
Major Reversal Setup (Reclaim from the Golden Zone)
If UNI holds the $4.0–$5.0 zone and forms a strong bullish weekly candle, key upside targets are:
Target 1: $8.77 (first major resistance reclaim)
Target 2: $11.04
Target 3: $14.31
Extended target: $18.33 if momentum builds.
Additional confirmation: weekly bullish divergence on RSI or MACD, and a break above the first lower high structure.
This would signal the start of a potential mid-term reversal trend — possibly marking this zone as the golden bottom for UNI.
---
Bearish Scenario
Breakdown Continuation (Collapse Below Multi-Year Support)
A weekly close below $4.0 would confirm a breakdown from a 3-year accumulation structure.
Consequences could be severe:
Next support levels: $2.5 → $1.7 → $0.85.
Likely panic sell-off or capitulation wave.
However, such a breakdown could also serve as a final shakeout before a large-scale reversal — watch the weekly close, not just intraday wicks.
---
Sentiment & Context
UNI is standing at a psychological and structural crossroads.
Long-term holders have been defending this area for years, making it a critical liquidity zone.
If the zone breaks, stop losses and long-term positions could be flushed — but if it holds, UNI could become one of the strongest DeFi rebound plays in the next cycle.
This is the kind of setup where patience and confirmation matter far more than prediction.
---
Conclusion
The $4.0–$5.0 zone is not just support — it’s UNI’s lifeline.
Hold above = possible start of a new bullish era.
Break below = risk of a deeper bearish expansion.
Everything now depends on how the weekly candle closes.
The best traders will wait for confirmation rather than chase the wick.
> “This golden zone will decide UNI’s destiny — rebirth from the ashes, or another chapter in its decline.”
---
#UNI #UNIUSDT #Uniswap #CryptoAnalysis #TechnicalAnalysis #DeFi #SupportZone #WeeklyChart #TrendReversal #BreakdownAlert #SwingTrading #CryptoMarket #ChartAnalysis #CryptoOutlook

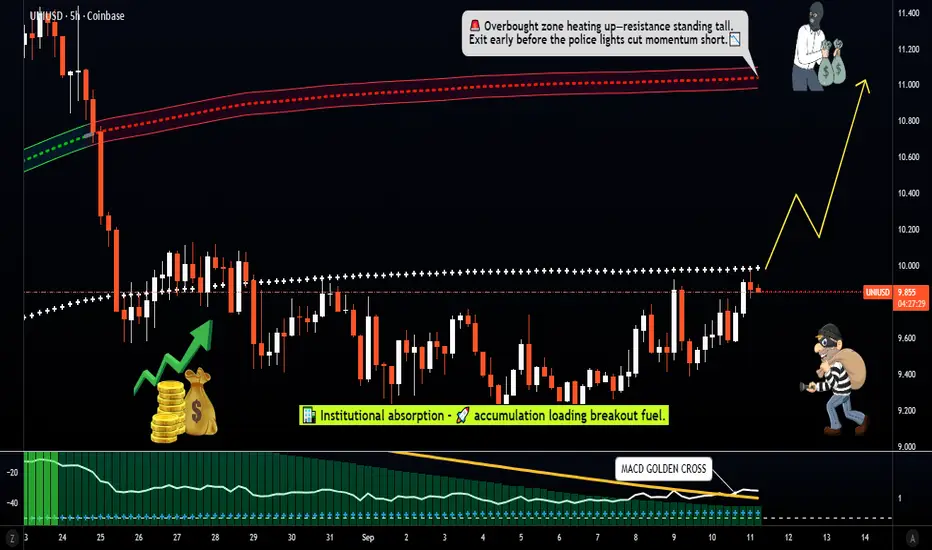
Uniswap Pending Order Strategy – Breakout Confirmation Required!🔥 UNISWAP/USD (UNI/USD) Thief Market Plan – Swing/Day Trade 🔥
Asset: UNISWAP/USD Crypto Market Plan (Swing/Day Trade)
Plan: Bullish (Pending Order Setup)
📌 Entry Idea:
Looking for a breakout above 10.000⚡ — once a bullish candle closes above the Simple Moving Average, this buy plan activates.
👉 Traders can set an alarm on TradingView to easily catch the breakout confirmation.
📌 Thief Layered Strategy:
Using the Thief layering style, multiple buy limit orders can be placed below the breakout level for scaling entries:
9.600
9.700
9.800
9.900
(You may add more layers depending on your own plan.)
✅ Important: This setup confirms only if the breakout at 10.000 happens.
📌 Stop-Loss Idea:
Proposed stop-loss zone: @9.400 (after breakout confirmation).
⚠️ Note: This is the Thief SL concept. Adjust based on your own risk management and strategy — risk is always personal.
📌 Target Idea:
First target at 11.000 (near moving average resistance + overbought zone).
💡 The idea here is to secure profits before the trap sets in.
⚠️ Reminder for Thief OG’s: This analysis is educational & strategic, not a direct financial recommendation. You’re always in control — make money, then take money at your own risk.
🧭 Strategy Notes for Thief OG’s:
This setup is not a fixed call.
Both SL and TP are flexible — trade with your own risk management.
Goal: Capture profits from momentum breakout & layered entries.
📌 Related Pairs to Watch:
BITSTAMP:BTCUSD
BITSTAMP:ETHUSD
COINBASE:SOLUSD
COINBASE:AVAXUSD
COINBASE:LINKUSD
✨ “If you find value in my analysis, a 👍 and 🚀 boost is much appreciated — it helps me share more setups with the community!”
#UNISWAP #UNIUSD #CryptoTrading #SwingTrade #DayTrading #Ichimoku #LayeringStrategy #BreakoutTrading #CryptoCommunity #TradingPlan
Uni 4H Trade IdeaHere is a trade idea for UNI on 4 hour TF. Entry & Exit Points are given. NFA. DYOR.

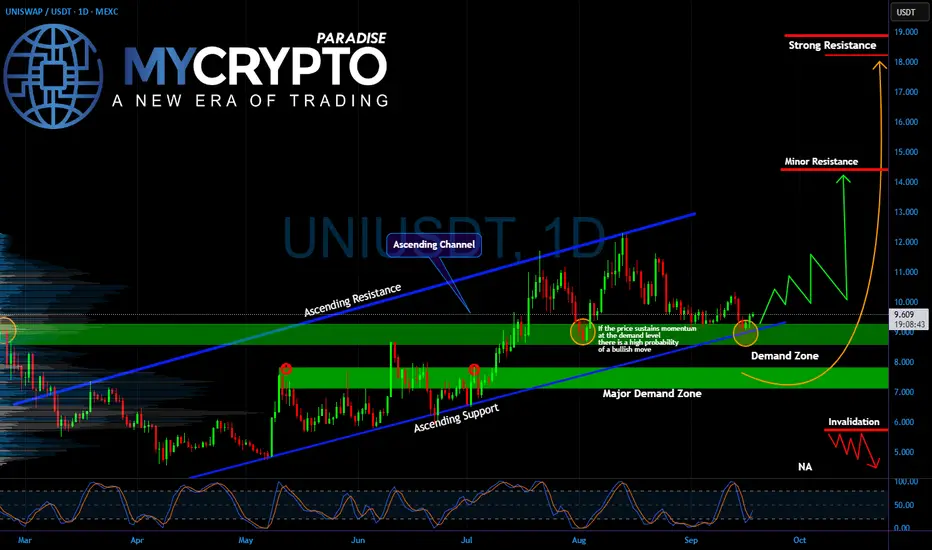
UNIUSDT About to Explode or Break Traders’ Dreams?Yello Paradisers, is #UNIUSDT quietly preparing for its next major rally, or are we sitting right on the edge of a painful trap for impatient traders? Let’s break it down.
💎#UNI has been holding within its ascending channel, bouncing consistently from its demand zone around $9–$9.50. Every retest of this area has brought buyers back into the game, showing strong defense by bulls. Right below, the major demand zone at $7–$8 remains the key level where long-term buyers are waiting, meaning this area acts as a foundation for continuation.
💎On the upside, if #UNI holds current structure and builds momentum, the first challenge is the minor resistance near $14. Breaking through this opens the door toward the strong resistance zone at $18–$19, where profit-taking will likely be aggressive.
💎However, there’s no free ride. A failure to hold the current demand zone could trigger a drop into the $7–$8 major demand area. If that level also gives up, the structure is invalidated, and UNI could revisit much deeper lows around $5–$6, wiping out weak hands before any real recovery.
💎Right now, #UNI is at a pivotal point: defend support and aim for $14–$18, or lose footing and fall into heavy liquidation territory.
Strive for consistency, wait for clear confirmations, and remember that discipline always beats chasing quick profits.
MyCryptoParadise
iFeel the success🌴
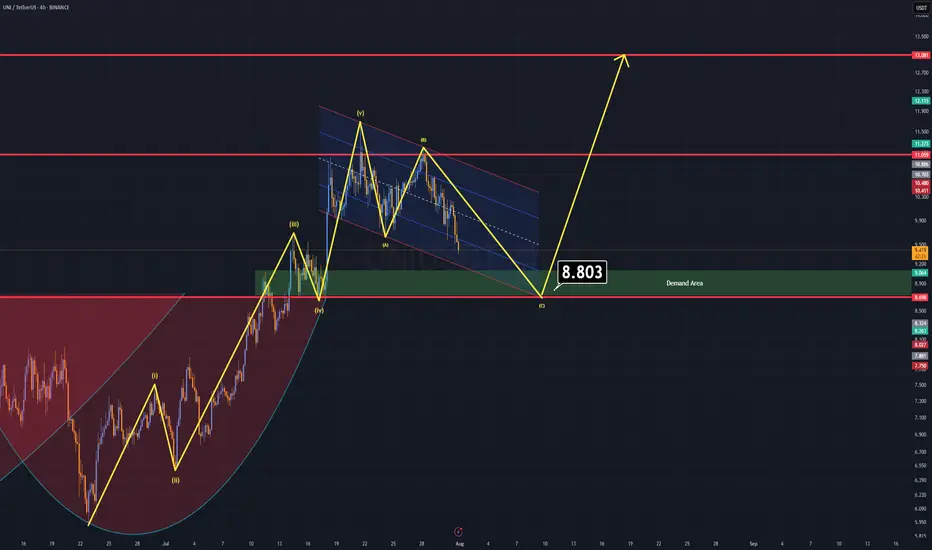
UNI UPDATE (4H)After completing a five-wave impulsive move to the upside, UNI now appears to have entered a corrective A–B–C pattern.
Additionally, a head and shoulders formation has already broken down and been retested, further confirming bearish momentum. All signals currently point toward a downward continuation.
On the 15-minute timeframe, a mini bear flag has also formed, which strengthens this bearish outlook.
Good Luck.

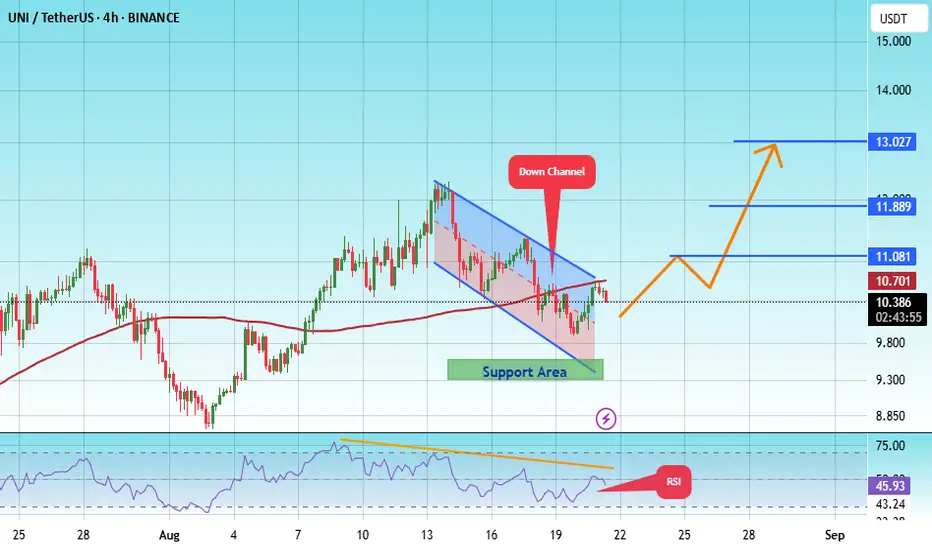
#UNI/USDT Forming Bullish Continuation#UNI
The price is moving within a descending channel on the 1-hour frame, adhering well to it, and is heading for a strong breakout and retest.
We have a bearish trend on the RSI indicator that is about to be broken and retested, supporting the upside.
There is a major support area (marked in green) at 9.50, which represents a strong basis for the upside.
For inquiries, please leave a comment.
We are in a consolidation trend above the 100 Moving Average.
Entry price: 10.40
First target: 11.08
Second target: 11.89
Third target: 13.03
Don't forget a simple matter: capital management.
When you reach the first target, save some money and then change your stop-loss order to an entry order.
For inquiries, please leave a comment.
Thank you.
Important range: 10.626-12.130
Hello, traders!
Follow us to get the latest information quickly.
Have a great day!
-------------------------------------
Uniswap (UNI) is used on DEX exchanges.
This makes it connected to many ecosystems.
However, it's worth considering whether this coin (token) is worth holding in the medium to long term.
This is because if the DEX exchange fails to activate and fails, it could disappear completely.
Therefore, to trade this coin (token), I recommend holding it by gradually increasing the amount of coins (tokens) that represent profits.
-
(UNIUSDT 1M chart)
The key is whether it can break above the formed channel.
-
(1W chart)
The key is whether it can find support around 10.626 and rise above 14.233-17.073.
If it declines below 10.626, it should check for support around 5.448-6.940.
Therefore, if it falls below the M-Signal indicator on the 1M chart, trading should be halted and the situation should be assessed.
-
(1D Chart)
The key is whether the price can maintain support above 14.233, with support found around 10.626-12.130.
If the price fails to rise, we should check for support around 9.080.
If not, a decline to 6.940 is possible.
Since a short-term upward channel has formed, we should examine whether the price can rise along this channel.
--------------------------------------------------
Increasing the number of coins (tokens) for profit involves selling the original purchase price (+ transaction fees) to retain the coins (tokens) corresponding to the profit.
This increases the number of coins (tokens) with an average purchase price of 0, making it possible to hold them for the medium to long term.
This strategy is more effective in a downtrend than in an uptrend.
-
Thank you for reading to the end.
I wish you successful trading.
--------------------------------------------------
- Here's an explanation of the big picture.
(3-year bull market, 1-year bear market pattern)
I'll explain more in detail when the bear market begins.
------------------------------------------------------

UNI Analysis (4H)UNI – Correction Might Bring Opportunity
Currently, UNI is forming an A–B–C corrective pattern, and based on technical structure, this correction may complete around the $8.8 level.
Key Zone to Watch: $9.0 – $8.5
There's a strong demand zone just below $9, supported by historical price action.
On the daily time frame, a broken cup & handle formation aligns perfectly with this area — the old neckline may now act as support, increasing the confluence.
This overlap of structure and demand makes the $9–$8.5 zone a favorable entry for a long position.
Once price reaches this area, expect a significant upward correction as part of the next move in the cycle.
Good Luck.
UNI up 13% – is $10 the next stop?Hello✌
let’s dive into a full analysis of the upcoming price potential for Uniswap 📈.
BINANCE:UNIUSDT has maintained solid bullish structure within a well-formed ascending channel and is now approaching a key daily support zone. Recent volume spikes and a 13% price increase indicate growing buying interest. A breakout above the channel resistance could open the way toward the psychological target at $10, a level watched by many traders. Monitoring price action and volume confirmation here is essential for potential trend continuation. 📈🧠
✨ Need a little love!
We pour love into every post your support keeps us inspired! 💛 Don’t be shy, we’d love to hear from you on comments. Big thanks , Mad Whale 🐋

UNI:LIMIT FOR BUY(FREE)Hello friends
Due to the price drop, we can buy on the drop within the specified limits and move with it to the specified targets, of course with capital and risk management.
*Trade safely with us*
Uniswap UNI price analysis🦄 Despite the weak crypto market, #UNI is holding up quite well at the moment, so you should take it "on a pencil".
At first, the “big money” are buying, and then the news will be rolled out.
🕯 The OKX:UNIUSDT chart shows increased trading volumes.
We wouldn't be surprised if in the coming days, when the market moves into a "range", the price of #UNI shoots up to $9.31 or even $11.21
💰 And globally - the price of $22 per #Uniswap token can still be considered a fairly modest forecast.
_____________________
Did you like our analysis? Leave a comment, like, and follow to get more
