GBPUSD Weak as my grandmother. 1. Supply coming in: up bar wide spread with high-ultra high volume closing off the highs of the bar follow by a down bar that confirms this weakness (2).
3. No demand bar: up bar with average-wide spread closing off the highs with less volume than the previous 3 bars, this signal needs to be confirmed with a down bar.
4. Trap up move: down bar with super wide spread, clossing off the lows with high volume, may some demand enter in this bar, but you will know it if the next bar closes high.
5. Gotcha bar: down bar with ultra wide spread, closing at the lows or near the lows of the bar with ultra high volume, this bar confirms the weakness of the previous bar, and, confirm the weakness of the sequencial of 1 and 3 signals.
6. Stopping volume: up bar closin at the highs or near the highs with high-ultra high volume, this bar confirms that may there is some demand in the previous bar, but you need confirmation.
7. Supply coming in: down bar closing on the lows of the bar, with high volume. This bar says: if there is some demand in the previous bar, why i close at the lows? because the market is weak.
8-9. Test's: down bars with average-narrow spread closing at the lows-near the lows with volume less than the previous 5 bars. The second test is seeing after a gap so if it confirms, may we have some demand in the market. (The next bar is up but with low volume, so, the tests doesnt confirm).
10. Up-thrust. Down bar that is marked up at the beginning of the bar to close down, average-wide spread with average volume, this confirms the weakness of the failed test (9).
11. Up-thrust (my favorite in this chart). Down bar that is marked up at the beginning of the bar to close down, average-wide spread with average volume, this bar confirms that the market even in over-sold state, will not go up because there is weakness. This signal is seen in a zone of previous weakness (signals 5, 8-9, 10) so you can assume that the market will not go up until demand in form of test's or no supply-shake out take place.
12. Bottoms reversal. Down bar, ultra high-volume, wide spread closing at or near the lows followed by a up bar wide spread closing at or near the highs confirms demand in the previous bar (the down bar). This signal need confirmation (up bar with average-high volume) but how can see, the next bar is a narrow spread bar with volume less than the previous 5-6 bars.
13. Test. down bars with average-narrow spread closing at the lows-near the lows with volume less than the previous 2 bars.
14. Potentional climatic action or gotcha bar. Down bar with wide spread closing at the lows with ultra high volume. This bar take place and closes lower than all of the bar seen before it. So you can assume that if the next bar is down, this bar shows that smart money is selling.
To take a short trade: wait until the next bar closes, if this closes down (for the time of now, the bar looks like a up-thrust, that is a signal to go short) and it breaks the support line of the previous bar, you can scalp or trade in this timeframe to the short side.
I prefer to scalp the market when i see a up thrust, no demand, supply coming in after the breakout of the support line.
This methodology is purely VSA. Sorry for my bad english, im'not a native speaker.
Up

TREND LINE BREAK AUD/JPYAUD/JPY just recently again broke above and has retested a downward trend line it has created and been under for a while. A break and close above 78.550 will see us re test the next point on the trend line at 80.00.

Up then Down ..as i painted by lines the averages will never go out of the previous limits and i think for some moments of future the market will go up and then down .. but you can always look at the end of any candle decision and never put or pull if you don't sure where the market will fly for.


Citigroup in uptrend R/R = 4Citigroup is an upside channel and the stock reacted positively on the news that there might be an interest hike in June 2016 by the Fed as this might improve their operational margins


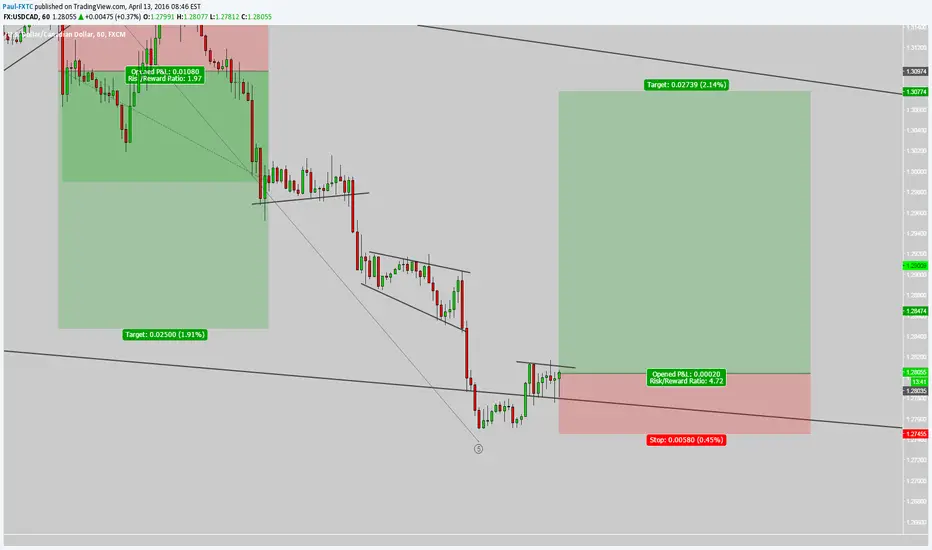
ABOUT 160 PIPS USD/CAD the price is going to go up until the black line, where could start a sideways phase

Gold UpDespués de una semana de alta volatilidad en el Oro en la que el precio se ha mantenido entre de los niveles de precio establecidos en 1.268,30 y 1.225.62, iniciamos esta semana en zona de soporte dentro del canal lateral con una suave tendencia alcista construida en las últimas 4 semanas.
Para esta semana establecemos como niveles importantes de soporte los precios 1.225,60, 1.210,85 y 1.197,62, bajo nuestra opnión solo la ruptura del nivel 1.225,62 provocaría la caida del precio hasta los siguientes niveles, además de iniciar un nuevo proceso tendencial a la baja en el activo, por tanto estaremos muy pendientes de la reacción del precio en este nivel clave.
After a week of high volatility in the Oro in which the price has remained between price levels established at 1,268.30 and 1.225.62 , we began this week in support area within the side channel with a mild uptrend built in the last 4 weeks.
For this week we set as important support levels price 1225.60 , 1210.85 and 1197.62 , under our opnión only breaking the level 1225.62 cause the price drop to the following levels , in addition to start a new process downward trend in the asset, therefore we are very aware of the price reaction at this key level


XAUUSD todayStill waiting to place an order short for next week. I'ts our main plan. We'll long today while waiting the new target price (1245 - 1247)

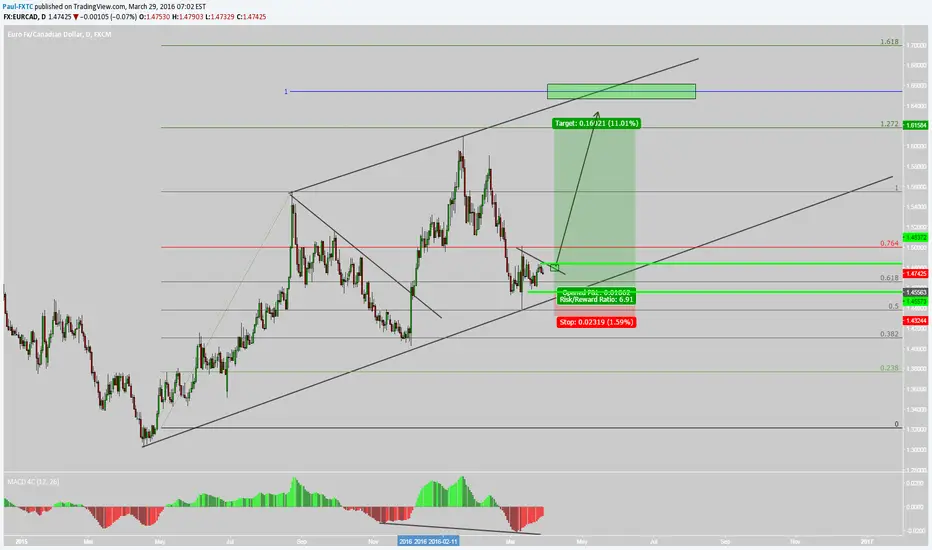
EURCAD NICE BUY SET UP EUR CAD
Tipo: BUY
TF : D 1
ORDEN PENDIENTE AL PRECIO: 1.455 - 1.485
STOP : 1.435
Take Profit : TP1 1.52 - TP2 1.56 - TP3 1.60
GBPUSD LongAfter hitting the monthly low resistance, GBPUSD bounced up again. Double fib retracement to the 0.5 with a double bull wedge before breaking out again. High probability of it breaking out the 1.42000 rs to retest it.

Ethereum 1D - 50% fib broken implying more upwardsIndicators:
- SMI is starting to bottom out and moving up. See the yellow circles. This is happening above negative area which is promising.
- Fibonacci line of 50% has been broken from top to local bottom which is suggesting that next we will test the 61% fib at 0.03679 next.
- Also on bigger Fibonacci setup from start of the rally to all time high, we almost touched the 50% fib line but more downwards got rejected with big volume which also implies that we could see higher prices in the following days.
Story:
Ok, seems like eth just doesn't want to come down at all. But who am I to blame it when day after day positive news keep dribbling in a slow but steady pace and more and more people get to know this very promising new tech. I've yet to grasp the fully potential myself here and I'm enthuastic if I may say so. Next I'm going to look up on the very promising DAO's coming from Maker and Slock.it, I suggest everyone else interested in investing will look these up also. Maybe we can have a chat later!
We also have Vitalik doing a talk hosted by Coinbase later today and I expect Vitalik to nail it as usual. Considering the influence Coinbase has, this could be very big news coming our way. This also makes me question if bitcoin has any benefits of so called network effect when it's so easy for service providers to switch to Ethereum.
Good luck and remember to not trade with more than you can afford to lose!


EUR/USD POTENTIAL LONGSAs predicted we came down from ECB news down to 1.108-1.1100, down to the key trend line. EURUSD is now rejecting this trend line + 200 EMA + 50% Fib. Swing traders should look for tomorrow's news FOMC for a break past the 61.% Fibo and a break of the downtrend line shown. NEEDS TO BE CONFIRMED FOR LONGS!!!!


xauusdwe will see more up to gold .
we are now breakout channel in weekly chart :) .
we are breakout downtrend .


