HFT Loading a Ascending Broadening Wedge BreakoutHFT is forming an Ascending Broadening Wedge on the 4H timeframe, indicating rising volatility and expansion in price range.
From the previous analysis, price has already delivered a 25%+ upside move, validating the structure and confirming volatility expansion.
Price continues to print higher highs and higher lows while respecting the lower trendline. As long as structure holds, upside continuation remains valid.
Bullish scenario:
• Hold above ascending support
• Acceptance above 0.0349
• Expansion toward 0.0440+
Bearish risk:
• Rejection from upper resistance
• Breakdown below ascending support
• Volatility-driven pullback
Trend remains constructive while structure holds.
Previous Analysis Link:
Update

Update: IREN Limited (IREN) - structure beats emotionsIREN Limited operates in Bitcoin mining and AI cloud infrastructure, focused on renewable energy and scalable data centers. Mining is the core revenue driver, AI services are still small but growing fast.
On the daily chart, a falling wedge has been broken to the upside, followed by a clean retest. The structure is holding. Price is now sitting in a strong daily support zone at 36–38, aligned with the 0.618 Fibonacci level.
MACD is turning bullish on higher timeframes, and short- to mid-term moving averages are stabilizing. This looks like accumulation after a deep correction, not a random bounce.
By the end of 2025, IREN scaled materially.
Revenue grew from $184M in 2024 to roughly $485M in 2025.
Bitcoin mining remains the main contributor, while AI Cloud Services added about $16M and continue expanding.
Consensus estimates point to ~$230M revenue in Q2 2026. EPS is still negative, which fits a capital-intensive expansion phase.
As long as price holds 36–38, the market is pricing a move toward 50 → 60 → 70.
This is not a one-day trade. It’s a structural recovery setup.
The chart already did the talking.

Investment Logic: Why Gold Leads This Market CycleInvestment Logic Explained: Metals as the Preferred Asset in This Cycle
The performance gap shown in the table is not accidental. It reflects a clear capital rotation driven by macroeconomic realities in 2025. While equities and Bitcoin struggled to generate real returns, precious metals led by gold emerged as the dominant beneficiaries of this cycle. This shift is rooted in monetary policy, geopolitical risk, and the market’s renewed focus on capital preservation rather than speculation.
Gold: The Core Beneficiary of the 2025 Macro Environment
Gold’s +67.3% appreciation this year is a direct response to persistent global uncertainty and a structural shift in monetary expectations. Central banks maintained a cautious stance as inflation remained sticky, while real yields compressed amid expectations of policy easing into 2026. In this environment, gold regained its role as the primary store of value offering protection against currency debasement, sovereign risk, and declining confidence in fiat systems.
Importantly, gold’s rise was not driven by hype or leverage. It was supported by sustained institutional demand, central bank accumulation, and a steady increase in long-term holdings. This is the hallmark of a healthy, macro driven trend rather than a speculative rally.
Silver and Platinum: Beta Plays on the Same Thesis
Silver and platinum significantly outperformed gold, but their gains should be viewed as extensions of the same macro logic. As confidence in hard assets strengthened, capital flowed into metals with tighter supply dynamics and industrial demand exposure. These moves typically follow gold’s lead in the later stages of a precious metals cycle amplifying returns but also volatility.
For professional traders, gold remains the anchor. Silver and platinum offer upside asymmetry, but gold defines the directional bias of the entire metals complex.
Why Equities and Bitcoin Lagged
The S&P’s modest +17.7% gain underscores a year dominated by valuation compression rather than expansion. Elevated rates, earnings uncertainty, and geopolitical risk limited upside. Bitcoin’s −9.3% decline further highlights the difference between speculative assets and defensive capital. As liquidity tightened and risk appetite normalized, capital favored assets with intrinsic value and macro credibility areas where gold excels and Bitcoin currently does not.
Professional Takeaway: This Is a Capital Preservation Cycle
This cycle is not about chasing exponential upside. It is about protecting purchasing power, managing risk, and aligning with macro flows. Gold sits at the center of this framework. Its performance reflects disciplined capital allocation by institutions, not retail enthusiasm. Until global monetary stability is restored and real yields turn decisively positive, gold is likely to remain a preferred asset.
For traders, the message is clear: follow structure, follow liquidity, and respect macro regimes. In 2025, gold was not just a trade it was the benchmark for intelligent capital positioning.

Intel aiming to previous two bottomsIntel is probably aiming to harvest a lot of liquidity from the previous two bottoms.

Ethereum - 4H Structure Call Playing Out, Daily Breakout.Ethereum Technical Breakout: 4-Hour Setup from December 8th Now Validated on Daily Chart
Our December 8th technical call on Ethereum based on 4-hour chart structure has materialized into a clean daily timeframe breakout. This analysis reviews the original setup, examines the price action that followed, and assesses the current structural picture as ETH pushes into higher territory with confirmed momentum.
🎯 Original Setup Recap (December 8th):
What We Identified:
On the 4-hour chart, Ethereum was showing:
Consolidation after a pullback to key support
Higher lows forming during the correction phase
Volume compression indicating accumulation
Momentum indicators resetting from overbought conditions
Critical support holding at structural levels
The Call:
Long position anticipation based on 4-hour structure suggesting the correction was nearing completion and continuation was probable. The setup offered defined risk below support with upside targets at previous resistance zones.
Why It Mattered:
The 4-hour timeframe captures intraday structure while filtering out noise from lower timeframes. When 4H patterns align with broader trend direction, they often precede significant multi-day moves that eventually appear on daily charts.
📈 What Happened Next:
Price Action Validation:
Following the December 8th structural read, Ethereum:
Held the identified support zone without breaking down
Began forming higher highs and higher lows on the 4-hour chart
Broke above intermediate resistance levels with increasing volume
Momentum indicators shifted from neutral to bullish
Daily chart structure began reflecting the 4H anticipation
The Breakout:
What started as a 4-hour setup has now translated into a clean daily chart breakout. This progression from lower timeframe structure to higher timeframe confirmation is textbook technical development - the 4H provided the early signal, the daily now provides the broader validation.
📊 Daily Chart Breakdown:
Current Structure:
Switching to the daily timeframe reveals:
Clean breakout above resistance: Previous consolidation highs have been cleared decisively
Volume confirmation: Breakout occurred with expansion in volume, not on declining participation
Momentum shift: Daily momentum oscillators flipping bullish after extended reset period
No immediate overhead resistance: Path to next major level is relatively clear
Why Daily Matters:
When a 4-hour setup evolves into a daily breakout:
Institutional participation typically increases (larger players operate on daily+ timeframes)
The move gains credibility beyond short-term speculation
Probability of continuation increases as higher timeframe traders enter
Support levels become more significant (daily structure holds better than intraday)
Key Observations:
Breakout candle characteristics: Strong close, minimal upper wick, suggesting buying conviction
Support conversion: Previous resistance now becomes support if price retests
Trend alignment: Daily now confirms what 4H structure was telegraphing weeks ago
🎯 From 4-Hour Call to Daily Confirmation:
The Progression:
December 8th (4H): Structural setup identified - accumulation phase near support
Initial Response: Price respected support, began building higher lows
Intermediate Action: 4H breakout triggered, resistance levels tested
Current State: Daily chart validates with clean breakout above consolidation
Why This Sequence Matters:
This is how professional technical analysis works:
Lower timeframes provide early positioning opportunities
Risk is defined based on structure (not arbitrary stops)
Higher timeframes eventually confirm or reject the thesis
Confirmation on daily adds conviction for position management
Key Lesson:
The 4-hour chart gave entry opportunity with tight risk. The daily chart now provides the validation that the trade thesis was correct. Traders who entered on 4H structure now have daily confirmation supporting continued upside.
📈 What the Daily Breakout Suggests:
Bullish Implications:
Next resistance target: Previous cycle highs now become the next logical objective
Momentum continuation: Daily breakout with momentum often sustains for multiple sessions
Support buffer: If price retraces, the breakout level should provide support
Trend clarity: Daily chart removes ambiguity - structure is now clearly bullish
Fibonacci Extensions:
From the correction low to breakout high, Fibonacci extension targets suggest:
1.272 extension: First projected resistance
1.618 extension: Major target zone where profit-taking typically occurs
2.0 extension: Extended target if momentum remains strong
These aren't guarantees but mathematical projections based on the measured move from consolidation.
🧠 Psychology of Early Entry vs. Breakout Chasing:
December 8th Entry (4H Structure):
Entry felt uncomfortable (price had just pulled back)
Risk was defined and relatively tight
Reward-to-risk was favorable (3:1 or better to first targets)
Required patience through consolidation period
Chasing Now (Post-Daily Breakout):
Entry feels "safer" (price is rising, daily confirms)
Risk has expanded significantly (stop would be much wider)
Reward has compressed (already moved toward targets)
Late entry often leads to getting shaken out on first retracement
The Professional Approach:
Buy structure on 4H when risk is defined. Use daily confirmation to hold position or add selectively, not to initiate at worse risk/reward.
📊 Current Trade Management Framework:
For Those In From December 8th:
Profit Taking Strategy:
First reduction: At previous major resistance (book partial profits)
Second reduction: At Fibonacci 1.618 extension (lock gains)
Final portion: Trailing stop or 2.0 extension (maximize upside)
Stop Management:
Move stops to breakeven after daily breakout confirmed
Trail stops below daily swing lows as new structure forms
Give daily structure room - don't tighten stops based on 4H noise
Position Psychology:
Daily confirmation means the trade thesis was correct. Avoid the temptation to overtrade or add aggressively here. The best risk/reward was on December 8th current management is about optimization, not aggressive scaling.
📅 What's Next?
Bullish Scenario:
Daily breakout continues with momentum
Price targets Fibonacci extensions sequentially
Minor retracements find support at breakout level
Volume remains elevated on green candles, diminishes on red
Retest Scenario:
Price pulls back to test breakout level as new support
This would be healthy consolidation, not failure
4H chart may provide re-entry or add opportunity
Daily structure remains intact unless breakout level fails
Invalidation:
Daily close back below breakout level
Volume deterioration suggesting exhaustion
Momentum divergence appearing on daily chart
Fundamental shifts in crypto market conditions
⚠️ Risk Considerations:
What Could Go Wrong:
Crypto Volatility:
Ethereum can experience 10-20% pullbacks even during bullish trends. Daily breakouts don't eliminate volatility - they suggest directional bias but not linear price action.
Market-Wide Weakness:
If Bitcoin enters correction or broader crypto sentiment shifts negative, individual coin technicals become secondary to market-wide flows.
False Breakout:
Daily breakouts can fail. If price closes back below the breakout level with volume, the technical picture changes and positions should be reassessed.
Regulatory/Fundamental Events:
Crypto markets remain sensitive to regulatory news, exchange issues, and macroeconomic factors that can override technical structure.
🏆 Key Trading Lessons from This Setup:
✅ Lower timeframes identify structure early: The 4H chart provided the early read when risk was defined
✅ Higher timeframes provide confirmation: Daily breakout validates the 4H thesis was correct
✅ Best entries feel uncomfortable: December 8th near support felt uncertain - that's when risk/reward was optimal
✅ Structure over emotion: The technical setup suggested bullish resolution despite uncertainty
✅ Patience pays: Allowing the 4H structure time to develop into daily confirmation requires discipline
✅ Manage, don't chase: Use daily confirmation for position management, not aggressive late entries
📌 Summary:
Then (December 8th):
4-hour chart showing structural setup
Support holding, accumulation visible
Entry opportunity with defined risk
Now (Current):
Daily chart confirms with clean breakout
Momentum supporting continued upside
Original thesis validated by higher timeframe
Next:
Monitor daily structure for continuation
Manage positions based on daily swing points
Watch for retest of breakout as potential support
⚠️ Important Disclaimers:
This analysis is for educational purposes and reflects a technical progression from 4-hour structure to daily confirmation. It is not financial advice or a recommendation to buy or sell Ethereum or any cryptocurrency.
Cryptocurrencies are highly volatile and speculative. Daily breakouts can fail, and past performance of similar setups does not guarantee future results. The December 8th call was based on structure visible at that time - subsequent price action could have invalidated the thesis.
Ethereum carries specific risks including regulatory uncertainty, technological vulnerabilities, market manipulation, and extreme volatility. Position sizing must account for potential 20-30% drawdowns even during bullish trends.
This review examines what happened after a technical call, not a prediction of future price movement. Markets change, structure fails, and no technical pattern guarantees success.
Always conduct independent research, manage risk appropriately, and never invest more than you can afford to lose. All cryptocurrency trading involves substantial risk of loss.
✨ Community Discussion:
Did you catch the December 8th setup on the 4H chart? How do you use multi-timeframe analysis in your trading? Share your approach to transitioning from lower to higher timeframe confirmation.
📜 Read the structure. Trust the process. Manage the risk.

SMCI cools the servers while the market warms up expectationsSMCI continues to move inside an ascending channel and is currently trading in the buy zone between the 0.618 and 0.786 Fibonacci levels. Strong demand appears within this range and the ma200 adds structural support as a dynamic base. Weekly divergence indicates weakening selling pressure and increases the probability of a renewed upward cycle. As long as price holds above the ma200 and stays within the channel, the structure remains bullish with the next targets at 41.88 and later at 62.35.
Super Micro Computer remains one of the global leaders in artificial intelligence server infrastructure. As of December 4, trailing twelve month revenue stands near 14.9 billion dollars. Net income exceeds 850 million dollars and cash reserves remain above three billion dollars. The company expands production of liquid cooled systems and next generation platforms for advanced model training. Global demand for artificial intelligence compute capacity continues to strengthen revenue and support margins. Minimal debt levels provide stability during market volatility.
As long as price remains within the buy zone between the 0.618 and 0.786 levels and above the ma200, the bullish continuation scenario remains valid. A confirmed breakout opens the way toward 41.88 and later toward 62.35. Technical and fundamental signals currently align which increases the probability of a new upward wave.
Servers cool down slowly, but trends usually heat up faster, especially with charts like this.

Elise : XAUUSD 2H — Breakout Retest Accumulation Setup |OANDA:XAUUSD
Key Scenarios
✅ Bullish Case (Primary)
A confirmed break and hold above 4135–4150 supply opens the door for bullish continuation toward:
🎯 Target 1: 4281
🎯 Target 2: 4374 (extended trendline & previous rejection zone)
Bullish structure remains valid above 4035.
❌ Bearish Case (Invalidation)
A clean close below the demand zone 4030–4000 would signal weakness, potentially sending price toward:
Current Levels to Watch
Demand Zone: 4035–4060
Supply / Breakout Zone: 4135–4150
Extended Resistance: 4281 / 4374
⚠️ Disclaimer:
This analysis is for educational purposes only — not financial advice. Always manage risk.

Analysis Update and Gold Entry Points
Hi Traders
Update on the one-hour gold chart (the analysis link is below) As expected and the chart path, three legs of the analysis have been completed so far, and exactly to the chart areas, the reaction is first an upward move from support and then a very good reaction from resistance, 4124. To continue the path and complete the fourth leg, we have a one-hour candlestick bet, which, if it stabilizes below this number, will give a pullback to the two levels of 4055 and 4068, a sell position and continue the path to the seller's target, which is 3980. I hope you have used this detailed analysis.
Analysis chart link:

“Ethereum Support Retest & Bullish Reversal Setup”Ethereum is retesting the key support zone after a bearish move, holding above the trendline. If the support holds, price may bounce toward the next target at 3,150, following the projected upward move. BOS levels and trendline interactions highlight potential bullish continuation.

XAUUSD Bullish Setup Toward 4100XAUUSD is showing a bullish setup after sweeping liquidity and rejecting strongly from the order block zone. Price is pushing upward toward the 4100 target, supported by previous range breakout, FVG imbalance, and clear resistance levels above. The chart signals continuation to the upside.

BTC Downtrend With Short-Term Rebound TargetBTC is trading in a clear downtrend, breaking below the central level and approaching the support zone. A short-term corrective bounce toward 92,000 is highlighted, but overall structure still shows bearish pressure under major resistance and BOS levels.

EUR/USD Targets 1.16300 After Trendline Rejection“EUR/USD trend is respecting the ascending support line with BOS confirmations. Price is expected to retest the trendline and push upward toward the 1.16300 target zone.”
If you want a title also, just tell me!

Bitcoin Reversal Setup Toward 96K TargetBitcoin is currently trading within a corrective structure after breaking down from the central zone. The chart highlights a fair value gap (FVG), a support level below, and a potential short-term bullish push toward the 96,000 target before any deeper move. The market remains in a ranging phase with key levels marked for possible reactions.

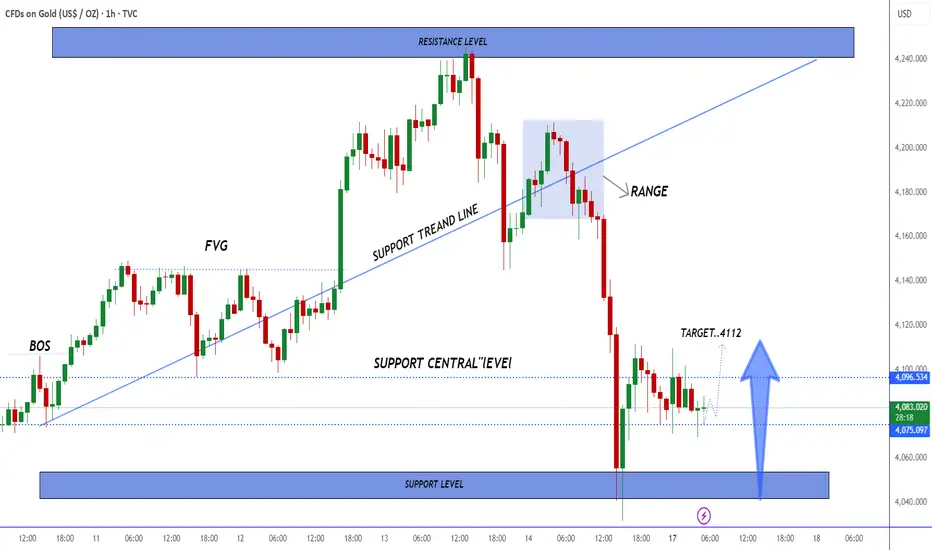
Gold Rejection at Support Zone with Bullish Targeting 4112Gold has broken below the support trendline and tapped the major support zone. Price is now consolidating near the support level, indicating a possible bullish reaction. If buyers step in, the next upside target is around 4112, aligned with the previous intraday structure.
USD/JPY Rejection Signals Possible Drop Toward 154.300USD/JPY is reacting from a strong resistance zone, showing signs of rejection after multiple failed breakouts. Price is expected to pull back toward the Fair Value Gap (FVG) and may extend further down toward the 154.300 target, aligning with the mapped order block below.

EUR/USD Breakout Setup Toward 1.16000EUR/USD is trading within an ascending channel, showing multiple breakouts and strong support bounces along the trend line. Price has recently touched the upper resistance and is now expected to pull back, with a potential downside target around 1.16000 if the trend-line break occurs.

Bitcoin Downtrend Continues: Bearish Target at $93,500Bitcoin is trading in a clear downtrend channel, repeatedly rejecting the trendline after liquidity sweeps. Support zones above have already been broken and retested as resistance, signaling bearish momentum. Price is currently consolidating near the lower channel, with a potential drop toward the target zone around $93,500.

ETH Support Bounce With Target at 3250Ethereum is trading above a key support level after a strong downward move. Price is showing early signs of a potential bullish correction, with projections pointing toward a possible recovery target around $3250. A break above minor resistance could confirm upward momentum.

BTC/USDT Trend Break Analysis & Target 101000This BTC/USDT 1-hour chart shows price moving within a downtrend, breaking below multiple trendlines. A key support zone around 97,800 is holding the price, while a resistance zone near 101,000 is highlighted as the next target. The chart also marks an FVG (Fair Value Gap) and two breakouts from the trendline. Current price action suggests a possible bullish move toward the 101,000 target zone if support continues to hold.

Bitcoin Bearish Reversal SetupBitcoin is showing a potential bearish setup as the price approaches the central resistance zone. A rejection from this area could lead to a downward move toward the 101,500 target level, with selling pressure expected below the trendline.

Gold Pullback Toward Demand ZoneGold price is trading above the trend line, showing bullish momentum. A short-term pullback is expected toward the 4205 target area, which aligns with the nearby demand zone and support level.

USD/JPY Bearish Breakdown SetupUSD/JPY shows a potential bearish move after rejection from the resistance zone and break of the trend line. Price is expected to retest the support zone before continuing down toward the target level at 1.154.00

Gold Pullback Expected After Hitting Trend Line ResistanceGold price is testing the upper trend line resistance after a strong bullish rally. A potential pullback toward the 4157 target zone is expected before the next move. Key support levels remain below 4100.
