UNIP has a positive trendWeekly chart
Technical analysis and advice for Universal for Paper and Packaging Materials (UNIP) on the Egyptian Stock Market (EGX) is detailed below:
Executive Summary: Technical Advice
Recommendation: Accumulate / Buy on Dips The stock is currently in a positive technical trend following a major price adjustment caused by a stock dividend (free shares) in late 2025. While some investors in social groups express frustration due to the lower nominal price, the technical indicators suggest strong momentum and accumulation.
1. Important Context: The "Price Drop" Misconception
If you see comments on Facebook groups complaining that the stock "crashed" from 0.80+ to the 0.20s, it is crucial to understand this was not a loss in value but a corporate action.
Event: On September 24-25, 2025, the company distributed 2 free shares for every 1 original share (a 3:1 split effect).
Impact: This naturally divided the share price by roughly 3. The current price of ~0.29 EGP is technically equivalent to the old ~0.87 EGP. The stock is essentially trading near its pre-split highs, which is a bullish sign.
2. Technical Indicators Analysis
The automated technical readings are overwhelmingly positive:
Trend: Bullish (Upward). The stock is trading above its key Moving Averages (5, 10, 20, 50, and 100-day), signaling a strong short-to-medium-term uptrend.
RSI (Relative Strength Index): ~70 (High/Overbought Border). This indicates very strong buying momentum. While it suggests the stock is "expensive" in the very short term, in strong trends, an RSI > 70 often signals a breakout rather than a reversal.
MACD (Moving Average Convergence Divergence): Positive. The MACD line is above the signal line, confirming the bullish momentum is still active.
Volume: Trading volumes have been healthy, indicating genuine interest from buyers at these new price levels.
3. Key Chart Levels (Support & Resistance)
Based on the post-split price action:
Current Price: ~0.292 EGP
Resistance (Target) 1: 0.305 EGP (Psychological barrier and recent high).
Resistance (Target) 2: 0.320 - 0.330 EGP (Extension target if 0.30 is broken with volume).
Support (Buy Zone): 0.282 - 0.285 EGP. This is the "floor" the stock has recently established.
Stop Loss: Below 0.270 EGP. A close below this level would invalidate the current bullish setup.
4. Social Sentiment (Facebook & Forums)
The "Trapped" Investor: Many retail investors on forums who bought at "highs" before the split often feel "stuck" because they see the price as 0.29 vs. their buy price of 1.00+, forgetting they now own 3x more shares. Ignore the panic from these comments; their "loss" is likely psychological rather than realized if adjusted for the split.
The Smart Money: Experienced traders are viewing the 0.28 - 0.29 zone as an accumulation phase, expecting the stock to eventually re-test the equivalent of its old highs (which would be ~0.40 - 0.50 in current terms over the long run).
5. Trading Plan & Advice
For Short-Term Traders: Look for entries as close to 0.285 as possible. Take profit partially at 0.305 and leave the rest for a potential breakout. Watch volume closely at 0.30; if it breaks with high volume, the rally could extend quickly.
For Investors: The stock is financially stable with recent capital increases. Hold your position if you already own it. If the price dips to 0.275, it is a strong "Buy" opportunity.
Note: AI generated based on my thoughtful prompt.
Uptrending

NVIDIA – When the Same Setup Appears Twice!NVDA - CURRENT PRICE : 188.61
NVDA – Technical BUY Call 📈
Price previously rallied steadily after breaking a minor downtrend line (refer orange circle).
Similar technical setup is forming again, suggesting a potential repeat of the prior upswing.
In both occurrences, price stayed above EMA50 , confirming the broader bullish trend remains intact.
RSI remains in bullish territory (>50) and is not overbought, indicating healthy momentum with further upside potential.
No major distribution signal observed, pullback appears corrective rather than trend-reversing.
Notes : According to Moomoo, broker house targets range from USD 200 (lowest) to USD 352 (highest), with an average target of USD 260.
ENTRY PRICE : 186.00 - 188.61
FIRST TARGET : 206.00
SECOND TARGET : 224.00
SUPPORT : 170.00

Intel aiming to previous two bottomsIntel is probably aiming to harvest a lot of liquidity from the previous two bottoms.

Can WEAV Repeat Its Past Bullish Earnings Performance?WEAV - CURRENT PRICE : 7.41
Historically, WEAV has shown strong rallies following positive earnings announcements, as highlighted by the green circles on the chart. The current price setup shows a similar early rebound pattern, suggesting potential for another upward move if bullish sentiment continues.
Technical Setup:
Price is rebounding from recent lows, forming a potential bottom structure.
Previous two rallies after earnings were followed by strong momentum — the current setup mirrors that historical behavior.
Volume has slightly increased, indicating renewed buying interest.
If price sustains above near-term support, a continuation move could follow.
ENTRY PRICE : 7.20 - 7.41
FIRST TARGET : 8.30
SECOND TARGET : 9.00
SUPPORT : 6.46 (Low of 30 October 2025 candle)
Notes: Investors who wish to review the company’s earnings details may visit its official website.

VRT – Mini Downtrend Break & Momentum Turning UpVRT - CURRENT PRICE : 179.73
VRT breaks out from a minor down channel while holding strongly within the long-term ascending trend channel. 📊 The breakout candle shows renewed buying interest, supported by RSI turning higher from the mid-zone and MACD showing early bullish improvement. 💪 With momentum improving and the long-term trend intact, the setup supports a buy-on-breakout strategy toward the upper channel.
ENTRY PRICE : 176.00 - 179.73
FIRST TARGET : 195.00
SECOND TARGET : 215.00
SUPPORT : 160.00

SUNCON - BREAKS DOWNTREND LINESUNCON - CURRENT PRICE : RM6.13
SUNCON (MYX:SUNCON) is a Bursa Malaysia–listed company under the Construction industry.
Key Technical Highlights :
1. Breakout from Downtrend Line
Price has successfully broken above the descending trendline, signalling a potential trend reversal and fresh bullish momentum.
2. Price Holding Above EMA 50
SUNCON continues to trade above the EMA 50, showing that buyers are defending the medium-term trend and pullbacks are being absorbed.
3. RSI Turning Bullish, Not Overbought
RSI has bounced from the mid-zone and is trending upward, indicating strengthening momentum. Importantly, RSI is still far from the overbought zone, giving room for further upside.
ENTRY PRICE : RM6.10 - RM6.13
FIRST TARGET : RM6.50
SECOND TARGET : RM6.90
SUPPORT : RM5.80
Summary: SUNCON is showing a clean bullish setup after breaking out of its downtrend and holding strongly above the EMA 50. With RSI momentum improving and price structure recovering, the stock has potential to retest the all-time high if buying pressure continues.

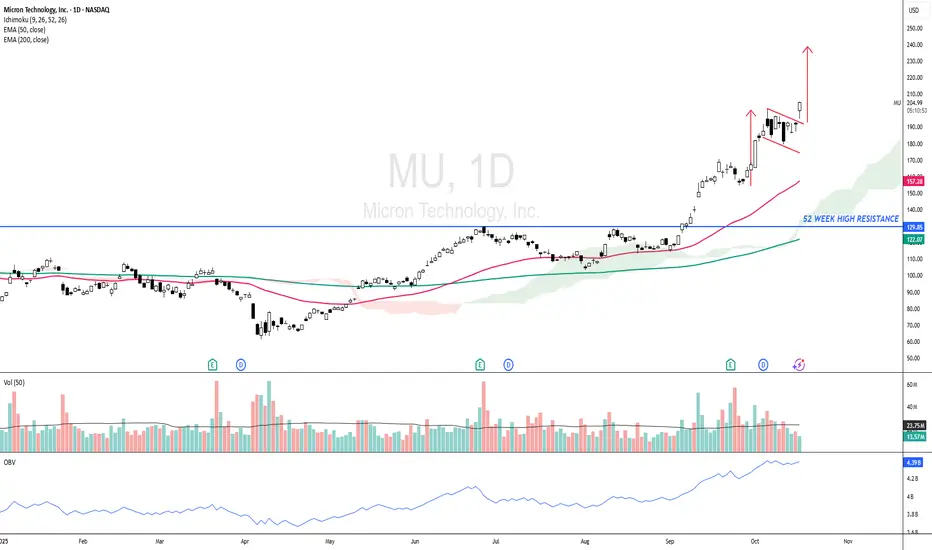
MU - Bullish Continuation Pattern ?MU - CURRENT PRICE : 204.00 - 205.00
The stock has surged nearly 70% since my previous buy call, demonstrating strong bullish momentum. I shared the link of my previous trading idea for reading purpose.
Currently, the price has broken out of a bullish flag pattern, indicating the potential for another leg higher. Estimate target of this bullish flag pattern is around 237.00. Support level is 179.00 (the low of 10 October 2025 candle).
Take note also this ascending in prices is also supported by rising in On Balance Volume (OBV) readings. (Look at the blue line at bottom of chart)
ENTRY PRICE : 203.00 - 205.00
TARGET : 237.00
SUPPORT : 179.00
TWLO - Downtrend line BROKEN!TWLO - CURRENT PRICE : 134.88
The chart shared here is the weekly chart, where TWLO broke above its downtrend line with strong volume — a signal of growing bullish momentum. On the daily chart, TWLO formed a rising window (gap-up) last Friday — a bullish signal that often indicates strong buying momentum and potential continuation of the uptrend.
From a pattern analysis perspective, some traders may interpret the current setup as a bullish symmetrical triangle, indicating potential continuation to the upside. Next target will be 154.00 and 174.00. Support level is 114.73 (the low of window area based on daily chart).
ENTRY PRICE : 132.00 - 135.00
FIRST TARGET : 154.00
SECOND TARGET : 174.00
SUPPORT : 114.73 (CUTLOSS below this level on closing basis)

ANET - Rebounds from EMA 50ANET - CURRENT PRICE : 148.00 - 149.00
Technical Rationale:
1. Rebound from Key Moving Average Support
The stock price has rebounded strongly from the 50-day EMA, which has acted as a dynamic support level throughout the uptrend. This rebound indicates renewed buying interest at a technically significant area.
2. Bullish Momentum Confirmation
ANET has crossed above the 20-day SMA, suggesting a short-term shift back to bullish momentum after a healthy pullback. This crossover reflects improving short-term trend strength.
3. Rising Support Line Intact
The long-term rising support trendline remains intact, confirming that the broader uptrend structure is well-maintained. Each corrective phase has so far been supported near this line, reinforcing the bullish bias.
4. Momentum Indicator (RSI)
The RSI is recovering from the mid-zone (~53), showing that bullish momentum is building again without being overbought. This supports the potential for further upside continuation.
ENTRY PRICE : 148.00 - 149.00
FIRST TARGET : 162.00
SECOND TARGET : 173.00
SUPPORT : 136.00

IQV - BUY ON DIPS IQV - CURRENT PRICE : 184.08
From May to July, IQVIA (IQV) staged a strong upward rally, supported by rising volume. Following this advance, the stock underwent a healthy retracement, consolidating recent gains without breaking its long-term uptrend. Take note that the up trendline is still intact.
Currently, price action shows signs of support around the Fibonacci 38.2% retracement level , coinciding with both the Ichimoku Cloud and the 50-day EMA . This confluence suggests the retracement phase may be complete, presenting a good opportunity to apply a Buy on Dips strategy as the stock prepares for its next upward leg.
ENTRY PRICE : 183.50 - 184.50
TARGET : 205.00 and 215.00
SUPPORT : 166.00

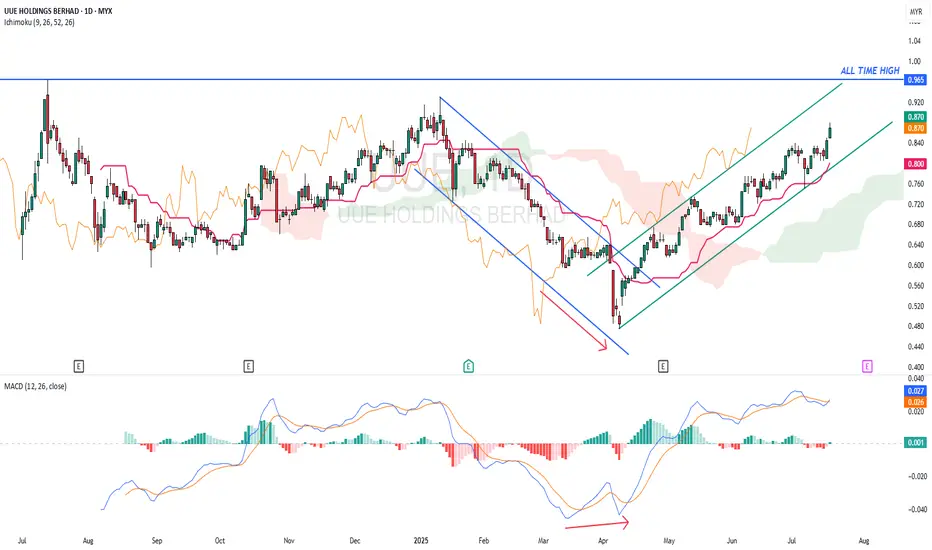
UUE - Potential hit All Time High ?UUE - CURRENT PRICE : RM0.870
The downtrend from January 2025 to April 2025 had changed to uptrend after the stock broke out the descending channel. Take note that there was a bullish divergence in MACD before the breakout of channel.
ICHIMOKU CLOUD traders may take note that the KIJUN SEN is rising steadily and CHIKOU SPAN also moving above candlesticks - indicating stock is uptrending. Today's closing price is higher than previous day's close suggesting a bullish breakout buy signal. A close below the KIJUN SEN may indicate a trend reversal (KIJUN SEN acts as support level).
ENTRY PRICE : RM0.865 - RM0.870
TARGET PRICE : RM0.930 , RM0.965 and RM1.03
SUPPORT : KIJUN SEN (cutloss if price close below KIJUN SEN)
AUMAS - Positive corelation with GOLD price movement ?AUMAS - Current price : RM0.890
AUMAS is bullish as the share price is above 50-day EMA. Note that the price breakout ICHIMOKU CLOUD on 31 JANUARY 2025 with high trading volume.
Gold future price surge to new high due to uncertainty and weak global sentiment. AUMAS is engages in gold mining business in Malaysia. The share price have a positive corelation with gold price movement. As such, i expect the share price may move higher in the upcoming session.
ENTRY PRICE : RM0.890
TARGET : RM0.980 (+10%)
STOP LOSS : RM0.820 (-7%)
Notes : The company was formerly known as Bahvest Resources Berhad and changed its name to AuMas Resources Berhad in December 2024. AuMas Resources Berhad was incorporated in 2004 and is headquartered in Tawau, Malaysia.

GBPSGD makes a reclaim of the Daily 200EMA, up 0.24% today..
This is one to watch as a potential trade in the near future.
This is because GBP has had a solid run this week against the Singapore dollar and has finally reclaimed the 200 EMA which is most significant on the Daily chart. It should be very supportive of future price rise next week so long as its price can solidify and remain above the 200 today.

NOCIL | SWING | LONG | ACCUMULATION PHASEPrice in an uptrend structure.
Price is creating a nice contraction over 20 EMA.
Price has been accumulating in a range from past few years and now it is ready to breakout of it.
It seems ready to break out of the previous ATH.
Volume is also drying up.

TGT - Analysis on recent strong moves - what we need to move upWelcome back to the trading floor traders! Our favorite place to be...
On Target, we are likely going to need some further liquidity to be built for the bulls to continue moving this up the way they have been - if this is the case, it will happen using our teal and orange controlled selling algorithms.
First we will look for yellow strong buying continuation to hold price and attempt a retest of our $153 high - but a break of yellow and we are then looking for confirmation of sell-side tapering via our teal channel.
Note: $150 is a strong level that could give us a reaction and quick bounce but in order for new highs to continue to be created we will need to continue to use our controlled selling algos to do that.
Keep you posted here as price develops!
Also please join me at market open (9:30 AM EST) where I will be trading live on stream here on TradingView and taking trades, analyzing charts, and having fun with our awesome community.
Happy Trading :)

🚀How to Profit from AUD/JPY’s Bullish TrendFrom our AI screener, it shows the currency Japanese yen is turning to weak side after over bought last week.
Moreover, AUD and NZD is going to strong side.
Based on Technical analysis in higher time frame we found AUDJPY and NZDJPY has a new trend to upside.
💰Here we sharing the buy limit order levels of AUDJPY for the week as shown on the chart.
💹News about Japanese Yen recently which may be one of the reason make JPY become weaker since last week.
In November 2023, the annual inflation rate in Japan fell to 2.8% from 3.3% in the previous month, which is the lowest it has been since July 2022. This was mainly due to a decrease in food prices, which rose by 7.3% compared to 8.6% in October. Additionally, the cost of transport, housing, furniture & household utensils, clothes, culture & recreation, and miscellaneous items also decreased. However, fuel and light prices fell for the 10th consecutive month, due to a decrease in electricity and gas prices. Education prices remained unchanged, while healthcare prices increased slightly. The core inflation rate also decreased to 2.5%, the lowest in 16 months, from 2.9% in October. Consumer prices fell by 0.1% on a monthly basis, the first drop since February, after a 0.7% gain in October.

📈Navigating the Uptrend📍 Understanding an Uptrend
An upward trend provides investors with an opportunity to profit from rising asset prices. Selling an asset once it has failed to create a higher peak and trough is one of the most effective ways to avoid large losses that can result from a change in trend. Some technical traders utilize trendlines to identify an uptrend and spot possible trend reversals. The trendline is drawn along the rising swing lows, helping to show where future swing lows may form.
Moving averages are also utilized by some technical traders to analyze uptrends. When the price is above the moving average the trend is considered up. Conversely, when the price drops below the moving average it means the price is now trading below the average price over a given period and may therefore no longer be in an uptrend.
While these tools may be helpful in visually seeing the uptrend, ultimately the price should be making higher swing highs and higher swing lows to confirm that an uptrend is present. When an asset fails to produce higher swing highs and lows, it means that a downtrend could be underway, the asset is ranging, or the price action is choppy and the trend direction is hard to determine. In such cases, uptrend traders may opt to step aside until an uptrend is clearly visible.
📍 Key Takeaways
🔹 Uptrends are characterized by higher peaks and troughs over time and imply bullish sentiment among investors.
🔹 A change in trend is fueled by a change in the supply of stocks investors want to buy compared with the supply of available shares in the market.
🔹 Uptrends are often coincidental with positive changes in the factors that surround the security, whether macroeconomic or specifically associated with a company's business model
👤 @AlgoBuddy
📅 Daily Ideas about market update, psychology & indicators
❤️ If you appreciate our work, please like, comment and follow ❤️

Power of Inside Bar - Cingniti TechInside Bars if used wisely, can give us astonishing results in Trading.
Let's understand this scenario.
Stock Name - Cigniti Tech
After 20th Feb 2023, on D TF, this counter merely had any move! More or less it had inside Bars with totally squeezed close prices compared to earlier close. if you observe, closing prices are getting squeezed day by day with drying up sales volume. This indicates sellers are loosing control & buyers ay pitch in!
Following are reasons for my Long view -
1. Stock is in Up Trend.
2. Stock prices are above 200 EMA
3. 10 & 20 EMAs are above 200 EMA.
4. RSI has crossed 55
5. Nifty IT index is in uptrend, so sectors is booming.
So my entry would be on crossover of high of 7th Feb. Same setup & logic can be applied while entering stock on 3rd March, as its crossing previous high of 2nd march for a quick move on upside.

DID YOU INVEST IN XRP?If your answer is "Yes". Congrats to you, by next uptrending between Altcoins vs Bitcoin, your money will be doubled. HOW?! In short. Let's say, you bought $1k of XRP at 30 cents ( 1000 / 0.3 = 3333.33 XRP ). After next halving of Bitcoin on May 2020, Bitcoin will reach $15k at least and the reward of miners will be decreased to 6.25 Bitcoins. This will reverse the game from the downtrend of Altcoins vs Bitcoin to the uptrend of Altcoins vs Bitcoin with double increase in value of USD. I'm not saying "Hype" but every Altcoin will try to be survived after the halving of Bitcoin and that's normal to keep the main investors in safe side. So, if you does sell your XRP / BTC or / USD at that time, you will get double profit $2k or 6666.66 XRP.
If your answer is "No". You can set buy orders like what I did in GOOD TIME TO BUY BITCOIN!
NEXT UPTREND WILL BE 60 CENTS FOR XRP.
DECIDE AND TRY TO MANAGE YOUR WALLET WITHOUT LOSING. HAPPY TRADING ;)

Aurum propTech is good for investment?? as per analysis aurum proptech is good technically .retracemnt over my targer for this stock 213 ,236 .. do u own analis

This Week My Technical Analysis.Simple Support and Resistance Level of Bank Nifty
Note : Strictly Maintain Stop loss

SOLANA WILL BULLISH TO 40$ as we can see in the chart, in the volume profile the price is under the VALUE AREA, and from the stoch RSI it's in over sold trying to go up again and always the price try stay in the value area especially in the Point of control, but in the MACD, it's still not confirmed yet, me personally I'm waiting the lines to cross each other and I'll make the call and i'll sell at 40$

SOLANA AnalysisSolana has been doing good , really good multi [le touches to support , indicating hold of value and up tp the u[side to profits , if you have question comment i would love to master mind with you
