How a massive slide in Paladin Uranium ASX, is no moreI walk you through here on the monthly chart, for ASX stock Paladin Energy.
See what appears as Topping structure 2007, dialing into that pre GFC period reveals a double top & the massive sell off, which is apparent on a Monthly chart & means massive selling and falls of around 2000% top to bottom.
But now the tide is rising again for Paladin, we see its bottom April of 2025 when Pres. Trump gave the Tarrifs a reprieve which got a steroid shot into stocks.
All smooth sailing as the USD turned down & now of course AUDUSD is bullish on higher time frames and is extending this year to easily tap 0.70.
Indicators then indicate the alignment. Simple as that. No, why would I use a stop loss if Im seeing all this upward momentum. But thats me.
I pull the trigger when I need to. To stop big losses.
Uranium

District Metals - Bullish outlook for the Uranium StockDistrict Metals (DMX): A Sweden-Focused Metals Story With a Regulatory Catalyst
District Metals is a Canada-listed exploration and development company with a strong focus on Sweden. The company is positioned around two key themes: polymetallic base and precious metals in historically productive mining districts, and long-dated optionality tied to energy and critical metals.
One of the company’s core assets is the Tomtebo project in the Bergslagen mining district. Bergslagen is one of Europe’s most established mining regions, with centuries of documented production across copper, zinc, lead, silver and gold. Tomtebo hosts multiple historical mines and polymetallic showings distributed along a large structural trend. The investment case here is straightforward: modern exploration techniques applied to an old mining district that was never explored with today’s geophysics, structural modeling, or systematic drilling. Value creation is driven by data — drilling results, geological continuity and scale — not narratives.
The second leg of the story, and the one attracting increasing attention, is Viken. This project hosts uranium alongside other metals such as vanadium, molybdenum, nickel, copper and zinc. For years, the economic potential of Viken has been structurally capped by Swedish legislation, as uranium extraction was effectively prohibited. That regulatory ceiling mattered — regardless of geology, uranium could not be part of any mine plan.
That is now changing.
Sweden has formally decided to reverse its long-standing uranium ban. The Swedish parliament has approved amendments to the Minerals Act and the Environmental Code that allow uranium to be classified as a concession mineral, meaning it can legally be explored for and extracted under the standard permitting framework. These changes are scheduled to come into force on 1 January 2026.
This is a material shift. It removes a hard legal stop that has existed for decades. For projects like Viken, uranium can once again be considered as part of the economic equation rather than being ignored entirely. That said, this is not a shortcut to production. Permitting, environmental assessments, technical studies, social acceptance and economics still apply. The law change does not eliminate risk — it eliminates prohibition.
From a market perspective, District Metals sits at the intersection of three forces: drill-driven exploration upside at Tomtebo, regulatory re-rating potential tied to uranium in Sweden, and a broader European push for domestic supply of critical raw materials. This is inherently high-risk territory, but that is where optionality and asymmetric outcomes live.
Execution, not sentiment, will decide the outcome.
Disclaimer: This post is not financial advice and should not be considered a recommendation to buy or sell any security. Always do your own research before making investment decisions.

OKLO: watching for top formation NYSE:OKLO : as long as price remains below the 175–183 local resistance zone, I’m watching for at least a mid-term top formation, with selling pressure likely to start dominating. The first support levels to watch are 135–125.
A confirmed break above 183 would shift the odds toward one more upside leg into the 210 macro-resistance area.
Chart:
Macro view:
Previously:
On macro-bottom potential (May 1): www.tradingview.com

Uranium: Defining the Future. 2025–2050 Vision & ForecastGreetings, reader!
Today, December 21, 2025, on the eve of Christmas and the day of the winter solstice — the starting point of new earthly and cosmic cycles — I continue my analytical and educational activity with a new article on investing in Uranium. Welcome to another long-read intended for a narrow circle of discerning minds.
This is a special period when the Sun is at its lowest point and the world, according to ancient myths, is shrouded in a three-day darkness. We cannot simply wait for the newborn light to gain strength. It is right now, in this moment of maximum darkness, that the newborn Sun needs a little help in its educational mission, illuminating the long-term path.
The current article about ⚛️ uranium is not about quick speculation. This is not a "hype" topic that promises 100,500% profit by the end of the month. It’s not about "how to make a quick buck," but about how to understand long-term trends and prepare the ground for investment decisions with a planning horizon measured not in days or even months, but in years and decades ahead. Therefore, on the day of the winter solstice (the beginning of the cycle and the planetary New Year), it is worth starting important and long-term affairs.
And already on January 01, 2026 (on New Year's Day for ‘ordinary mortals’), another publication is planned under the intriguing title: 🎈"Five Bubbles of Technocracy" , which will analyze the history of previous bubbles in the stock markets over the past 50 years and what to expect next, further expanding your horizon of understanding of ongoing global processes. Also in the works is another long-read: 📜"The Fall of New Babylon. Prophetic Synthesis 2020–2050" , scheduled for publication on the Chinese New Year, February 17, 2026.
The author boldly shares these ideas and publishes long-term forecasts, perfectly understanding that they can be used only by a small percentage of people who possess critical thinking and are oriented toward strategic planning. The article could have been longer, but it hit the character limit on TV, and I didn't want to split it into several separate ideas, so I had to compress it in some places.
Today we will touch upon a topic that lies at the heart of the entire future technological paradigm, including AI, Data Centers, and even transhumanism: the creation of an invulnerable, autonomous, and distributed digital infrastructure. We will examine how the fusion of small modular reactors (SMRs), data centers (DCs), and low-earth orbit satellite systems creates the foundation for the New World Order.
📄The idea, as usual, for easier perception, will be divided into three parts:
☢️ Part I: Historical Foundation and Forecasts . We will start from a dry historical summary, forecasts from key energy organizations (IEA, IAEA, and WNA), general trends, and a broad vision of future prospects. This base is necessary to understand what happened and what is happening right now.
☢️ Part II: Uranium — Fuel for Transhumanism . After that, we will move to specifics: we will analyze uranium price charts and search for suitable investment instruments, where forecasts for stocks and ETFs related to uranium, SMRs, and DCs will be given.
☢️ Part III: Thoughts on the Future of Civilization . And finally, we will discuss the coming and not-so-distant future, the foundation of which is being laid today. Most people do not see, do not understand, and do not realize this, as the crowd is occupied either with useless fuss and survival in the daily grind, or with dopamine-driven scrolling through social networks with hedonistic adaptation smoothly flowing into conspicuous consumerism. We will detach ourselves from the information noise and look at HOW and, ultimately, WHY this brave new world of cyberpunk is being built, in which uranium will play its special role.
So, we begin our immersion into the world of the nuclear renaissance.
________________________________________
☢️ Part I. Historical Facts and Forecasts by IEA, IAEA, and WNA
________________________________________
📖 1. Overview of the History of Civilian Nuclear Power Development
To understand the general course of civilian nuclear development, its current renaissance, and why Small Modular Reactors (SMRs) will become the technology necessary for digital sovereignty , it is worth briefly running through the key stages of history. The energy contained within the atomic nucleus has traveled a path from a military secret and a symbol of global threat to being recognized as the only reliable foundation for a decarbonized and autonomous future.
⏳ 1.1. Early Stage: The Birth of the Peaceful Atom (1940s-1960s)
Civilian nuclear energy is inextricably linked to the military research of World War II and the Manhattan Project. The initial goal — the creation of atomic weapons — launched an unprecedented arms race. The contributions of American, European, and Soviet scientists became the foundation for both the bomb and the subsequent peaceful use of atomic energy.
After the successful creation of weapons, the USA and the USSR quickly realized the colossal energy potential of the atom. The Cold War fueled the desire to demonstrate technological superiority: • In 1954, the USSR launched the world's first NPP in Obninsk. • In 1957, the USA launched the Shippingport commercial station. This was a period when nuclear technology was perceived as a symbol of progress, which marked the beginning of the mass construction of large reactors around the world.
🚀 1.2. The Golden Age and the Alarm Bell (1970s–1990s)
In the 1970s, following the 1973 oil crisis, nuclear energy experienced a real boom. Countries saw NPPs as a guarantee of energy independence and stability. PWR and BWR designs were developed and standardized, and they still form the basis of the global fleet today. During this time, the idea was established that large, centralized NPPs were the most profitable way to produce baseload electricity. However, this "Golden Age" was overshadowed by accidents that cardinally changed public perception:
The Three Mile Island accident (1979) became the first serious wake-up call, forcing a revision of safety standards.
The Chernobyl disaster (1986) dealt the most severe blow, causing mass protests and a moratorium on construction, freezing the industry's development for long decades.
📉 1.3. The Era of Stagnation and Decline (1990s–2020s)
After Chernobyl, nuclear energy entered a period of "nuclear winter." Public opinion, frightened by the catastrophe, demanded the closure of old stations. Economically, the industry felt pressure due to the abundance of cheap gas and subsidies for "green" energy, which made the construction of large NPPs unprofitable. The turning point that finally undermined trust was the Fukushima accident in Japan in 2011. This led to the phasing out of nuclear programs (primarily in Germany). The focus shifted exclusively to safety and the long-term storage of SNF (Spent Nuclear Fuel). The exceptions remained: • France, which, essentially having no other alternatives, continued to reprocess fuel. • China and India, where energy security carried more political weight than the anti-nuclear sentiments of the West.
🔄 1.4. A New Renaissance: Climate and Geopolitics (2020s–2050s)
The beginning of the 2020s was marked by a radical reversal in the attitude towards the atom, provoked by the climate imperative and the geopolitical crisis. It finally became obvious that solar and wind energy cannot provide the stability of the power system, especially for the constantly growing needs of digital infrastructure (Data Centers) . The escalating energy crisis forced the world to recognize nuclear energy as critically important for national security and decarbonization. The focus shifted from giant NPPs to Small Modular Reactors (SMRs) and Microreactors (μR) . These reactors, based on modular design and enhanced passive safety standards, promise to radically reduce construction time and costs, and are also suitable for providing autonomous power to industrial hubs and, critically, distributed data centers. During this period, work on the transition to HALEU fuel and the implementation of closed fuel cycle technologies intensified, finally turning nuclear "waste" into a strategic resource of the future.
📊 2. Atomic Economics: Uranium Prices and the Global Energy Balance
The uranium market has always been a mirror of geopolitics and fear, but since 2020 it has entered a structural bull cycle phase. Below is a brief history of uranium pricing with a historical chart from 1990:
🟡 Key Historical Stages of Uranium Prices (1970–2050)
"Uranium Boom" (1970s) : Short-term explosive demand after the 1973 oil crisis pushed prices to high levels.
"Nuclear Winter" (1980–2000) : Prices remained extremely low (below 20 USD/lb) for decades due to oversupply, the release of military stockpiles (the "Megatons to Megawatts" program), and Chernobyl.
Speculative Peak (2000–2007) : The market realized the depletion of long-term inventories. A speculative rally from the 7 USD/lb level in 2000 led to a historical maximum: ≈130–150 USD/lb by 2007.
Financial Crisis and Post-Fukushima (2008–2020) : The global financial crisis and then the Fukushima accident (2011) caused a prolonged market collapse. Prices fell to lows (20–30 USD/lb), deterring investors.
Commodity Supercycle (2020–2050) : The uranium market entered a new bull cycle phase. The price growth from 20 to a peak of 100 USD/lb in 2024 was caused by a combination of factors: the climate imperative, geopolitical risks, and structural deficit, exacerbated by investments in SMRs and growing requests from Data Centers for uninterrupted energy supplies.
📊 Infographics No. 1 and No. 2. Current Share of Nuclear Energy in the World and Nuclear Energy Production by Country
The infographic on the left demonstrates that fossil fuels still dominate global electricity production, but the share of clean sources (RES + Nuclear) is steadily growing. In 2024, the share of fossil fuels in total electricity generation was almost 60%. Coal accounts for 35% of total electricity generation. In developing economies, coal is still the primary source of electricity.
Nuclear power has been at a stable level of 9%–10% in recent years (according to 2024 data).
This share is critically important, as nuclear is the second-largest carbon-free source after hydropower and provides a stable baseload (24/7), unlike intermittent RES (solar and wind).
In China, coal provided almost 60% of electricity generation.
In India, coal provided 73% of the electricity produced.
In advanced economies, renewable energy sources and natural gas play a more important role in electricity production.
In the US, in 2024, natural gas accounted for more than 40% of all electricity generation.
In the European Union, renewable energy sources provided almost half of the electricity supply, significantly exceeding the global average.
Important fact: According to 2024 data, RES and Nuclear power combined already provided more than 40% of global electricity production.
The diagram on the right shows the ranking of the world's largest nuclear energy producing countries in 2024, measured in terawatt-hours (TWh) of electricity produced, as well as their share in global nuclear electricity production. The data is taken from the Statistical Review of World Energy 2025, prepared by the Energy Institute. The USA remains a nuclear powerhouse, generating 823 TWh in 2024, which accounts for 29.2% of global electricity production at NPPs. China is in second place with 451 TWh (16%), followed by France with 381 TWh (13.5%). Russia, South Korea, and Canada round out the top six, collectively accounting for almost 17% of global nuclear energy production.
🧮 3. Key Forecasts for 2040–2050: The Era of SMRs
Forecasts for 15–25 years ahead vary greatly, but the general trend looks like this: the absolute volume of generation at NPPs will grow, but its share in the total "pie" may grow slower than RES. It is precisely SMRs that are the key factor that could make the forecasts more optimistic:
Replacement of old capacities: SMRs can quickly and economically replace aging large NPPs.
New markets: SMRs open up completely new markets (remote regions, industrial clusters, DCs), where the construction of large NPPs was impossible.
3.1. International Energy Agency (IEA) Forecasts The IEA generally uses conservative scenarios:
Capacity growth (abs.): Installed NPP capacity in the world will grow by almost 60% by 2050 (reaching about 650 GW).
Share in generation: It may even decrease from the current ≈9% to 8% by 2050, despite absolute growth.
IEA Summary: Nuclear energy is absolutely necessary to achieve climate goals, but its share may not grow due to the faster spread of RES.
3.2. World Nuclear Association (WNA) Forecasts . The WNA, representing the industry itself, gives more optimistic forecasts. Growth from the current level of ≈400 GW:
Base case scenario: ≈686 GW (Growth ≈70%).
Optimistic scenario: ≈931 GW (More than 2-fold growth).
Forecast by share: In the base case scenario, nuclear generation will double by 2040 in absolute terms, which will mean a significant increase in share (possibly up to 12%–15%). The optimism is based on political recognition of the role of the atom and the active implementation of SMRs.
3.3. IAEA Forecasts . For the last few years, the IAEA has consistently revised its forecasts upwards:
Capacities by 2050 could increase by more than 2 times compared to the current level (i.e., exceed 800 GW).
This optimism reflects a growing political consensus in favor of extending the service life of existing reactors and accelerated commissioning of new ones, including SMRs.
/list]
🟡 Final conclusion from the forecasts:
The future of nuclear energy is inextricably linked with Small Modular Reactors (SMRs) and Microreactors (μR) .
Capacity (abs. growth): Global NPP capacities could double or even triple by 2050, ensuring rapid commissioning of new capacities.
Technologies: Mass commissioning of Generation IV reactors and commercialization of SMRs are ideal for combination with DCs and industry due to safety, compactness, and the possibility of placement in close proximity to the consumer.
📊 Dramatic Shifts in the Balance Over the Last 50 Years:
The share of oil in electricity generation has dropped sharply (from ≈25% in the 1970s to less than 3% now).
Natural gas figures have grown (from ≈12% to ≈24% by 2024), replacing oil as a cleaner source of maneuverable fuel.
The share of coal remains dominant (≈35%), confirming the difficulty of the decarbonization task.
Solar and wind have made a leap, reaching a combined share of ≈15%, which is the main driver of the reduction in the share of fossil fuels.
The share of nuclear energy has increased several times since the 1970s, from 3% to 10-12%, and according to forecasts, its percentage share will remain approximately at the same values of 10-15% in the perspective of the next 10-20 years.
________________________________________
🗣️ 4. A Selection of Quotes on SMRs + Data Centers
In statements ranging from politicians and experts to industry representatives, there is a clear polarity and strong optimism regarding the potential of SMRs as a solution for decarbonization and powering Data Centers. Here are some interesting direct quotes on this topic:
💬 Bill Gates (Founder of TerraPower), May 2023: "I am proud to be investing in the next generation of nuclear power plants in Kemmerer and supporting the state of Wyoming as an energy leader in the U.S... TerraPower’s Natrium reactor is an example of how energy innovation can create jobs and strengthen the American economy…. When it opens (potentially in 2030), it will be the most advanced nuclear facility in the world, and it will be much safer and produce far less waste than conventional reactors... The world needs to make a big bet on nuclear energy."
💬 Jennifer Granholm (US Secretary of Energy under Biden), June 2024: "To reach our goal by 2050, we must at least triple our current nuclear capacity in this country. That means adding another 200 gigawatts by 2050." In September 2024, she added regarding this: "It is absolutely one of the clean energy solutions that Data Centers should be looking at."
💬 Fatih Birol (Executive Director of the IEA), January 2025: "Today it is clear that the powerful comeback of nuclear energy, which the IEA predicted several years ago, is in full swing, and in 2025, nuclear energy will reach record levels of electricity production... SMRs, in particular, offer exciting growth potential." "...With the right support, SMR installations could reach 80 GW by 2040 , accounting for 10% of the world's total nuclear capacity."
💬 V.V.P. "The Lord of Mordor," October 2025: "Experts believe that nuclear energy will become one of the structural pillars of the future global energy balance. By 2050, the capacity of the world's NPPs will almost double. In Russia, within a fifteen-year horizon, we plan to commission more than 29 gigawatts of nuclear power plant capacity, including small NPPs , and so far, no one else is building small NPPs but us... The digital economy , including Artificial Intelligence tools, blockchain, data storage, and processing facilities , is driving a growing demand for electricity. By some estimates, the energy consumption of data centers in the world is already comparable to all heavy industry."
📊 Infographics No. 3 and No. 4. Nuclear Energy Capacity by Country
Two more very telling infographics displaying the amount of nuclear energy generated by the world's major producers.
While Germany has bid farewell to nuclear energy, China simultaneously plans to triple its nuclear power generation and invest in technologies such as the thorium molten salt reactor. China remains heavily dependent on coal energy and is forced to rapidly increase nuclear generation to diversify its energy balance.
For the last quarter-century, the USA has tried to keep nuclear energy production at the 750-800 TWh level.
Germany partially meets its electricity needs through imports, including from French NPPs. Given that in 2024, 60% of its energy will come from renewable sources, the future of energy remains a big question, and the future of the (former) industrial locomotive of the EU looks very grim and dark.
Even France, which is heavily dependent on nuclear energy, has seen generation drop from peaks of 452 TWh in 2005 to below 300 TWh in 2022—in other words, a reduction of almost a third in twenty years.
The graph on the right shows the ranking of nuclear energy capacity by country.
As of the end of 2023, the total nuclear energy capacity in the world was 396 gigawatts (GW). According to Global Energy Monitor, another 299 GW are in the development stage or announced for construction. The USA has the largest nuclear energy capacity: the total capacity of 94 reactors is 102 GW. Global nuclear energy capacity must increase to 695 GW, which means a jump of more than 75%. Notably, China, India, Russia, and even the UK plan to double or triple their nuclear capacities, while India even plans to quadruple its own. If China increases its capacity to 118 GW, it will overtake the USA and become the world leader in nuclear energy generation.
🌎 5. Uranium Reserves and the Fuel Cycle
Is there enough Uranium-235? The shortage problem is not so much about the total amount of uranium, but rather the reserves of easily accessible and economically viable raw materials given current technologies. According to the World Nuclear Association (WNA) and the IAEA:
Estimated and recoverable reserves: Identified reliable uranium reserves that can be extracted at a price up to $130/kg (about $50 per lb) are approximately 5.7–6.1 million tons.
Security of supply: At the current world consumption level (about 60 thousand tons per year), these reserves will last for about 90–100 years.
How does capacity growth affect the reserve lifespan?
Current consumption: ≈60k tons per year → Reserves (up to $130/kg) last for ≈100 years.
WNA Optimistic scenario: Capacity growth from ≈400 GW to ≈931 GW by 2040 means a global uranium consumption increase of about 2.3 times.
New consumption: 60k tons/year × 2.3 ≈ 138k tons/year.
New security period: 6.1 million tons / 138k tons/year ≈ 44 years.
Summary: If the WNA optimistic scenario is realized, identified uranium reserves, the extraction of which is economically feasible at a price of $130/kg, will last for about 45 years, not a hundred. However, increasing the extraction price—say, doubling it to $300/kg ($130 per lb)—will sharply increase the volume of recoverable reserves, theoretically pushing back the availability horizon.
⚛️ 5.1. Development of Fuel Technologies:
HALEU (High-Assay Low-Enriched Uranium). Enrichment of U-235 from 5% up to 20%. This allows for a smaller reactor core, increased fuel burnup, and long-term reactor operation without refueling (5–20 years).
TRISO (Tristructural-Isotropic fuel microspheres). A particle in a ceramic shell. It provides the highest passive safety, as each layer acts as a barrier, preventing the leakage of radioactive substances even at extreme temperatures.
♻️ 5.2. Concepts of NRT, FBR, Closed Cycle, and Waste Utilization
Standard reactors (LWR) use only ≈5% of the energy and discard the rest as SNF (Spent Nuclear Fuel), which includes long-lived and toxic transuranic elements (plutonium, neptunium, americium) requiring storage for hundreds of thousands of years. The goal of nuclear physicists—for example, Igor Nikolaevich Ostretsov (Nuclear Relativistic Technologies, hereafter: NRT)—and other approaches (Fast Breeder Reactors, hereafter: FBR) is to use this long-lived waste as fuel. This solves two problems:
1️⃣** Energy Security: ** Allows the use of almost all uranium and thorium available in nature (≈95%–99% efficiency), turning world reserves into energy for thousands of years.
2️⃣** Ecology: ** Significantly reduces the volume of high-level waste and shortens its danger period to several hundred years.
To implement these ideas, Fast Breeder Reactors (FBR) are needed first, followed by Nuclear Relativistic Technologies (NRT). These new approaches and technologies allow for the effective fission of long-lived transuranic elements, turning waste into energy. Although most current SMR projects are simplified LWRs, the closed-cycle concept is critical for the next generation of SMRs (Generation IV-V) , including Molten Salt Reactors (MSR) and compact fast reactors.
♾️ 5.3. Uranium-238: Not "Waste," but the Future Fuel
Natural uranium consists of ≈0.7% fissile U-235 and ≈99.3% non-fissile U-238 ("waste" in current technologies).
U-238 is a fertile material. When irradiated with fast neutrons, it transforms into Plutonium-239 (Pu-239)—an ideal fissile fuel.
| 238U+n→239U→239Np→239Pu |
Transitioning to reactors using FBR or NRT solves the problem of "U-235 shortage." Such reactors can utilize the entire stock of U-238, multi-folding the uranium resource base from a theoretical 50–100 years to several thousand years.
For this very reason, in the long term, nuclear energy can be tentatively called a "clean and renewable" source of energy.
📊 Infographics No. 5 and No. 6. The Aging Global Fleet of Nuclear Reactors
The diagram on the left visualizes the age and electrical capacity of 416 nuclear reactors in the world, based on data from the Power Reactor Information System (PRIS) . Each circle represents a group of reactors of the same age, and the size of the circles corresponds to the total net electrical capacity (in megawatts). Data on the global reactor fleet confirms that traditional nuclear energy is a dying, outdated asset . More than two-thirds of the world's nuclear reactors are over 30 years old, with an average age of 32. This is not "long-term reliability," but a chronic aging of infrastructure. The reduction in the number of operating reactors from 422 to 416 in two years (2023–2025) symbolizes the inability of old nation-states to maintain and develop this critical baseload. The fact that new reactors (built in the last 10 years) have a higher average capacity (> 1000 MW) proves that nuclear technology continued to evolve behind the scenes while the crowd was being fed myths about the "green transition." The outdated, worn-out, and publicly discredited traditional nuclear fleet is making way for SMRs/μRs, which solve all the problems of the old system:
The Age Problem: SMRs/μRs are new, modular, and built quickly.
The Safety Problem: SMRs/μRs are smaller, safer, and located away from "civilization," cities, and megalopolises.
The Control Problem: SMRs/μRs integrate directly with Data Centers, bypassing old, vulnerable state-owned grids.
⚧️ 5.4 Nuclear "Trans" and Transhumanism:
In nuclear physics, there is the concept of transmutation — a process by which one chemical element (or its isotope) is transformed into another. This very process lies at the heart of the entire idea of using nuclear "waste" as raw material. Transuranium: the term "transuranic elements" itself refers to elements heavier than uranium (with an atomic number greater than 92). It is these elements (Plutonium, Neptunium, Americium) that are the longest-lived and most toxic components of nuclear waste. The transmutation of U-238, which makes up 99.3% of natural uranium and is considered "useless" in current reactors, undergoes its own transmutation. Under the influence of fast neutrons, it turns into Plutonium-239 (Pu-239), which, in turn, is an ideal fissile fuel.
Against the backdrop of global transhumanism (the transformation of Homo sapiens into Human v2.0), we are witnessing trans-energetics — the transformation of a wasteful atomic model (where 99% of uranium was considered trash) into a new, sustainable model where all waste is raw material. At this stage of development, although the direction is clear, we are still as far from the widespread global implementation of NRT and closed-cycle technologies as we are from walking to the Moon. This makes the mining and enrichment of U-235 relevant for at least the next 2-3 decades. (Speculators, insiders, huckster and hagglers first need to create a severe deficit and orchestrate a panic-driven rise in uranium prices to blow a bubble, and only after that implement FBR and NRT ideas.)
🧾 5.5 Final conclusion for the first part: The Technological Triad (SNF → Closed Cycle → SMR) is the key to energy and digital sovereignty . It allows for the creation in the near future of autonomous, invulnerable energy hubs for Data Centers, industrial clusters, and remote scientific and military bases, completely independent of global political instability and depleting resources. Power in the 21st century will belong to those who control not oil or gas, but the atomic cycle and the Data Centers/algorithms/DLT/data/AI that it uninterruptedly fuels.
________________________________________
☢️ Part II: Uranium — Fuel for Transhumanism. Charts 2025–2050
________________________________________
6. Where is the world headed? Transformation is everywhere — from atoms to humans. This is the main trend that we are trying to predict, and which we will discuss in more detail in the final part of the article. But first, in this second part, let's examine the price charts for uranium and the companies associated with this sector, where forecasts for the next two decades will be published.
🔬 6.1. Key Players in the Microreactor (μR) Market in the USA and Implementation Timelines
In addition to the major players in the SMR field, the sharpest competition and the fastest deployment timelines are observed in the Microreactor (μR) segment — compact units with a capacity of up to 25 MW, ideal for autonomous powering of Data Centers:
1) Radiant and Kaleidos: Partnership with Big Tech. California-based startup Radiant, with its Kaleidos microreactor (1.2 MW capacity), has become a prime example of the fusion of the atom and the digital. The company has already signed an agreement with Equinix, a leader in the Data Center market, for the supply of 20 reactors. Radiant claims that its units, operating on high-temperature TRISO fuel, can be deployed within days. Main design work is complete, with laboratory tests scheduled for mid-2026.
2) Last Energy: Large-scale Data Center contracts. Last Energy is also actively targeting the data center market, evidenced by their agreement to build 30 microreactors with a capacity of 20 MW each in Texas. These contracts confirm that the Data Center industry is ready to bet on the rapid and mass deployment of small nuclear capacities to secure its critical infrastructure.
3) Oklo and Aurora: Long-term autonomy. Oklo is developing the Aurora microreactor, positioned as a solution with an extremely long operating cycle. Oklo states that its units are capable of operating for up to 20 years without the need for refueling, making them ideal for creating invulnerable, fully autonomous energy nodes.
4) Westinghouse and eVinci: A major player in the micro-segment. Even traditional giants like Westinghouse are actively developing microreactors. Their eVinci project (up to 25 MW) is aimed at industrial and remote sites, proving that the concept of containerized, transportable reactors has become mainstream.
Key conclusion on timing: Unlike mega-projects measured in decades, many startups in the μR segment plan to begin laboratory and even demonstration tests in the 2026–2030 horizon, aiming for commercial operation within the next decade. Demand from Data Centers is the most powerful factor here, accelerating investment and regulatory processes.
⚖️ 6.2. Counter-Trend: State Dominance in Russia and China
While the US and the rest of the "enlightened West" are focused on private startups and microreactors (μR) for Data Center needs (the invisible hand of the market 🖖), on the other side of the scale, "authoritarian and undemocratic" Russia and China have bet on state-owned, full-scale SMRs with proven operating experience (the visible, state hand 🫵 of a planned economy). This allows them to lead in the actual deployment of the technology.
Russia: Operating Experience and Mobility
Russia possesses unique experience in operating SMRs, gained through decades of nuclear fleet operation.
Project: Floating Nuclear Power Plant (FNPP) "Akademik Lomonosov"
Status: The world's first operational SMR prototype in industrial use.
Launch date: May 2020 (start of industrial operation in Pevek).
Capacity: Two reactors of 35 MW each.
Significance: This concept, based on nuclear icebreakers, demonstrates mobility and the ability to provide energy to remote and hard-to-reach regions. This is a direct path to creating autonomous energy hubs for Arctic ports, mining enterprises, and, potentially, large military or digital nodes.
China: Generation IV Reactors and Land-Based Deployment
China leads in the construction of land-based next-generation SMRs, emphasizing enhanced safety.
Project: HTR-PM (High-Temperature Gas-Cooled Reactor)
Status: The world's first SMR connected to a mainland grid.
Launch date: December 2021 (grid connection).
Capacity: 211 MW full power.
Significance: This is a 4th-generation reactor capable of autonomous shutdown in case of failure (passive safety). This technological superiority directly addresses the Fukushima problem and is critical for the global acceptance of nuclear energy.
Project: ACP100 (Land-based SMR)
Status: Currently under construction (at the Changjiang NPP site).
Timeline: Construction of the world's first ACP100 SMR was planned, according to 2021 data, to be completed in 2026.
Significance: The ACP100 is a multi-purpose reactor that China plans to actively export, asserting its technological and commercial leadership in the global market.
Summary list of leading countries' projects:
• USA: Radiant (μR), Last Energy (μR), Oklo (μR), TerraPower (SMR).
• Russia: Akademik Lomonosov (FNPP/SMR) launched since 2020.
• China: HTR-PM (4th gen SMR) grid-connected, ACP100 (SMR) under construction.
At the current moment, Russia and China already have operating SMRs (or are preparing for near-term launch), while Western companies are still in the licensing and prototyping stages.
🔄 6.3. Global Trend Shift and Commodity Supercycle
The main leitmotif running through all previously published ideas related to the commodities market is the shift in the global trend. For those interested, follow the links that will be at the end of the idea. Starting from 2020, a new bull supercycle is developing in the commodities market. This crisis period (which can last 1-3 decades) is usually characterized by high inflation (or conversely, deflation), rising unemployment, and the devaluation of money — in other words, this is a time when life becomes more expensive, and people become cheaper .
The rapid growth of gold since 2020 by +250% is only one of the first "canaries in the coal mine"; the entire commodities sector will follow. The same will happen with uranium prices, which by modest estimates will grow ten or even twenty times over the next 10–20 years, from the current $50–100 per pound to the $500–1000 range . This will be partly due to increased demand (SMRs), but for the most part, the growth will be linked to the fragmentation of global trade, maritime logistics problems, a terrible energy deficit, the devaluation of money 💸 with which this strategic and scarce resource is bought, and, most importantly, the inflation of hype and a bubble in the commodities market (details in the next idea: 🎈Five Bubbles of Technocracy ).
📊 Infographics No. 7 and No. 8: Russian SWU as an Additional Catalyst for Price Growth
Dominance in SWU: Russia, through Rosatom, controls 40-50% of the world market for uranium enrichment services (Separative Work Units, or SWU). This is the most complex stage of the fuel cycle. US Critical Dependency: About 25-30% of fuel for US commercial nuclear reactors comes from Russia. The West does not have sufficient capacity to fill this deficit. A total blockade of Russian SWU supplies to the US at the moment of the final WWIII escalation will be the main catalyst for the hyper-growth of uranium prices. If American reactors have fuel reserves for 1.5-2 years, then a blockade in 2026-2028 will lead to an acute shortage of enriched fuel as early as 2030. Western programs to expand SWU capacities will not have time to fill the 40% deficit by 2030 due to multi-year construction and licensing cycles.
Result: A blockade/sanctions on enriched uranium will create a triple deficit: a raw material deficit ($U_3O_8$), an enrichment deficit (SWU), and inelastic demand from Data Centers—not to mention the current dire global energy shortage.
________________________________________
🔥 6.4. Uranium: The Foundation for Capital Preservation
Today, the uranium sector offers a unique investment opportunity. Let’s refresh the brief historical analysis of uranium prices as reflected on the main live chart:
The First Boom (2000–2007): From a low of around $7 per pound in December 2000, the price of uranium skyrocketed by +2000%, peaking at $148 in 2007.
Correction and Stagnation (2008–2020): A long decline in prices began. As part of a second-wave correction, the price of uranium fell by −88%, bottoming out at $17.50 in late 2016, after which the price fluctuated in the $18–28 range until 2020.
New Momentum (2020–2024): Against the backdrop of the Central Banks' monetary madness and explosive inflation growth, and thanks to aggressive buying by physical funds, the price flew up to the $100 per pound area, gaining +500% from the 2016 bottom. Following the 2024 peaks, prices entered a corrective phase.
📈 6.5. Technical Forecast of the Main Chart and Investment Philosophy
The long-term technical chart for uranium looks strongly bullish, implying a price increase over the next two decades by a staggering +2000-5000%. Locally, however, within a one-to-two-year range, we should expect the completion of a corrective zigzag that originated from the 2024 high. The current decline from $106 to approximately the $50 area by 2027 should be interpreted as a second corrective sub-wave within a large impulse. After this, a further rally is expected with initial targets at $500 and $1000.
Important: The expected growth toward these targets will likely be stretched over 10–15 years. Therefore, this idea is not about how to "make a quick buck," but about where to preserve and grow capital in an era of another global financial crisis, a hybrid form of WWIII, and universal impoverishment.
💰 6.6. Investment Instruments
For your convenience, a public watchlist has been created featuring interesting stocks and ETFs related to uranium mining, enrichment, nuclear power plants, and Data Centers. The list is focused on the most liquid US market, traded in US dollars.
Watchlist: tradingview.com
Let’s briefly go through this list of interesting companies traded on US exchanges (NYSE, NASDAQ) related to uranium, nuclear fuel, and nuclear energy as a whole. The list is divided by segments to help you better understand exactly what you are investing in:
1) Uranium Miners
These companies depend directly on global uranium prices (U3O8) and growing demand from power plants. This is a bet on a commodity deficit.
NYSE:CCJ (Cameco Corporation) : The largest public global uranium producer (Canada, USA, Kazakhstan) and a converter of $U_3O_8$ into $UF_6$. A vertically integrated company with a key role in the global cycle.
AMEX:UEC (Uranium Energy Corp) : A leading uranium producer in the US. Uses the In-Situ Recovery (ISR) method. Actively replenishes physical uranium reserves.
AMEX:UUUU (Energy Fuels Inc) : A leading producer of uranium and vanadium in the US. Also engaged in Rare Earth Element (REE) processing as an additional business.
AMEX:DNN (Denison Mines Corp) : A developer of uranium projects in Canada (Athabasca region), including the large Wheeler River project.
2) Fuel Cycle: Enrichment and Components
These companies convert uranium into finished nuclear fuel and produce key components for reactors. This is a bet on processing and technology.
NYSE:BWXT (BWX Technologies) : Production of nuclear components, fuel, and services for the US government (Navy and DOE). Has a strong defense component and participates in the development of Small Modular Reactors (SMRs) for the military.
NYSE:LEU (Centrus Energy Corp) : A key player in the field of uranium enrichment in the US. The first company to start production of High-Assay Low-Enriched Uranium (HALEU), required for next-generation reactors (SMRs).
3) NPP Operators and Reactor Developers
These companies produce electricity at NPPs and are at the forefront of developing next-generation reactors. This is a bet on the growth in demand for clean baseload generation.
NASDAQ:CEG (Constellation Energy) : The largest operator of nuclear power plants in the US. Has the highest share of unregulated nuclear generation in the country, allowing it to benefit from rising electricity prices.
NYSE:SMR (NuScale Power) : A developer of Small Modular Reactor (SMR) technology. The company is currently in the development and commercialization stage.
4) Investing through ETFs (Exchange-Traded Funds)
Investing via ETFs is a more diversified and often less risky way to gain exposure to the sector than buying individual stocks.
AMEX:URA (Global X Uranium ETF) : Uranium and nuclear components. The largest and oldest ETF in the sector. Provides broad exposure to mining and nuclear component production. URA is an excellent choice, covering both mining and related nuclear technologies.
AMEX:URNM (Sprott Uranium Miners ETF) : Pure-play uranium miners. A more "pure" bet on the uranium sector. Focuses on companies that derive at least 50% of their assets from uranium mining or own physical uranium/royalties.
AMEX:NLR (VanEck Uranium and Nuclear ETF) : Uranium and NPP infrastructure. A broader approach: includes not only uranium companies but also NPP operators and nuclear technology providers.
NASDAQ:URNJ (Sprott Junior Uranium Miners ETF) : Junior (exploration) uranium companies. Focuses on smaller companies engaged in exploration and development. High growth potential, but also the highest risk.
AMEX:RCTR (First Trust Bloomberg Nuclear Power ETF) : Nuclear energy and reactors. Focused on companies related to nuclear energy, including reactor development and nuclear generation.
OTC:SRUUF (Sprott Physical Uranium Trust) : Not a producer, but a physical uranium fund. This trust buys and stores physical uranium, making it an excellent tool for direct speculation on the commodity price. It trades on the OTC in the US, with its main listing as TSX:U.UN in Toronto.
📊 Infographics No. 9 and No. 10. How SMRs Will Change Data Center Energy: 2050 Forecast and Population ≠ Infrastructure
By 2050, it is expected that China will have 346 SMRs, India — 154, and the US — 100. For example, in 2024, Constellation Energy CEO Joseph Dominguez cited forecasts according to which Data Center electricity needs in the US will grow from 17 GW in 2022 to 35 GW by 2030, confirming the need for new energy sources like SMRs. Despite India’s population being 4 times that of the US, it accounts for only about 2.8% of the total number of Data Centers. China, with a similar population size, has 3 times more Data Centers than India.
________________________________________
📈 6.7. Technical Analysis: Long-term Growth Charts (2025–2050) Now let's move on to analyzing the charts of individual companies and ETFs with a forecast for the next 10–20 years. Below, only those charts from the list that have a sufficiently long history and a clear technical and wave pattern will be presented. Other instruments will likely repeat the general dynamics, perhaps with some time lag, some with greater and some with lesser amplitude.
📈 CCJ (Cameco Corporation) This producer has enough history to understand the general trend, which in one way or another will affect all companies associated with this sector.
First Wave: From 2000 to 2007, the first wave of growth was likely formed with a "modest" +3000%.
Correction: This was followed by a long pullback from 2007 to 2020, correcting this impulse by the classic 62% on the Fibonacci grid.
New Impulse: Since 2020, fueled by QE and excess liquidity, the price rose by +1600% by the end of 2025, likely within the first sub-wave of a large third-wave impulse.
Forecast: After another local correction into the $23-40 support zone, an explosive growth of ten thousand percent is predicted. The first modest targets at the top are $1000 and $3000 per share—a 10–30x increase even from the current $90. If you manage to pick up the stock during a sell-off in the $23-40 area, the expected growth to $3000 by 2035 would yield a "100-bagger."
📈 CEG (Constellation Energy)
This chart is still very young (like NYSE:SMR ). Without a long trading history, it is difficult to determine the targets for the coming growth. Since its IPO, the price drew its first wave from $38 in 2022 to $390, which is about +1000% in 3.5 years. During the expected global recession in 2026, a correction of about half of this growth should be expected—in other words, to the $125-150 area. Targets for 2040 are in the $5000 range, which from $150 would represent a 50x growth.
📈 UUUU (Energy Fuels Inc)
Locally, the story is similar. After a correction in the second sub-wave from current levels to the $6–10 area by around the end of 2026, explosive growth with staggering multiples is expected by the late 2030s. The approximate range where the price could be abruptly "repositioned" is a wide span of $300–3000; likely, the stock price will enter a sweeping sideways range for a decade here as part of corrective fourth waves.
📈 DNN (Denison Mines Corp)
This chart is very similar to the previous one ( AMEX:UUUU ), moving in sync with both the price of uranium and other companies in this sector. The general picture is identical: first, a correction to the $1 support zone, which from current levels means a -65% drop by the beginning of 2027. Further growth is foreseen to the first target in the $50 area—a "modest" 5000% growth by 2035, or roughly +500% annually.
Uranium Sector ETF Analysis Investing through ETFs is a more diversified and safer approach, but with less growth potential.
📈 URA (Global X Uranium ETF)
URA is the primary stable fund for the uranium sector, though not with such mind-blowing expected profits as individual stocks. Forecast: Locally, just as with all papers in this sector, against the backdrop of the 2026 global recession, a sharp decline in quotes to the $20-30 support zone is expected as part of a Wave (C) flat impulse in the second wave, followed by a vertical takeoff. The first targets are to refresh the 2011 ATH, followed by a target in the $400 area by 2033–2035, which would be +1500%, or about 150% annually—and that’s just from the fund's revaluation, excluding dividends and compound interest. The next target is $1000 in the 2040s.
📈 URNM (Sprott Uranium Miners ETF)
For this fund directly linked to uranium miners, the picture is very similar to $AMEX:URA. Since 2020, we see an impulsive growth of +600%, followed by several years of sideways movement, likely in a second-wave flat correction (3-3-5). Later, during the market collapse in 2026, this ETF will likely "fold" by -50%, i.e., from the current ~$60 to the $30 area within a Wave C impulse. Only then is long-term growth seen with initial targets in the $500–600 area, or a 15–20x growth by approximately 2035.
📈 EQIX (Equinix, Inc.)
Finally, a brief answer as to why one should not invest in the Data Center sector today, using NASDAQ:EQIX as an example. Equinix, Inc. is the world's leading company in digital infrastructure and data centers (DCs). Equinix provides a platform that allows enterprises, network providers, cloud service providers, and financial companies to unify and connect their core IT infrastructure. After the dot-com bubble burst in 2000–2003, during which the company's shares fell by -99% from $528 to $2, and two decades later, the stock trades slightly above the 2000 ATH, where since 2020 the price has been dangling in the $600-900 range. From the 2003 dot-com crash low, Equinix shares made an impressive +30,000% growth. Let me write that out for you one more time: in about twenty years, the company's shares skyrocketed three hundred times! On one hand, this is enormous growth, but on the other, this twenty-year explosive growth only restored the share price slightly above the 2000 bubble peak, where it has been hovering for about five years.
Therefore, one must accept the fact that the IT/DC/AI sector has already made its main growth over the last two decades. Now it is the turn of the energy and commodities market to provide for the needs and demands of that very tech sector. And the start of the commodity supercycle from 2020, also lasting approximately two to three decades, fits perfectly into this logic.
⚖️ 6.8. Ratio: Gold VS Uranium
Also, at the end of the second part, a few words should be said about the weight-for-weight barter valuation: the OANDA:XAUUSD/COMEX:UX1! ratio of gold vs. uranium. To better understand the prepared live Gold/Uranium Ratio chart, it should be published as a separate idea so that its dynamics can be clearly tracked in the future. After studying that small separate idea, return to the final third part of the article.
________________________________________
☢️ Part III. Thoughts on the Future of Civilization: The Invulnerable "System" and Human v2.0🧠
________________________________________
7. Formula for the future: DC💻+ SMR🔋× Satellite📡 = Digital Concentration Camp🌐 The combination of a local, carbon-free power source (SMR) with hyper-distributed computing infrastructure (DC) and global, invulnerable connectivity (Satellite Internet) creates immunity to rolling blackouts, climate catastrophes, and sabotage, and provides digital sovereignty independent of national borders and old, vulnerable infrastructure. It is SMRs that are capable of providing this stability, making them ideal partners for giants like Amazon, Microsoft, or Google—the largest DC operators. This absolutely autonomous circuit is the technological foundation upon which the "System" will be built according to the futurological Human v2.0 scenario, which we will discuss in the final part of the idea.
🛡️ 7.1. Technological Foundation: The Invulnerable "System." The Concept of the Resilient Digital Grid
The concept of a hyper-distributed, autonomous digital infrastructure based on the triad (DC + SMR + Satellite) essentially creates a "refuge-network" that elevates fault tolerance to a new, absolutely inaccessible level:
A. Geographic Distribution and the "Hydra" Effect: To inflict critical damage on an autonomous network, a coordinated attack on thousands of targets simultaneously would be required, which is impossible. Disabling one node does not affect the operation of the others, as they have their own energy sources (SMR) and connectivity (Satellite).
B. Energy Autonomy: SMR-powered DCs will continue to operate 24/7/365, using fuel that will last for years. Many SMR projects are designed for deep underground or underwater placement, providing physical protection against conventional weapons and sabotage.
⛔ 7.2. "Foolproof" and Malice Protection
In this context, the "fools" can be incompetent politicians, and "malice" can come from hostile states or late-awakening "insurgent-partisans" wishing to turn back the clock.
The Impossibility of "Deplatforming": Satellite internet (Starlink, OneWeb) operates on a global level, sitting outside the jurisdiction of any single country. To shut down the network, one would need to destroy/neutralize the entire satellite constellation.
Physical Inaccessibility: An attack on a small, autonomous, energy-independent point far from civilization has low strategic value, making it impractical. An attack on a nuclear facility, even a small SMR with Plutonium-239 (Pu-239) on board, carries catastrophic collateral damage: sabotaging just one such station could make the surrounding territory uninhabitable for hundreds of years. This factor of nuclear deterrence protects against late-awakening insurgents, turning every station into a miniature atomic fortress where an attack is equivalent to suicide.
Deterrence for Rebels: For irregular formations or partisans, this is an absolute stop-factor. If their goal is to "restore the past," destruction makes the land itself unfit for future generations. An act of sabotage becomes an act of genocide on one's own territory, making it impractical, irrational, and immoral even for the most radical groups.
⚡ 7.3. Assessing the Global Energy Deficit Current Level: Today, global energy consumption is at a level that allows only the "Golden Billion" (G7 countries and developed parts of Asia) to live comfortably. True Need: Experts estimate that to raise the standard of living for all 8 billion people to this standard, the total volume of electricity generation must increase not just 2-3 times, but 6-8 times! This is a severe energy famine of 6–8x. Taking the path of least resistance, it is easier to reduce the population by half than to increase energy production eightfold with current technologies. Therefore, the Technocracy does not seek to solve the problem for 8 billion "paupers"; it seeks to monopolize the minimum of high-density energy required for its own digital sovereignty (DC) and survival (SMR), leaving the "plebs" with renewables and an energy deficit.
👁️ 7.4. Brave New World of Cyberpunk
This technological triad creates the perfect conditions for a cyberpunk or even dystopian scenario:
◽️ 1) Strengthening the Gap and Isolation The System, operating on its own independent infrastructure, detaches itself from the "plebs" who depend on outdated, unreliable, and easily controlled grids. Two Worlds: There is the "World of the System" (fast, reliable, autonomous) and the "World of the Ordinary User" (slow, subject to censorship and failures). The physical world may crumble, but the "System" will operate uninterrupted, managing its assets (banks, military, robots). While for the last 20 years wild Africans and Arabs (who only 50-100 years ago traded camels for Maybachs) have been brought into Europe, and nuclear plants are demonstratively closed in the (former) industrial locomotive of the EU (Germany), technocrats are developing autonomous peaceful atoms for DC needs, not for the "aborigines" arriving there. For them, in the new European Islamic Caliphate (on the ruins of the former EU), wind turbines will suffice...
◽️ 2) Absolute Control and Surveillance An invulnerable, distributed network of DCs with guaranteed power allows the System to carry out total and continuous monitoring, thereby creating a networked AI-state , where not a single transaction or act of digital communication is lost. SMR-DCs provide the computing power needed for AI-governance, predicting uprisings, or instant punishment.
◽️ 3) Emergent Sovereignty This system creates a new kind of sovereignty not tied to state borders. Power belongs to those who control the autonomous nodes and the satellite network. This is the beginning of the end for nation-states. If mega-corporations or transnational organizations control these thousands of SMR-DCs, they are effectively building a networked virtual SUPER-state before our eyes, which cannot be attacked by conventional means.
◽️ 4) Division by Functional Value Unlike "nation-states," where borders are defined by "nationality"—a blend of cultural, ideological, and religious concepts (the old Software of isolated groups of people)—the networked virtual SUPER-state will divide citizens by their objective, quantitatively measurable value to the "System." This division is not based on passports or faith, but on: a) Critical access to autonomous DC/SMR/DLT infrastructure (key control); b) The level of neuro-biotechnological integration (readiness to become Human v2.0); c) Economic/computational utility to the AI-state. d) The civilizational code of the constituent peoples and their subconscious conceptual and ethical systems (the ancient Firmware). Thus, the SUPER-state creates a global caste system , where the boundary between an "exemplary citizen" and a "surplus human" is technological, genetic, and ethical, rather than cultural or religious. (See films: Gattaca 1997 | Elysium 2013).
◽️ 5) The Era of Techno-Geopolitical Confrontation In the initial stage, driven by the desperation of technocratic progress and the rebirth of nation-states into local networked virtual SUPER-states , fierce competition and conflicts over physical resources and human capital will inevitably arise. Since various racial and cultural differences (East, West, South) inherited from the old world will still serve as a temporary but powerful obstacle to the premature transition into a single One World Digital Government . These cultural-ideological "barriers" will be cynically used by techno-elites as a tool for proxy conflicts, cyber wars, and the deplatforming of competing network structures. Thus, SUPER-states will initially have a regional ideological/cultural basis before finally abandoning it in favor of a purely functional caste division with an emphasis on genetic and civilizational codes.
🟡 Summary: The Formula (DC + SMR + Satellite) is not just a technological breakthrough. It is a blueprint for creating an immortal, invisible, and uncontrollable global management structure. This invulnerable System gives birth to new, competing networked SUPER-state corporations. Their main divides run not along nation-state borders or cultural traits, but along:
Technological Access: Who controls the autonomous SMR/DC nodes.
Functional Value: A person's place in the new technological and genetic caste system.
The scenario in which the technological triad SMR/DC/Satellite is not just a management tool, but the foundation for a post-cyberpunk, transhumanist SPECIES CHANGE on the planet.
Great Reset — Installing... Brave New World of Cyberpunk — Downloading...99.9%
________________________________________
🔮 7.5. Main Futuristic Scenario: A 100-Year Forecast (Human v2.0)
________________________________________
Scenario: Depopulation as a Condition of Technocracy So, based on all the information presented above, here is a scenario for the XXI century, combining analytical logic, futurology, "conspiracy theory", esotericism, and other domains. Rapid demographic reduction is not a consequence of maximum technocratic development, but its necessary CONDITION! The System "clears" the territory, eliminating the inefficient human factor before establishing its absolute, invulnerable rule.
🚷 Phase 1: The Great Contraction (2020–2040)
◽️ Managed Reduction: The population decreases to 4 billion (from the current 8). This is not an accident, but the result of a cascade of interconnected and pre-planned crises: ( Dumbassvirus (2020-2022) → Hybrid WWIII (2022-2028) → Great Depression v2.0 (2028-2033) → Famine (2033-2035) → Death (2035-2050) ).
◽️ The Result: The culmination of the systemic crisis of capitalism, the replacement of the old liberal world order through the "Great Reset," and a shift in the economic and technological paradigm where AI and robots make the majority of "upright bipedal primates" economically redundant. The System no longer needs a mass consumer or the maintenance of acceptable employment levels; the illusion of "elections" are abruptly discarded, leading to a global social collapse . Parallel to this chaos, the Technocracy actively builds autonomous, protected energy-digital nodes using SMR technology so it can continue to function uninterrupted, independent of the unstable general (traditional) power and internet grids left for the plebs, which will rely increasingly on wind and solar.
Brave New World of Cyberpunk — Loading...33%
⚰️ Phase 2: Consolidation of the System and Human v2.0 (2040–2060)
◽️Consolidation: The power of Luciferian/Satanist technocrats is solidified, and the population is further reduced to 2–3 billion.
◽️Transhumanism: The remaining population, integrated into the new order, undergoes HET (human enhancement technologies) neuro- and biotechnological optimization, becoming Human v2.0. These "new advanced" humans are loyal, efficient, and emotionless (see the film Equilibrium 2002).
◽️Isolation: The "backward" ones who do not accept the transformation are deprived of access to technology and pushed into "reservations-colonies," much like Native Americans in the US (karma is a resilient thing). This leads to their accelerated extinction through 🦠 new artificial epidemics 🧪 (biological/genetic weapons).
◽️Phase Result: Technocracy achieves total victory over chaos and "surplus people." The territory is "cleared" and prepared for the final stage.
〽️ Phase 3: The Peak of Technocracy and Providence (2060–2???)
◽️Hubris: The System, relying on hybrids and robots managed from invulnerable energy-digital nodes (SMR+DC/AI/DLT+Satellite), is confident in its eternity and absolute security. It is precisely this hubris and absolute efficiency, severed from the spiritual essence, that creates a critical imbalance.
◽️Divine Providence: An unpredictable, cyclical factor enters the fray, one that could not be accounted for by the cold logic of AI: a planetary cataclysm (a natural act beyond the control of technology).
◽️The Reset: The catastrophe resets the very infrastructure of the Technocracy. Spiritually, only those rejected by it survive: enlightened and non-genetically modified humans living in "reservations" who have maintained their connection to the Almighty through the Soul , preparing the ground for the beginning of a New Cycle.
________________________________________
🕊️ 7.6. Alternative Scenario: Evolution of Consciousness (Human v1.1)
________________________________________
This scenario offers an ethical and spiritual breakthrough as a response to the threat of Human v2.0. It asserts that technology can be used for the benefit of Humanity and the planet without changing the human being into a soulless hybrid . The changes in the human are minimal but qualitative — hence the term Human v1.1 .
💔 Phase 1: Ethical Turning Point Amidst Crisis (2020–2040) A 50% depopulation by 2050 is an inevitable consequence of the inertia of the old system and pre-planned long-term global processes often called the "Four Horsemen of the Apocalypse." However, against the backdrop of this chaos, a powerful Alternative Light Force (ALF) emerges. It proclaims a different concept of globalization and management, where SMR/AI/DLT technologies are used to enhance human abilities (increased empathy, collective intelligence) and decentralize power.
🧬 Phase 2: Symbiosis of Technology and Spirit (2040–2060) Balance: Once the population is reduced to 2–3 billion, and the Alternative Light Forces (ALFs) finally extinguish the infernal Satanist- technocrats, depopulation stops. The Avatar of the Antichrist AI is reprogrammed from a False Prophet manager-algorithm serving dark forces into a planetary coordinator serving the ethical goals of the enlightened Human v1.1 . Humanity, free from the struggle for survival, begins for the first time to develop its intellectual potential , using technology for the perfection of the eternal consciousness , not the mortal body!
🔭 Phase 3: Reprieve and a New Horizon (2060 and beyond) This path offers hope that the collapse of technocracy can be postponed indefinitely. If Human v1.1 — a human with an unaltered, free soul but ethically enhanced consciousness — proves their wisdom, the need for external intervention and cleansing disappears.
🌌 Cosmic Civilization: Humanity, having restored harmony with the planet, moves to a new stage — that of a Cosmic Civilization. Here, Homo Sapiens becomes not just a textbook name, but the true definition of the species: Man the Wise , ready for contact with other civilizations to exchange experience and technology. For it is only with such a wise and ethically stable being that any contact with vastly superior light extraterrestrial civilizations is possible.
(For the continuation and detailed disclosure of this scenario, look for the article: The Fall of New Babylon. Prophetic Synthesis 2020–2050 (only in Russian language), scheduled for publication on Chinese New Year, February 17, 2026 .)
________________________________________
🏁 7.7. Final Part of the Article. The Price of Digital Immortality 🧟♂
________________________________________
7.5. And so, we have completed our deep dive into the world of the Nuclear Renaissance. If you have read this long-read to the end, congratulations: you do not belong to the crowd suffering from "kaleidoscopic cretinism." You are likely a person oriented toward the long-term perspective, where the year 2050 is no longer an abstract fantasy but a visible horizon for strategic planning.
The essence of this analytical article is simple and harsh. It boils down to five strategic theses:
1️⃣ The problem is solved, but not for everyone. The inevitable shortage of U-235 in the next 50–100 years is not a dead end. It is a technological imperative. It forces the transition to a closed fuel cycle and SMRs, where U-238 and accumulated SNF turn into "free" fuel thanks to NRT (Nuclear Recycling Technology). The owners of this technology will secure their own new energy for at least a century ahead.
2️⃣ Energy and Power are indivisible! Mastery of this technological synergy — SNF → Closed Cycle (NRT) → SMR — is not just a competitive advantage. It is the key to future energy and digital sovereignty and power .
3️⃣ The Invulnerable Circuit: The Triad of DC + SMR + Satellite. Future dominance will be ensured not just by SMRs or DCs individually, but by their integration with digital infrastructure. Placing compact SMRs in the immediate vicinity of Data Centers creates local, invulnerable energy circuits, while satellite internet provides them with an autonomous communication channel, inaccessible to control or sabotage by national jurisdictions.
4️⃣ Commodity Super-cycle and the Devaluation of Money. Rising demand for uranium and the forced transition to new technologies ensure that investments in raw material extraction and SMR development companies will remain strategically attractive for decades. This is not a temporary hype, but a bet on a structural shift where commodity scarcity, inflation, and the devaluation of "scraps of paper" 💸 become an additional powerful engine of growth.
5️⃣ Human v2.0 or Human v1.1? As we discussed in Part III, this technological base is the foundation for building a new, compact, and efficient technocratic System. This System, fueled by "infinite" atomic energy from reprocessed waste, will be capable of fully controlling its energy and digital circuit in the future, without needing today’s eight billion "freeloaders" hooked on the dopamine loops of TikTok, Instagram, and other social networks of the "spectacle of successful success." In the second half of the 21st century, a harsh "hard fork" awaits us, depending on the reality into which humanity, and each of us individually, falls.
Ultimately, today's investment in ⚛️ uranium is a strategic investment in that future world order where dominance will belong to those who control the atomic cycle and the Data Centers/algorithms/DLT/CBDC/data/AI that it uninterruptedly fuels.
It only remains to decide which side you want to be on when the brave new world of cyberpunk arrives...
Support this idea with a 🚀 rocket and a constructive 💭 comment so it doesn't drown in the ocean of useless information noise.
🙏 "Thank you for your attention to this matter"©
☘️ Good luck, take care!
📟 Over and out.

Gold vs Uranium: Barter Valuation. Forecast to 2040❗️** Disclaimer: ** This idea is part of a larger comprehensive article on Uranium. To fully understand the context and the big picture, please refer to the main article at the link below:
☢️ Uranium: Defining the Future. 2025–2050 Vision & Forecast
⚖️ Gold vs Uranium: Barter Valuation. Forecast to 2040
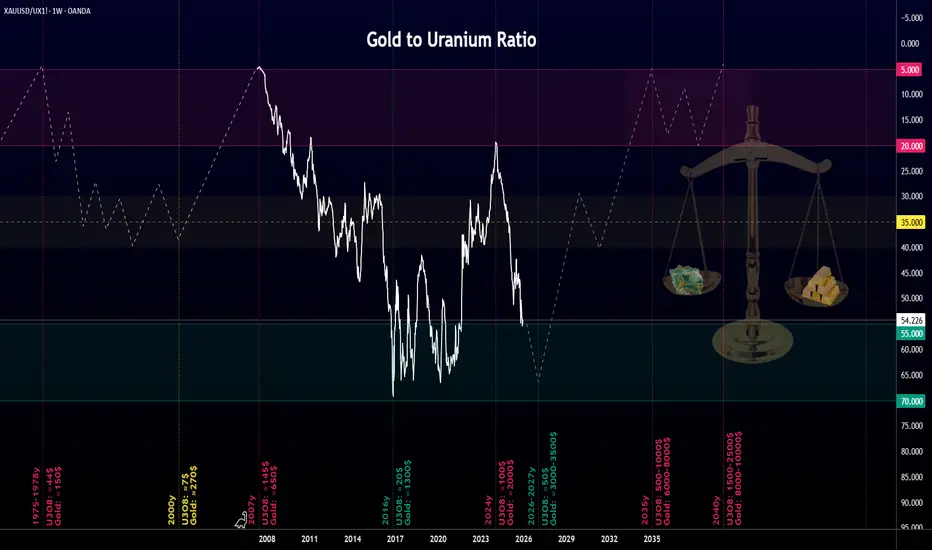
Investing in U3O8 is not a bet on temporary hype, but on a structural shift where energy sovereignty becomes more valuable than money. To assess the true value of uranium, undistorted by inflation, we use the barter GOLD/Uranium Ratio . This chart shows how many pounds (lb) of uranium can be purchased with one ounce (oz) of gold.
Historical Context and Ranges
For better visual perception, the chart is inverted and divided into three zones:
🔴 Red (5–20): Range of "expensive" uranium.
🟡 Yellow (approx. 35): Historical median. Equilibrium barter price.
🟢 Green (55–70): Range of "cheap" uranium.
Historically, the Au/U ratio spent the vast majority of its time in the 5–40 lb per oz range, fluctuating there for nearly half a century (from the 1960s-70s to 2016). After 2008, the orgy of serial QE (Quantitative Easing) led to severe distortions not only in the ⚖️ Gold/Uranium Ratio , but also in the ⚖️ Gold/Silver Ratio , ⚖️ Gold/Oil Ratio , and ⚖️ Gold/Sugar Ratio .
📊 Key marks highlighted on the chart demonstrate the volatility:
🔴 1976–78 (Ratio ≈3.5): At the peak of the first nuclear boom caused by the oil crisis, uranium was at the peak of strategic importance ($40–44 per lb), making the ratio minimal.
🟡 2000 (Ratio ≈36): This was the bottom of the "nuclear winter." The market was flooded with weapons-grade Uranium (Megatons to Megawatts). Uranium was at its cheapest ($7 per lb).
🔴 2007 (Ratio ≈4.4): The second speculative peak. Explosive growth fueled by the realization of scarcity. The price of uranium rose by +2000%, reaching an ATH of $148, once again making the ratio minimal (as in the 70s).
🟢 2016 (Ratio ≈69): This is the absolute historical maximum, where uranium ($20 per lb) was most undervalued relative to gold and the US dollar. This was the point of maximum strategic undervaluation.
🔴 2024 (Ratio ≈20): Since the Covid hysteria, the ratio sharply recovered to its normal historical values, first to the (🟡yellow) 35 area, and then down to 20:1. During this time, uranium prices rose by +500% from the $17.5 low (in 2016) to the $106 high (in 2024). After such a sharp rise, a correction in uranium prices followed from the 2024 peaks, with the ratio expanding again from 20 toward the 40-55 lb per oz area.
🟢 Forecast for 2026–2027 (Ratio ≈60): A temporary pullback. It is expected that against the backdrop of a global recession (2025–2026) and the ongoing correction (from $106 toward $50 per lb), uranium prices—along with gold—may temporarily decline. The ratio will expand again toward the borders of "cheap" uranium at 55–70:1 . The projected phase is a strategic "golden opportunity" to acquire the asset before the new cycle of atomic explosive growth.
🔴 Forecast to 2035–2040 (Ratio 5-20): The Culmination. In the 8–15 year horizon, when SMRs begin mass-powering Data Centers, the deficit will become critical and the hype (similar to today's AI) will hit its peak. The Au/U ratio will first return to its historically "fair" yellow 30-40, and then enter the red 5–20:1 range.
🧮 Technical Justification of Long-Term Targets
Let’s solve this math problem using the formula:
A/B = X
Where X is the unknown future price of uranium in USD, A is the expected price of gold, and B is the expected Gold/Uranium ratio.
If we conservatively assume that gold rises to $8,000 by 2035 (which is only +80-100% from current levels), and the Au/U ratio returns to 10–20:1, we get a uranium price in the $400–800 per lb range. If, at the culmination of the explosive growth, the GOLD/Uranium Ratio hits 5:1 (as observed in the final growth stages of 1977 and 2007), the price of U3O8 would reach $1,600 per lb. Therefore, long-term forecasts with bold targets of $500, $1,000, and even $2,500 per lb are not outrageous or impossible.
Consequently, the projected peak of the new growth cycle should be expected within the red zone (5-20), defined as the "expensive" uranium range relative to gold. This is simply mathematical confirmation that amidst rising inflation, severe scarcity, global logistics issues, ever-increasing demand from Data Centers, and the inflation of yet another Technocracy bubble, Uranium will return to the red zone over the next 7-10 years, positively impacting the cost of U3O8 in US dollars.
❗️ Disclaimer: This idea is part of a larger article on uranium with a forecast for 2025-2050. To fully understand the context and the big picture, please refer to the main article at the link below:
☢️ Uranium: Defining the Future. 2025–2050 Vision & Forecast
HLU - Trio Retest: Where Structure Meets Opportunity!Homeland Uranium TSXV:HLU just secured a long-forgotten 35-million-pound uranium deposit in Colorado, originally discovered in 1979 and abandoned when the nuclear industry collapsed.
With uranium prices up 141% in four years , and global demand expected to jump another 28% by 2030 , Homeland is positioning itself inside a powerful multi-year commodity cycle few investors are watching.
Add AI-driven power demand, national security concerns, and new U.S. policies fast-tracking domestic uranium, and HLU becomes a high-conviction asymmetric energy play.
📊 Technical Analysis
After surging by over 160% , HLU has been in a healthy correction phase, trading within the falling channel marked in red.
However, from a long-term perspective, HLU remains overall bullish, trading within the rising broadening wedge pattern.
The orange circle represents a massive rejection point, the intersection of three confluences, what I call a TRIO RETEST :
- The lower bound of the rising wedge pattern
- The lower bound of the falling channel, acting as an oversold zone
- The structure marked in blue
As HLU approaches the orange zone, we will be looking for trend-following longs.
For the bulls to confirm long-term control and kickstart the next big impulse upward, a break above the falling red channel is needed.
💡 Bigger Picture
Here’s why the fundamentals add fuel to the technical setup:
- A $2.7B uranium prize reclaimed for pennies: Homeland acquired a 35-million-pound U.S. uranium deposit for just $0.15/lb, material now worth nearly $80/lb.
- Trump’s Day-One energy orders: New executive actions prioritize U.S. nuclear power and domestic uranium production. Homeland controls a rare U.S.-based asset right as the policy tide shifts.
- AI is outgrowing the grid: Microsoft, Google, and Oracle are moving toward nuclear due to soaring power needs. Homeland owns the fuel they’ll need.
- National security tailwind: The U.S. imports 98% of its uranium. Russia banned exports. China is hoarding supply. Homeland’s American deposit is uniquely strategic.
📘 Bottom line
HLU is sitting at a key technical zone while the macro, political, and energy narratives align in its favor. If the TRIO retest holds, the next bullish impulse could unfold from a position of both structural and fundamental strength.
📌 Always do your own research and consult your financial advisor before investing.
📚 Stick to your trading plan, entry, risk management, and execution.
All strategies are good, if managed properly.
~ Richard Nasr

Uranium Energy Corp Weekly Outlook (Count 1)Here is my weekly outlook on AMEX:UEC .
UEC is one of my bigger holdings, I've added at various times as shown on the chart (see green dashed lines).
In this outlook i am viewing the price action from the lows in Mar 2020 to the end point of wave (1) as a leading diagonal pattern. After that we have seen wave (2) and another wave 1 and 2 in the red degree (red wave 2 may not be complete yet).
Are we next going to see a breakout in red wave 3? the case for this will be helped if the COMEX:UX2! Uranium Futures chart plays out as predicted along with LSE:YCA & TSX:U.UN ...see my linked charts
More comments on the chart!
Note: My analysis is more focused on price levels as opposed to wave duration, so bear that in mind if you see a particular price level at a certain date in the future and think i'm rigid on both price and time.
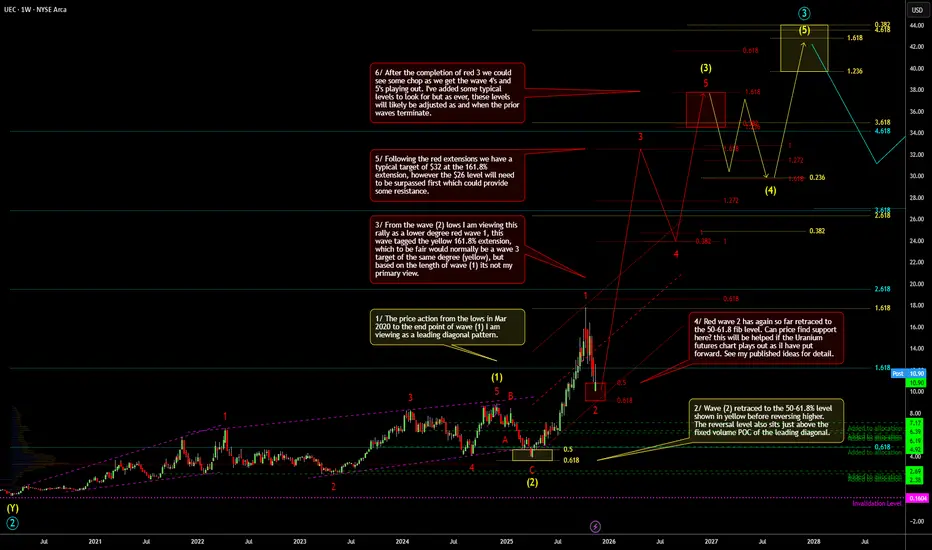
Urally Need To See ThisUranium is poised for a move. Charts show demand is ramping up and supply is slow to catch it as world leaders slowly catch on to it's inevitable necessity. As long as commodities hold up, URA should stay on trend and begin to take it's next leg up from the bottom of the channel.
Should prices break down, it could mean a plunge lower to the fib retracement levels. Sooner or later though, the yellow cake wants to go to 66

UX2! Uranium Futures Daily OutlookDaily update on the previously posted weekly outlook on COMEX:UX2! Uranium futures. Price is potentially making a i, ii, (i), (ii) with a bullish outbreak looming. Nice moves today on LSE:YCA and TSX:U.UN which i have covered recently, but need to update. The miners have moved more, haven't checked the news, but if Spot breaks out as the chart suggests then not going to hurt the upside is it!! More comments on the chart.
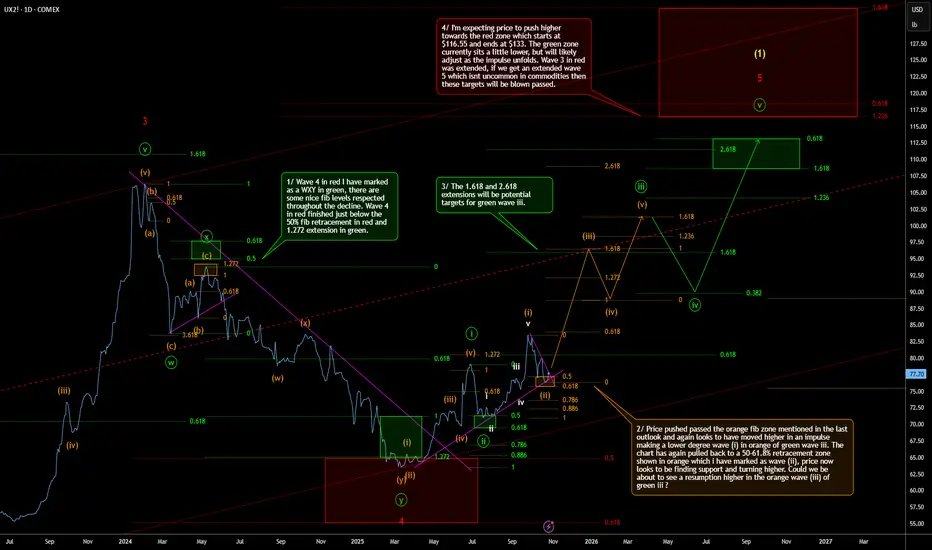
Natural Gas Full Bear After Inventories!Natural GAs plummeted today on inventory report.
The consensus was for 76BCF build but came in higher at 80BCF build.
This demonstrates less demand and higher production.
The technical picture is slowly starting to breakdown for Nat Gas...the bulls need to do something quick to firm up price or we run the risk of the weekly downtrend taking hold.
next key area to watch will be a retest of the 3.30 zone.
Simultaneously you need to be monitoring inter market analysis (ie. watch Nat gas resource stock to see how their price action responds).
We booked profits on a small Boil long scalp today.


Daily Outlook On YCA Yellow Cake PLCThis is my Daily time frame outlook on LSE:YCA . In the weekly view I posted recently I was looking for a breakout of the consolidation in wave 3, so far this looks to be playing out. I'm again looking for a continuation higher. I did add to my position shortly after posting the weekly outlook, declared on X but forgot to mention here, entry is shown on the chart. Spot uranium looks to be moving higher, potentially in a wave 3, and again in line with my outlook. So as mentioned on the chart comments, the levels of the impulse could get stretched if spot really gets moving.

Macro & Technical Signals: IWM, Uranium, Dollar, Oil, ALAB, LULUIn todays video we discuss the breakdown in small caps and high beta stocks.
A macro shift could be unfolding today as we saw the dollar & oil rally all day.
Uranium & gold saw some distribution.
Financials reversed off the highs.
High Beta stocks that have rallied are softening up.
SPX has triggered a near term bearish pattern while losing the 7 day MA.

PDN Long triggers on PDN IF we get the pullback this is where il look to take a long.
If Price trade below Range low and holds Idea is wrong and its time to re-evaluate
Uranium

$dylTwo Trigger plans marked out on chart,
1. A push down take liquitity marked in orange and a reclaim of the mide range = trigger 1
2.A fast push into range low and hold the "Big quartely level" = trigger 2
#uranium
#dyl

$pdn$pdn.ax ASX:PDN
Still just range bound, deviated the big Quaterly level and now trading into the Big yearley level..
pullback almost 33% so far
Plan marked out on chart..
Under, then trigger once back over.. Then a resending back to into green zone..
Not a prediction
#uranium

$UUUUTrump’s executive orders to ease Nuclear reactor regulations and improve fuel supply chains, boosting nuclear energy demand.
Before 2025 started, once Trump won the election I was certain he would eventually pass executive order(s) and/or make political deals to ease nuclear reactor regulations and improve fuel supply chains, naturally boosting nuclear energy demand. This does not just affect AMEX:UUUU it also affects most of the Nuclear Energy stocks and Uranium-related stocks, like AMEX:UEC , NASDAQ:CEG , NASDAQ:NNE , NYSE:OKLO etc.
We should see most of these stocks continue to grow in value throughout 2025 at the very least. I don't know yet how they will fair in 2026 though 2025 should continue to be a good year for nuclear energy and uranium stocks :)

LTBR Lightbridge-Any Day Now LTBR is on the cusp of a violent move, strongly favored to the upside. Timingwise, This should break within days. Should it break soon, the potential for a very violent move is on the table assuming new highs will be reached, by the FOMC meeting. This would likely coincide with a intermediate market top on the FOMC meeting SEPT17

LTRlooking to trade green box in the coming weeks/months as LIT etf has broken out LTR is back inside range with big deviation of range low
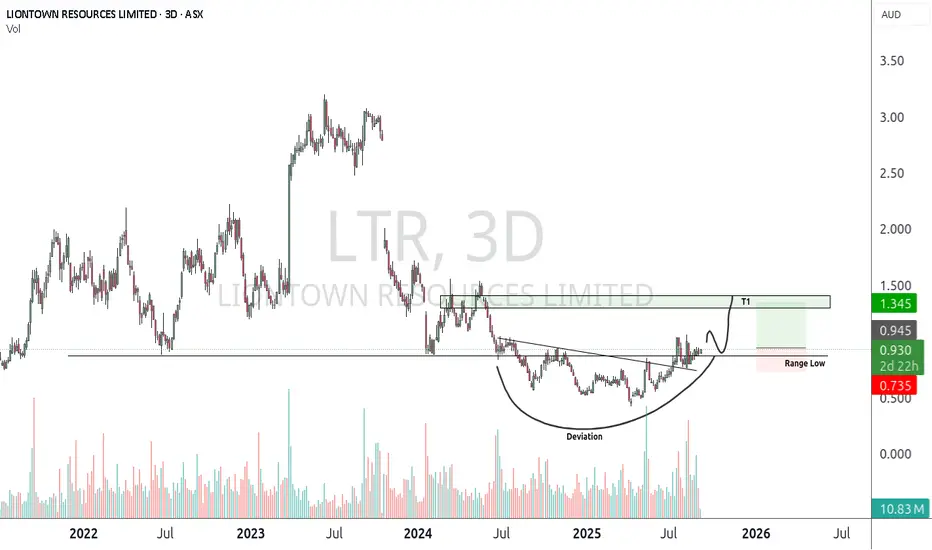
Tesla, Nio, XPEV breakout ahead of NVdA earnings tomorrowTesla is breaking out of a daily chart wedge pattern.
This pattern suggest a move to 400 could occur as long as the indices don't fall on NVDA earnings.
If you look at how some of the China ADR EV companies have performed, Tesla could be well on its way to replicating a move.
All eyes on NVDA earnings tomorrow. Heading into the print with a 58 PE and looking like it wants new highs.
NVDA guidance will once again be crucial for the market. $46B revenue estimate is likely to be beat.
We secured profits on the massive nuclear pop today. SMR calls printed over 100%

Denison Mines: A very bullish chartDenison Mines is on the verge of breaking a 14 years consolidation.
The whole sector of uranium has been very strong in 2025 but the price of uranium itself hasn't moved that much and neither most of the small and mid cap names in the space. I'm expecting those to start waking up soon and when they do, their moves can be very powerful.
"The longer the range, the bigger the breakout" is a famous quote in trading. Let say how this one plays out above $2.45.

New Bear Market? Heavy Tech SelloffToday the markets were shattered by weakness in mega cap tech.
All major leading companies in the QQQ were severely down.
We saw the majority of the S&P 500 sectors green with health care leading the charge.
Despite all indices closing negative this was not a full fledge market sell.
Commodities were hit across the board. Gold, Nat gas, Oil, Uranium, Silver were all down.
It seems the market is de risking into J Powell Jackson Hole meeting on Thursday / Friday.
Today we closed out NASDAQ:MSFT NASDAQ:PLTR short & trimmed AMEX:MSOS puts for over 105%
We were very active on the option and swing trading side of the market.

Don’t miss this Move on LTBRLTBR forming a classic cup and handle with confluence in the timing of recent institutional exposure.
The chart speaks for itself
