S&P500 This is the level that confirms the Bear Cycle.The S&P500 (SPX) has reached a point where it could be on the verge of initiating a new Bear Cycle as the price action that led to the end of 2025 (mostly Q4) has been very similar with the one in late 2021 that kick-started the 2022 Bear Cycle.
What confirmed that Bear Cycle was the market closing a 1W candle below the 1D MA100 (red trend-line). This is extremely critical as it has already proven its role as a catalyst during the most recent short-term pull-back in November, where it held upon tested on the week of November 17 2025 and thus rebounded. This is exactly what took place in November 2021, with the index eventually closing a 1W candle below the 1D MA100 almost 2 months later on the week of January 17 2022. That confirmed the 2022 Bear Cycle as the sell-off was accelerated and in just 1 week, the market even hit the 1W MA50 (blue trend-line).
The structure between the two fractals is so far very similar, with a huge 1W RSI Bearish Divergence (Lower Highs against price's Higher Highs) leading the index towards a potential Top. If the price action continues to repeat that of 2022, then we are looking at the very real possibility of a -27.60% overall correction within roughly 12 months time, with the first potential Target being the 1W MA200 (orange trend-line) around 5350 and second the full -27.60% extension at 5050. Those two levels technically form the potential Buy Zone for the next Bull Cycle.
The metric though that cannot be ignored as far as long-term buying is concerned, is the 1W RSI, which has historically given optimal buy opportunities when it turned oversold (i.e. 30.00 or below). If this level is hit before any of the above two Targets, we will be turning into long-term buyers again regardless.
---
** Please LIKE 👍, FOLLOW ✅, SHARE 🙌 and COMMENT ✍ if you enjoy this idea! Also share your ideas and charts in the comments section below! This is best way to keep it relevant, support us, keep the content here free and allow the idea to reach as many people as possible. **
---
💸💸💸💸💸💸
👇 👇 👇 👇 👇 👇
Us500

SPY Weekly Outlook – Week 1 of 2026SPY Weekly Outlook – Week 1 of 2026
Technical Look:
Price moved exactly as planned in my December 21 Weekly SPY outlook (you can check the linked idea). The market bottomed on December 17, which was also anticipated in my December 14 Weekly SPY prediction. After that, price pushed into all time highs and got rejected from those levels.
Currently, SPY is retracing from the highs and appears to be seeking additional liquidity and energy before any continuation higher. This consolidation phase may take longer than initially expected.
Scenarios – Prediction:
I am tracking two main scenarios for SPY during January 5–9.
Scenario 1: Bullish Scenario
The 684 level is marked as an options put wall. I will be closely watching for a 4H close above this level.
A confirmed 4H close above 684 would indicate that the bullish scenario is in play, and I would look to engage on the long side.
Potential upside targets for this scenario:
686.75 – 689 – 691.75
Scenario 2: Bearish Scenario
If price fails to break above 684 and starts declining, I would consider that SPY is seeking lower prices.
Downside targets in this scenario:
678.75 – 673 – 669.25
If price breaks 678.75 aggressively , I would then consider lower targets to be in play. Otherwise, the 678.75 level could act as a strong bounce zone for a potential upside reaction.
Position Management Notes:
Each target level may cause significant pullbacks or reversals. Personally, I take partial profits at these levels and keep the remaining position open toward the next targets, while trailing the stop loss to breakeven. This is how I manage my positions.
I share deeper US Market breakdowns and weekly scenario updates on Substack. Link is in my profile.
Disclaimer: This analysis is for educational purposes only and reflects my personal opinion. It is not financial advice.

S&P 500 Showing Seller Weakness After Multiple Corrections — BreSummary
The S&P 500 has completed three consecutive corrective phases from the 6945–6922 zone, signaling weakening downside momentum and increasing potential for a bullish continuation.
Technical Analysis
The S&P 500 index has experienced three successive corrective moves originating from the 6945–6922 price zone. These corrections have unfolded in the form of long, medium, and short waves, a structure that typically reflects exhaustion during the corrective phase rather than the start of a strong bearish trend.
The decreasing depth and duration of each corrective leg clearly point to seller weakness and diminishing downside pressure. Buyers are increasingly absorbing supply, suggesting that the market is preparing for a potential impulsive move higher.
From a price action perspective, the market is consolidating and compressing below resistance, creating conditions favorable for a volatility expansion once a key level is breached.
Trading Scenarios
Scenario 1 – Higher Risk (Aggressive Entry):
Traders may consider entering near one of the recent price lows, accepting a higher level of risk in exchange for an early position. This approach is based on the assumption that the corrective phase is complete and a strong bullish impulse may follow.
Scenario 2 – Lower Risk (Confirmation Entry):
A more conservative strategy is to wait for a clear breakout above resistance, confirmed by a strong bullish Marubozu candle. This provides momentum confirmation and reduces the probability of a false breakout.
Key Levels to Watch
Support Zone: 6945 – 6922
Key Resistance: Previous corrective highs
Bullish Confirmation: Breakout with strong bullish candle structure
Invalidation: Sustained acceptance below the support zone
Takeaway
As long as the S&P 500 holds above the 6945–6922 support zone, the market structure favors a bullish continuation. Aggressive traders may position early at the lows, while conservative traders should wait for a confirmed breakout with strong momentum.
Hashtags
#SP500 #US500 #PriceAction #MarketStructure #BreakoutTrading #TechnicalAnalysis

S&P500 Uptrend breakout supported at 6873Despite major geopolitical headlines out of Venezuela, markets largely looked through the risk, with macro data driving price action instead. A weaker-than-expected US ISM manufacturing print reinforced expectations for faster Fed rate cuts, triggering a rally in Treasuries and supporting equities. The S&P 500 rose 0.64%, closing just 0.43% below its record high, with broad-based risk appetite evident across US and European markets.
Lower yields, easing growth concerns, and the absence of a negative shock from geopolitics continue to underpin equities. With rate-cut expectations firming and momentum strong, the near-term bias for the S&P 500 remains supported, though proximity to record highs suggests gains may be more incremental and data-dependent.
Key Support and Resistance Levels
Resistance Level 1: 6942
Resistance Level 2: 6965
Resistance Level 3: 6986
Support Level 1: 6873
Support Level 2: 6847
Support Level 3: 6826
This communication is for informational purposes only and should not be viewed as any form of recommendation as to a particular course of action or as investment advice. It is not intended as an offer or solicitation for the purchase or sale of any financial instrument or as an official confirmation of any transaction. Opinions, estimates and assumptions expressed herein are made as of the date of this communication and are subject to change without notice. This communication has been prepared based upon information, including market prices, data and other information, believed to be reliable; however, Trade Nation does not warrant its completeness or accuracy. All market prices and market data contained in or attached to this communication are indicative and subject to change without notice.

SPX - Next LevelsWe’re evaluating the move starting from April 2025.
It looks like we’re nearing the end of this move, currently plotting the fifth wave.
Corrections of waves 2 and 4 are roughly equal in size.
Fibonacci levels indicate the next target around 7,200 .
The 7,600 level (slightly below or above) roughly aligns with a larger Fibonacci extension, counting the first wave from October 2022 to July 2023.
Potential targets:
7,200
7,600
---
Please subscribe and leave a comment.
You’ll get new information faster than anyone else.
---

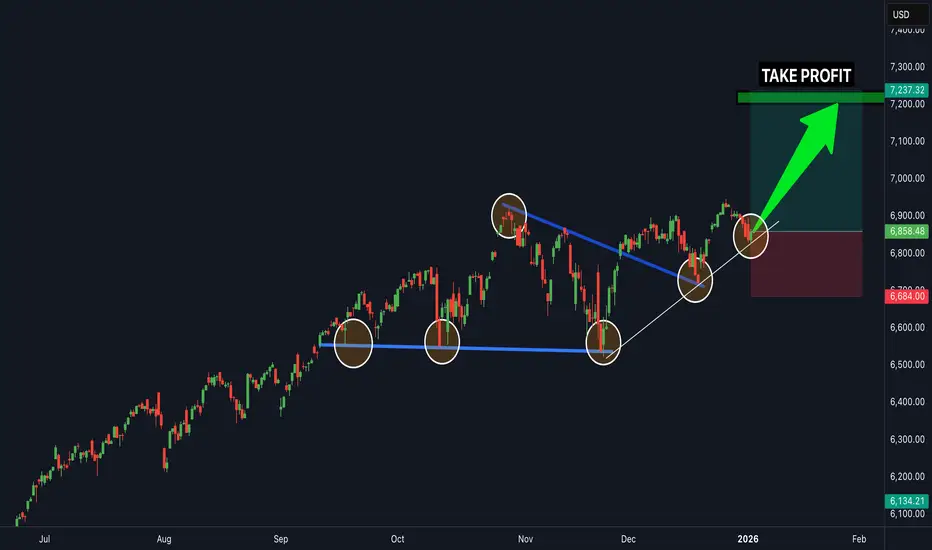
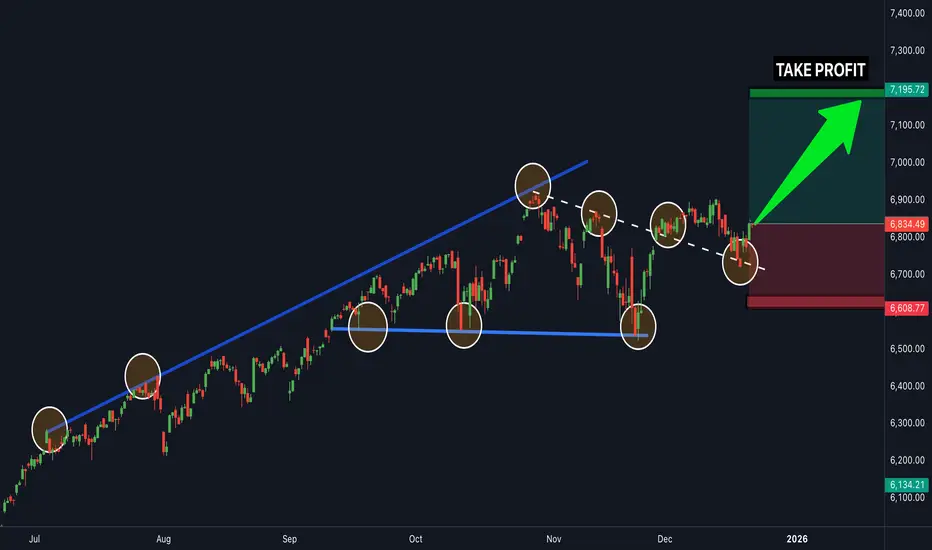
SPX.. buy now SPX 500 is in a clear upwards channel and has broken the last bit of resistance (white trendline line shown) - this is a clear confirmation that the next target will be the next resistance zone to the upside shown above (this is a great buy trade opportunity) - buy SPX 500 now...
US500 Structure Turns Positive as Demand Builds📈 Bullish US500 / SPX500 Swing Trade Opportunity | Thief Layer Strategy 🛡️💰
🔥 Asset: US500 / SPX500 Index
📅 Trade Style: Swing Trade
📊 Market Bias: Bullish Momentum
💡 Trade Plan – Thief Layer Entry Strategy
We’re playing a multi-layered bullish entry using Thief’s layering method 👇
🔹 Limit Layers:
• Buy Limit @ 6820
• Buy Limit @ 6840
• Buy Limit @ 6860
• Buy Limit @ 6880
(Add more layers based on personal risk tolerance & preference)
Layer Method: Using multiple limit orders helps accumulate positions on weakness and improve average entry for swing upside.
🛑 Stop Loss – Thief OG Rule
🔒 SL: 6800 (Thief SL)
➡️ Adjust SL based on your own risk level and strategy. Manage risk yourself — only use my SL as reference, not guidance.
⚠️ I am not recommending you ONLY use my SL/TP — trade at your own risk & adjust as needed.
🏁 Target Zone
🎯 Primary Target: 6980
📌 This zone aligns with strong resistance, potential overbought reaction & trap level — cautious profit-taking area.
🔗 Related Markets to WATCH
Here are correlated markets that often move with SPX500:
✔️ US Dollar Index (DXY) – correlation influences risk sentiment and equities. A stronger USD often supports equity strength, though relationship varies over time.
✔️ NASDAQ / US Tech Index – tech is a big driver for US500 performance due to sector weight.
✔️ Crude Oil (WTI / Brent) – recent patterns showed equities trending in tandem with oil, reflecting risk appetite.
✔️ EUR/USD & GBP/USD — sentiment indicators that often swing with risk on/off market mood.
🧠 Fundamentals & Macro Drivers
📌 Economic Outlook: U.S. growth expected without recession in 2026, aiding risk assets.
📌 Fed Policy: Recent rate cuts and expectation of additional easing support equity valuations.
📌 Earnings Growth: Most major sectors projected with higher expected growth for 2026.
📌 AI + Tech Tailwinds: Continued AI investment remains a key bullish driver for US equities.
📅 Watch Upcoming News Events:
• U.S. Nonfarm Payrolls
• Fed Rate Decisions / FOMC Minutes
• CPI & Inflation data
• PMI & Retail Sales
📌 Why This Setup
✅ Multi-layer entries improve execution quality
✅ Bullish macro backdrop + earnings support
✅ Clear risk zone + target
✅ Correlation watchlist for context
💬 Trade smart, manage risk, and always confirm with your own analysis.
If this idea helped, *like 👍, comment 💬, and follow 📌 for more Thief strategy setups!

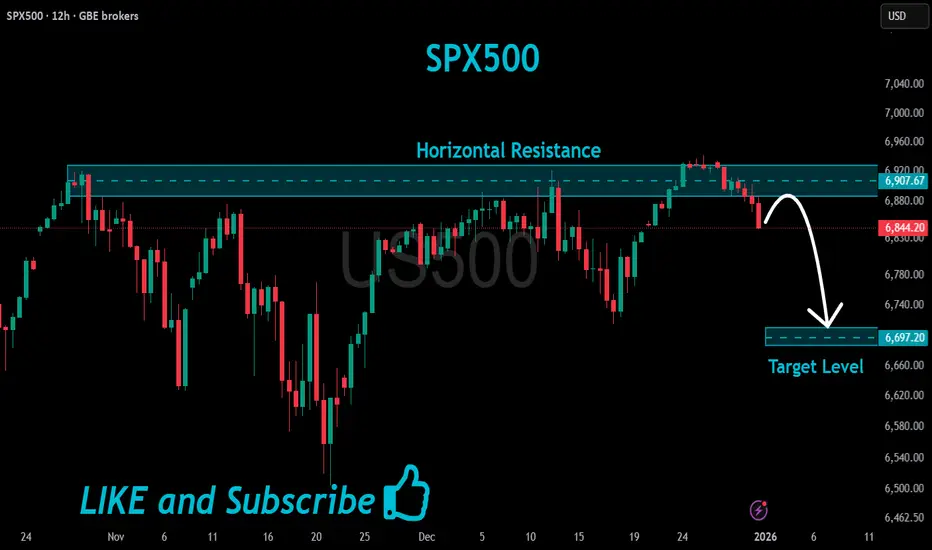
US500 Will Go Down!
HI,Traders !
#US500 has made a retest
Of the horizontal resistance
Of 6907.67 and we are already
Seeing a bearish reaction so
We are bearish biased and
Therefore a local bearish
Pullback is to be expected !
Comment and subscribe to help us grow !
S&P500 rally pause, bullish consolidation? Key Support and Resistance Levels
Resistance Level 1: 6946
Resistance Level 2: 6966
Resistance Level 3: 7005
Support Level 1: 6869
Support Level 2: 6847
Support Level 3: 6828
This communication is for informational purposes only and should not be viewed as any form of recommendation as to a particular course of action or as investment advice. It is not intended as an offer or solicitation for the purchase or sale of any financial instrument or as an official confirmation of any transaction. Opinions, estimates and assumptions expressed herein are made as of the date of this communication and are subject to change without notice. This communication has been prepared based upon information, including market prices, data and other information, believed to be reliable; however, Trade Nation does not warrant its completeness or accuracy. All market prices and market data contained in or attached to this communication are indicative and subject to change without notice.

S&P500 rejection can cause a very bearish start to 2026.The S&P500 index (SPX) hit last Friday its Higher Highs trend-line and got rejected, so far not aggressively.
The 1D RSI rejection though on a Lower Highs trend-line that goes as back as the September 22 High, illustrates a massive Bearish Divergence (Lower Highs against price's Higher Highs), has the potential to accelerate the decline first to the 1D MA100 (red trend-line) and then the lower Support Zone.
As long as the Higher Highs trend-line holds, we expect the index to target 6510 (top of Support Zone) at least within January 2026.
---
** Please LIKE 👍, FOLLOW ✅, SHARE 🙌 and COMMENT ✍ if you enjoy this idea! Also share your ideas and charts in the comments section below! This is best way to keep it relevant, support us, keep the content here free and allow the idea to reach as many people as possible. **
---
💸💸💸💸💸💸
👇 👇 👇 👇 👇 👇

#CVX is on the Boarding and ready to flygreat opportunity to ride with #CVX new swing two targets marked and hopefully will be met by first quarter of 2027

SPX.. buy now it's going upSPX 500 is in a clear upwards channel and has broken the last bit of resistance (white trendline line shown) - this is a clear confirmation that the next target will be the next resistance zone to the upside shown above (this is a great buy trade opportunity) - buy the SPX 500 now... it's going up

APPL (APPLE) BUY IDEAAPPL (APPLE) BUY IDEA
📊 Market Sentiment
Market sentiment is bullish, driven by expectations of the FED’s potential rate cut in December. In addition, Trump’s likely nominee for the new FED Chair is Kevin Hassett a strong supporter of aggressive rate cuts.
This possibility has pushed markets higher as participants began pricing in earlier and more aggressive cuts for 2026.
📈 Technical Analysis
AAPL remains one of the most bullish stocks in the U.S. market. All higher timeframes are strongly bullish.
We are currently seeing a retracement from recent all time highs, which in my opinion is simply a healthy pullback to build momentum for higher prices.
📌 Game Plan
I have two key Points of Interest for potential long entries. Both support a bullish continuation thesis, and I do not expect a major bearish shift for AAPL anytime soon.
Scenario 1:
Price taps 276.25 and bounces.
I will wait for a daily bullish close to confirm the continuation.
Scenario 2:
Price dips into 271 and bounces.
I will again look for a daily bullish close as confirmation.
Note:
The FED’s rate decision will be released on Wednesday at 2 PM.
Until then, I expect price to potentially move into an accumulation or range phase.
If I see strong movement earlier in the week, I won’t hesitate to take a long position.
💬 For deeper sentiment and strategy insights, subscribe to my Substack free access available.
⚠️ This analysis is for educational purposes only and does not constitute financial advice. Always conduct your own research before trading or investing.

S&P 500 Index Approaches the 7,000-Point LevelOver the past five trading sessions, the U.S. equity index S&P 500 (SPX) has maintained a consistent bullish bias, posting gains of more than 2% in the short term and moving closer to the psychological 7,000-point level. For now, the index has managed to sustain firm buying pressure, supported by optimism around potential interest rate cuts in 2026 by the Federal Reserve. This scenario could foster a lower cost of borrowing, helping market liquidity remain stable while supporting investment and consumption—key pillars for equity market confidence. If this perception holds, it could continue to act as a positive catalyst allowing the SPX to maintain sustained buying pressure toward the close of 2025. As long as confidence remains in place, buying pressure may continue to shape short-term price action.
The Bullish Trend Holds
For several months now, the SPX has sustained a consistent bullish trend across its average price movements, keeping the index very close to the 7,000-point area. At this stage, no meaningful bearish corrections have emerged that would threaten the bullish technical structure, which remains the dominant formation to monitor. However, it is important to note that as prices have reached new highs in recent sessions, a sense of neutrality has begun to appear in price action. If this indecision persists, it could open the door to short-term bearish corrections.
RSI
At present, the RSI remains above the neutral 50 level, suggesting that average momentum over the past 14 sessions continues to favor buyers. However, a notable technical development has emerged: while the SPX price posts higher highs, the RSI shows lower highs, forming a bearish divergence. This pattern may signal a recent excess in buying pressure, increasing the likelihood of selling corrections in the coming trading sessions.
MACD
The MACD continues to display a histogram oscillating very close to the neutral zero line, reflecting persistent neutrality in short-term moving average momentum. If this behavior continues, it may point to an ongoing indecision phase in SPX price action, potentially allowing for a period of consolidation and the emergence of short-term pullbacks.
Key Levels to Watch
7,000 points – Key resistance: A major psychological level that stands out as the most relevant resistance given the lack of prior price references. Sustained moves above this area could trigger a more aggressive bullish bias and extend the current uptrend.
6,900 points – Nearby support: A level associated with the neutrality observed around recent all-time highs. Price action holding near this zone could reinforce a more stable consolidation phase and favor the formation of a short-term sideways range.
6,800 points – Major support: An area where the bullish trendline aligns with the 50-period simple moving average. Bearish moves below this level could put the broader bullish structure at risk and open the door to a more dominant selling bias in the sessions ahead.
Written by Julian Pineda, CFA, CMT – Market Analyst

SPY (ES-US500-SPX) Weekly Prediction – Outlook (21 DEC)SPY (ES-US500-SPX) Weekly Prediction – Outlook (21 DEC)
📊 Market Sentiment
Market sentiment turned fully bullish after the CPI data came in significantly lower than expected on Thursday. While the expectation was 3.1%, the actual CPI print came at 2.7%, which was a meaningful downside surprise.
This data does not directly determine the outcome of the January FED meeting, as another CPI report will be released on January 13, 2026, which will be far more critical for the FED’s decision making process. However, the current soft inflation trend increased the probability of another lower CPI reading in January, which positively impacted risk sentiment across markets.
📈 Technical Analysis
In my previous SPY analysis last week, I clearly outlined the expectation of an early week pullback followed by a precise reversal level. That scenario played out exactly as anticipated.
Following the CPI release, price completed its reversal and closed the week with very strong bullish price action on Friday. In my opinion, this behavior suggests that the corrective phase has likely ended and price is now preparing for continuation to the upside.
📌 Game Plan
I think price may target the 683.5 level early in the week.
For call options and long positions, the key lower timeframe reaction zones I will be monitoring are 678.25 and 675.25.
If price rallies directly toward 683.5, I plan to sell the majority of my existing call positions around that level. However, if price first tests 678.25 or 675.25 before reaching 683.5, I am considering adding additional call exposure from those zones.
That said, my decision to enter will strongly depend on 1H and 4H candle closes. I will not enter positions in a market that simply breaks through these levels. If price tests these zones and prints strong bullish 1H or 4H closes, that is when I will begin executing call option entries.
💬 For deeper sentiment and strategy insights, subscribe to my Substack free access available.
This analysis is for educational purposes only and does not constitute financial advice. Always conduct your own research before trading or investing.

Bullish momentum to continue?S&P500 (US500) is falling towards the pivot, which is a pullback support that aligns with the 61.8% Fibonacci retracement and could bounce to the 1st resistance.
Pivot: 6,882.83
1st Support: 6,861.98
1st Resistance: 6,918.56
Disclaimer:
The opinions given above constitute general market commentary and do not constitute the opinion or advice of IC Markets or any form of personal or investment advice.
Any opinions, news, research, analyses, prices, other information, or links to third-party sites contained on this website are provided on an "as-is" basis, are intended to be informative only, and are not advice, a recommendation, research, a record of our trading prices, an offer of, or solicitation for, a transaction in any financial instrument and thus should not be treated as such. The information provided does not involve any specific investment objectives, financial situation, or needs of any specific person who may receive it. Please be aware that past performance is not a reliable indicator of future performance and/or results. Past performance or forward-looking scenarios based upon the reasonable beliefs of the third-party provider are not a guarantee of future performance. Actual results may differ materially from those anticipated in forward-looking or past performance statements. IC Markets makes no representation or warranty and assumes no liability as to the accuracy or completeness of the information provided, nor any loss arising from any investment based on a recommendation, forecast, or any information supplied by any third party

S&P500 breakout retest ?US equities remain in a constructive near-term setup. The S&P 500 rose another 0.64% yesterday, extending its winning streak to three sessions and leaving the index less than 0.5% below its record high. December has now turned positive again, keeping the S&P on track for an eighth consecutive monthly gain — a rare run last seen in 2018. Breadth was strong, with more than 75% of stocks advancing, and the Magnificent 7 also continued to recover, sitting just over 1% below their own highs.
That said, the key cross-asset headwind remains the relentless global bond sell-off. Yields pushed to fresh cycle highs globally, with Japan’s 10-year yield surging above 2% for the first time since 1999 and German Bund yields breaking above their March peak. While equities have so far shrugged this off, sustained upward pressure on yields remains a risk to valuation-sensitive sectors.
For today, attention turns to the final batch of US data before Christmas. The delayed Q3 GDP print is largely backward-looking, but December Conference Board consumer confidence will be more market-relevant after November fell to its weakest level since April’s turmoil. A stabilisation could help equities grind closer to record highs, while another downside surprise may test the market’s resilience given stretched positioning and elevated yields. Overall, momentum remains positive, but rates and sentiment data are the key swing factors for today’s S&P 500 trade.
This communication is for informational purposes only and should not be viewed as any form of recommendation as to a particular course of action or as investment advice. It is not intended as an offer or solicitation for the purchase or sale of any financial instrument or as an official confirmation of any transaction. Opinions, estimates and assumptions expressed herein are made as of the date of this communication and are subject to change without notice. This communication has been prepared based upon information, including market prices, data and other information, believed to be reliable; however, Trade Nation does not warrant its completeness or accuracy. All market prices and market data contained in or attached to this communication are indicative and subject to change without notice.

S&P500 INDEX (US500): Important Breakout
US500 broke and closed above a significant daily horizontal resistance cluster.
It indicates a highly probable growth further to a current ATH.
Expect a rise at least to 6915 level after a pullback.
❤️Please, support my work with like, thank you!❤️
I am part of Trade Nation's Influencer program and receive a monthly fee for using their TradingView charts in my analysis.

Bullish momentum to extend?S&P500 (US500) could fall towards the pivot, which acts as an overlap support, and could bounce to the 1st resistance.
Pivot: 6,825.54
1st Support: 6,798.23
1st Resistance: 6,890.05
Disclaimer:
The opinions given above constitute general market commentary and do not constitute the opinion or advice of IC Markets or any form of personal or investment advice.
Any opinions, news, research, analyses, prices, other information, or links to third-party sites contained on this website are provided on an "as-is" basis, are intended to be informative only, and are not advice, a recommendation, research, a record of our trading prices, an offer of, or solicitation for, a transaction in any financial instrument and thus should not be treated as such. The information provided does not involve any specific investment objectives, financial situation, or needs of any specific person who may receive it. Please be aware that past performance is not a reliable indicator of future performance and/or results. Past performance or forward-looking scenarios based upon the reasonable beliefs of the third-party provider are not a guarantee of future performance. Actual results may differ materially from those anticipated in forward-looking or past performance statements. IC Markets makes no representation or warranty and assumes no liability as to the accuracy or completeness of the information provided, nor any loss arising from any investment based on a recommendation, forecast, or any information supplied by any third party

S&P500 mini Santa Rally up next on a 1H Golden Cross.S&P500 (SPX) is about to complete a Golden Cross today on the 1H time-frame. The last time it did that was on November 25, almost 1 month ago, while trading on the first Bullish Leg of the current Channel Up pattern.
Following the 1H Golden Cross, the index rallied to the 1.236 Fibonacci extension level, before turning sideways. As a result this could be the mini Santa Rally that the market is waiting, targeting 6920.
---
** Please LIKE 👍, FOLLOW ✅, SHARE 🙌 and COMMENT ✍ if you enjoy this idea! Also share your ideas and charts in the comments section below! This is best way to keep it relevant, support us, keep the content here free and allow the idea to reach as many people as possible. **
---
💸💸💸💸💸💸
👇 👇 👇 👇 👇 👇

SPX.. buy nowSPX 500 is in a clear upwards channel and has broken the last bit of resistance (white trendline line shown) - this is a clear confirmation that the next target will be the next resistance zone to the upside shown above (this is a great buy trade opportunity) - buy the SPX 500 now
Bullish continuationS&P500 (US500) could fall towards the pivot, which is a pullback support, and could bounce to the 1st resistance, which is a multi-swing high resistance.
Pivot: 6,505.98
1st Support: 6,141.15
1st Resistance: 6,900.95
Disclaimer:
The opinions given above constitute general market commentary and do not constitute the opinion or advice of IC Markets or any form of personal or investment advice.
Any opinions, news, research, analyses, prices, other information, or links to third-party sites contained on this website are provided on an "as-is" basis, are intended to be informative only, and are not advice, a recommendation, research, a record of our trading prices, an offer of, or solicitation for, a transaction in any financial instrument and thus should not be treated as such. The information provided does not involve any specific investment objectives, financial situation, or needs of any specific person who may receive it. Please be aware that past performance is not a reliable indicator of future performance and/or results. Past performance or forward-looking scenarios based upon the reasonable beliefs of the third-party provider are not a guarantee of future performance. Actual results may differ materially from those anticipated in forward-looking or past performance statements. IC Markets makes no representation or warranty and assumes no liability as to the accuracy or completeness of the information provided, nor any loss arising from any investment based on a recommendation, forecast, or any information supplied by any third party

WEEKLY QQQ (NQ-US100-USTECH) Outlook - Prediction (14 DEC)WEEKLY QQQ (NQ-US100-USTECH) Outlook - Prediction (14 DEC)
📊 Market Sentiment
Market sentiment has turned slightly bullish again following the FED’s rate cut decision. We saw the market react quickly after Powell’s speech. QE has restarted, and the FED stated it will buy $40 billion of Treasury bills over the next 30 days. This narrative supports the bullish case; however, $40B is relatively small compared to the overall size of the U.S. market.
At the same time, the bearish narrative is strengthening. Powell stated that “rates are now in a plausible range of neutral,” and the FED emphasized that it will assess incoming data until the January meeting. No decision has been made for January yet.
This keeps the market in a state of uncertainty and when the market lacks a clear narrative, it often turns bearish. Keep this in mind.
📈 Technical Analysis
QQQ hit the 629 level, as I pointed out last week. I am linking last week’s QQQ prediction below for reference.
Price ran the 629 level but could not close above it. After that, we saw selling pressure due to SPY and YM hitting all time highs and getting rejected. QQQ was the weaker index last week, which explains why we did not expand as much as SPY and why QQQ failed to reach all time highs.
I believe the expansion higher will resume, but first price needs to gather more energy before continuing upward.
📌 Prediction – Outlook
I am tracking three different scenarios:
Scenario 1 (Black Line) – Bullish:
Price runs the 610.5 level and closes above it. If this occurs, I will be buying calls, targeting 617.5 first, with a runner for higher levels.
Scenario 2 (Orange Line):
Price retraces to 610.5 and closes below, creating a deeper pullback. Price then reaches 605.5 and closes back above it. This would likely initiate bullish momentum.
In this case, I would be buying calls, targeting 610.5 first and 617.5 as the second target.
Scenario 3 (Red Line) – Bearish:
Price retraces to 610.5 and aggressively closes below. Price then continues lower toward 597.5 without showing strength.
If price later closes back above 597.5, I will look to buy calls.
Initial profit targets would be 605.5 and 610.5.
💬 For detailed insights and broader market context, please check my Substack link in profile.
For educational purposes only. This is not financial advice.
