XAUUSD ATH Sell Analysis 4530 - 4130This sell from 4,530 down toward ~4,130 is a straightforward “extension then correction” setup. Price pushed into a fresh high at 4,530 right at the upper boundary of the rising channel, but instead of building acceptance above that level it looks like an exhaustion print. In my framework, this is also exactly where my 5-wave model count completes. The impulse ends at 4,530 so I’m not treating the next move as a trend failure, but as the expected corrective phase that typically follows a completed count. The logical magnet for that correction is the heavy volume cluster / prior consolidation near 4130 where price previously spent time and transacted heavily. That zone is where I expect the market to rebalance, fill the thin area left by the late stage expansion, and potentially stabilize before the next directional decision.
Invalidation for the correction idea would be sustained price acceptance as we are in discovery and continuation above 4530
For now I expect price rejections and potential ABC top formations
USD-BTC

Zcash ZEC Update: Breakdown confirmed, hold your horses ZEC Update: Price has now decisively broken down from the rising channel, and the attempted reclaim back into the structure failed, confirming this move as corrective rather than trend continuation. Former channel support in the 390-400 region is continuing to act as resistance, and the inability to hold above it reinforces that sellers remain in control. Structurally, this shifts the bias back to the downside, with price likely to remain under pressure into year end.
From a broader perspective, this lines up with the wider crypto market showing signs of distribution and risk-off behavior following the recent expansion phase. As liquidity tightens and momentum cools across majors, higher beta and narrative-driven assets like ZEC tend to retrace deeper and test higher timeframe levels. In that context, continuation back toward the ~300 HTF support zone makes the most sense from both a technical and macro standpoint.
The ~300 level is especially important here. This would be a second test of what has recently flipped from resistance to support, making it a true validation level. A strong reaction would suggest acceptance of this zone as a higher low within a larger cycle, while a weak or impulsive break would open the door to further downside and a longer basing process. I’m cautious here, as second tests often determine whether a level holds structurally or fails outright.
Assuming the market continues to flush and reset into early next year, I’d expect conditions to improve closer to February once excess leverage and weak hands are cleared out. Until then, the focus remains on respecting structure, managing risk, and letting price confirm before getting aggressive. For now, this looks like consolidation and downside continuation within a broader market reset rather than the start of a new uptrend.

BTCUSD SELL IDEACurrent price: around $114,976
Recent structure: The price made a CHoCH after forming a lower high around $115,600, signaling a potential shift from bullish to bearish momentum.
BOS confirmation: A break of structure downward confirms sellers taking control.
Supply zone: A red zone above ~$115,400–$116,000 shows a bearish supply area, where price could retrace to before continuing lower.
Expected move: A short-term pullback (retracement) toward ~$115,200–$115,400 before a continuation down toward the demand zone near $113,200–$112,800.
📉 Sell idea summary:
Bias: Bearish
Entry zone: ~$115,200–$115,400 (after retracement)
Target: ~$113,200
Stop loss: Above ~$115,600

#BTCUSDT Let Bitcoin make a new ATH#BTC
The price is moving in a descending channel on the 1-hour frame and is expected to break and continue upward.
We have a trend to stabilize above the 100 moving average once again.
We have a downtrend on the RSI indicator that supports the upward move with a breakout.
We have a major support area in green that pushed the price higher at 121,500.
Entry price: 122,200.
First target: 122,800.
Second target: 123,400.
Third target: 124,200.
To manage risk, don't forget stop loss and capital management.
When you reach the first target, save some profits and then change your stop order to an entry order.
For inquiries, please comment.
Thank you.

BTCUSD POSSIBLE BUY SETUP💡 BTCUSD 4H Outlook – Recovery Setup in Play
After a strong sell-off that created a Change of Character (ChoCH), price has now tapped into the demand zone around 112,000 – 113,000. From here, I’m watching for signs of accumulation and potential continuation back to the upside.
🔼 Bullish Scenario
If buyers hold this demand, we could see a rally toward the first supply zone near 116,000.
A clean break above that would open the way for a push toward the major resistance at 118,000 – 119,000.
🔽 Bearish Scenario
Failure to hold 112,000 support could trigger further downside. Next liquidity sweep would likely come below 111,500 and possibly deeper.
⚔️ Key Levels to Watch
Support: 112,000 | 111,500
Resistance: 116,000 | 118,000 – 119,000
📊 Current structure suggests bulls may try to defend this zone, giving a possible recovery leg.
✅ If this analysis helps you, hit the boost and follow for more updates on BTC and other pairs.
💼 For traders looking for account management services (personal or funded accounts), reach out — I can help with risk-managed growth and consistent strategies.

BTCUSD POSSIBLE BUY SETUP -----118K Break of Structure (BOS): Multiple bullish BOS indicate a trend reversal from bearish to bullish.
Change of Character (CHoCH): Confirmed trend shift early on.
Descending trendline broken: Signaling the end of bearish momentum.
Price broke above resistance (~$113,250): Now acting as a support zone (highlighted in green).
Current price: ~$114,272
Bullish target zone: Between $116,000 – $118,000, marked in maroon.

ETHUSDT ShortThese are the key areas we are looking for on ETH 4H
Risk per entry 0.25%
Entry 1: 4250
Entry 2: 4450
TP 1: 3900 or Pivot 4050
TP 2: 3620
Full TP: 3320
SL: 4580
Always manage your own risk. None of the above is financial advice.

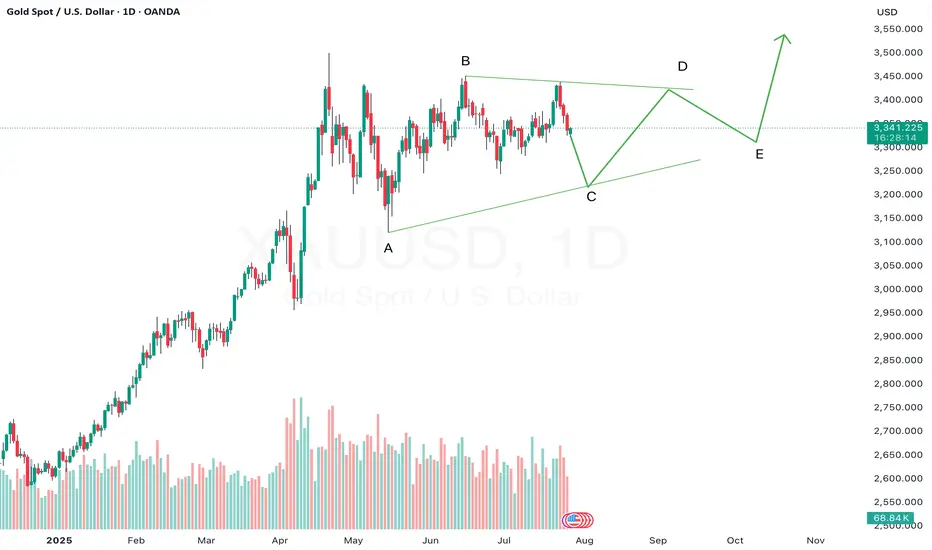
Gold may still be unfolding Wave C of a triangle — don’t rushGold appears to be forming a contracting triangle pattern, and we could currently be in the midst of Wave C. In a triangle structure (A-B-C-D-E), Wave C typically unfolds as a corrective move and is often mistaken for a potential breakout phase.
However, triangles are continuation patterns, and premature entries can lead to whipsaws or false breakouts. If Gold is indeed still in Wave C, we can expect further choppy, sideways movement before the pattern completes with Waves D and E.
Patience is key — let the structure mature. A more reliable opportunity may emerge after the triangle resolves and the larger trend resumes.
DOW JONES TO 111 THOUSAND..in the the 2030's.
as an investor you must be thinking 2 decades down the line.
NOT 2 quarters.
They can not
stop
printing #FIAT
it's in the code.
A 8% compound rate puts the Dow Jones at 85,000 in 2034.
I'm long forever.

LINK/USDT - Long trade LINK / USDT Update 🔔
I couldn’t be more bullish on the LINK trade we’re holding right now.
We’ve got a textbook inverse head and shoulders playing out... neckline broken, perfect retest, and now a bullish engulfing candle confirming the move. Structure couldn’t be cleaner. This is exactly what you want to see after a breakout. Now could be a good idea to add to your position size on the LINK trade.
Holding strong here with eyes on the $18.20 and $19.53 short term targets. As long as price holds above the neckline zone, this setup remains high-conviction.
Big upside potential from here. Let’s ride it. 🔥

TURBO long-term outlookAfter completing its first cycle TURBO seems to stabilize around the 0.0010-0.0020$ region which marks the last ATH from 2023. What's interesting here is that TURBO follows the DOGE coin pattern levels almost to a T, in speedrun mode. It is absolutely not the same structure but it respects the same trading ranges and shows a lot of similarities, which is quite remarkable.
Watch out for this yearly trendline in the TURBO chart and expect some volatility for the next months. Breaking under 0.0010$ could potentially confirm a longer downtrend if we don't see a big impulsive bounce to the upside in the near future.

$SPY I know this is crazy, but $576 is my number, Call me maybe?$576 Gap fill on the way? Time will tell that's for sure. My expecation is that we sell into the beginning of March Covid style in a way. $576 seems good for right now. Will update as we go.

ETH - Short term long I have just entered on the breakout (Assuming it closes above 2110 on the 1H.) Target $2250.

LTC - Dino coin will make itHey,
I believe we're nearing the bottom for LTC in this cycle, setting up for the next major move higher.
It might take some time to play out, but I expect to see momentum picking up in Q2/Q3.
LTC is a dinosaur token—one that doesn’t get much love anymore—but I still see it reaching $300+ within the next 6 to 12 months.

ETH BEAR FLAGTrump pump trap underway.
Pretty obvious bear flag especially when daily RSI did not support the aggressive move upwards (news driven).
No pullbacks on recent move up suggest it will retrace the entire Trump pump and then break down the bear flag.
Bulltards will be in full disbelief.

TURBO price volatility gonna increase soonAfter four months of sideways accumulation and holding strong above 0,003$ TURBO is poised to face the next leg up. Considering that the Ethereum meme ecosystem is constantly growing and - chartwise - ETH is making higher highs and higher lows over the last two years riding towards new all-time-high this could play out very well in the future.
Historically, squeezing Boilinger bands point to a big volatility move after consolidation. Let's see how this play out.


Yay or Nay?It's decision time. Critical point here. BONK failed to break and close above the upper resistance from the last ATH to pump to fresh new highs.
Do we gonna go straight up, sideways to create a strong base or down to major support?

Bitcoin #BTC Current Phase Targets ]In the name of Allah, the Most Gracious, the Most Merciful,
📈 **Bitcoin #BTC**
🎯 **Current Phase Objectives**
🔑 **Condition:** A **breakthrough at $72,558** is required before the dates of **16~28 / Jun**
📊 **Phase Target:** By God's will, aiming for an upward trend to **$90,594**
🔍 The targets are clear and defined. The outlook changes from bullish to bearish if these dates are reached before the breakthrough or if a drop below **$56,522** occurs.
💖 May success be granted by Allah

R2F Weekly Analysis - 13th May 2024 (ICT Concepts)Welcome to another R2F Weekly Market Analysis using ICT Concepts along with my own discoveries. Without any prior preparations on the chart, I'm going to go through various pairs, and giving a real-time view of how I perform my analysis on the weekends before the new week. I'll give my take on what has been happening, and what i'm expecting in either the coming days, weeks, or months. Without further ado, let's get into it!
If you are lazy to watch the video, which is your loss, the TLDR is that I am still bullish Dollar and waiting for the manipulation and reversal back to the upside, potentially this week with CPI/PPI/FOMC red folder news occurring. All my analysis of other pairs revolve around this.
I did not go to the sub 4H timeframe in this video, but how I do my analysis on the higher timeframes is the same as how I would look for entries on the lower timeframes. The only difference is that I would consider the ICT Killzones and weekday tendencies along my usual techniques.
Hit me up if you want to learn more or are struggling to find your footing and need help.
- R2F

Macro Negative Correlation with BitcoinThe US Dollar Index TVC:DXY is negatively correlated with the macro Bitcoin BNC:BLX chart.
Indicators like the Correlation Coefficient indicator will display swings from negative to positive correlation between TVC:DXY and $INDEX:BTCUSD. This can lead to a belief that they are not in fact negatively correlated.
But, when you zoom out to a macro view of Bitcoin and compare, the dollar index's peaks correspond with Bitcoin's lows, while Bitcoin's peaks correspond with DXY's lows.
At times, these corresponding peaks and valleys have occurred near the same dates and times, while at other times DXY has acted as a leading indicator for future movement for Bitcoin.
Where will we go next?
if DXY returns to its previous high and breaks it, I suspect Bitcoin will move lower
on the other hand, should DXY move further down or get stuck within a range, it's likely that Bitcoin will move higher
What do you think?

TETHER (USDT) COLLAPSE IS IMMINENT! With the United States about to pass strict regulation regarding stablecoins, which includes a measure to insure "Robust transparency, audit and reporting requirements," Tether is absolutely doomed, as they have consistently refused to confirm a 1:1 peg to the USD through an independent, third-party audit, which in my book, is because they're not doing it.
Something is fishy with Tether, and I would not be surprised if it has not maintained the 1:1 peg as it has claimed, but will soon be exposed as a fraud, and a ponzi scheme designed to benefit its owners at the expense of the general public.
On April 9th, Senator Kirsten Gillibrand (D-N.Y.) announced that:
"This legislation develops two paths for stablecoin issuers.
1- The first path would be for depository institutions that would allow for both federal and state bank charter depository institutions to become stablecoin issuers after an approval process.
2- The other path would be for nondepository institutions that would give the federal government supervisory authority over the state nonbank institutions while preserving states as the primary functional regulator."
This spells the end for Tether, and certain doom for any company whose business model relies upon it, such as: Exchanges, OTC desks, Trading Platforms and Wallets, Remittance Services and DEFI Platforms.
You were warned! Don't get caught holding the bag!

Domination of USDT + USDC and lows/maxims of BTC. CorrelationIn the graph, combined into one graph of the dominance of such stablecoins as USDT and USDC.
Orange color—chart of the bitcoin price against the dollar.
The time interval is 1 week. The graph is logarithmic.
The same chart and the same parameters on the candlestick chart .
All BTC price lows and highs are specially shown. Compare what the capitalization of stablecoins was at the time.
At an earlier time, the dominant stablecoin was one USDT, later USDC was added. They occupy a significant capitalization. BUSD and DAI are less capitalized. They too can be added to this “indicator” of the Pumps/Dumps market.
I think the dominance history and the bitcoin overlay chart illustrate well which market phase and in which areas to buy and sell bitcoins and other speculative crypto coins.
Centralized Stablecoin capitalization of a decentralized market .
Sounds crazy, doesn't it? The dominance of centralized in a decentralized market. The 3rd,4th,6th places are naturally occupied by centralized stablecoins such as: #USDT #USDC #BUSD.
This kind of decentralized cryptocurrency financial world (freedom from the dictatorship of banks, power states, and so on) did you imagine, for example, in 2015-2017? Is it good or bad? What will happen after a while? What trend will develop further after the community bait has been swallowed?
3rd place . USDT ( .... "Reds" .... )
$67,562,687,657
4th place . USDC (Circle, Coinbase, JPMorgan, Blackrock .... )
$51,726,419,583
6th place . BUSD (Binance)
$20,003,320,692
13th place DAI ETH (!)
BTC and ETH dominance.
Continuing on this “democracy” theme of crypto sandbox capitalization. Today 14 09 2022.
Market Cap: $989,560,104,72
Dominance:
#BTC: 38.9%
#ETH: 19.9%
Total 2 assets: 58,7%
Also add 3,4,6,13 top stablecoins to this.
Stablecoins over 20%.
Almost 60% of the market is 2 assets.
Over 80% of the market is 6 assets.
So much for the true mythology of decentralization ))).
How to look for a “live chart” for yourself and combine the dominance of USDT and USDC:
1) Look for the MARKET CAP USDT DOMINANCE, %
2) On the right side of the chart in the search field, press the + button
3) Write MARKET CAP USDC DOMINANCE, %.
For the analysis, it will also be useful to track at the same time:
1) BTC dominance
2) US dollar index (DXY, USDX)
BTC dominance
BTC to altcoin dominance. Stablecoin dominance and market pamp.
US Dollar Index (Fed)with prices of BTC lows/maxims. Correlation of assets.
DXY and PampDump BTCMarkets Cycles.
This is what it looks like on a line chart to illustrate simple correlation things.
Preparedness for force majeure.
I would also like to say that all stabelcoins are focused on the "stability" of the U.S. dollar. Think about what would happen if, for some reason, that stability were to be undermined in the blink of an eye. Then you are faced with a very difficult choice.
What to do? Sell/buy cryptocurrency/shares? Just think ahead "What do you do" if, purely hypothetically, for some fantastic, hard-to-imagine reasons this happens. Think ahead in today's calm time (are you sure it's not calm now?), so you won't be caught off guard in a turbulent time.
