The key is whether the USDT and USDC gap downtrend will stop
Hello, fellow traders!
Follow us to get the latest information quickly.
Have a great day.
-------------------------------------
(USDT 1D chart)
USDT is showing a gap downtrend, leading to a decline in the coin market.
A gap downtrend in USDT or USDC can be interpreted as a sign of capital outflow from the coin market.
The key question is whether this gap-up will lead to another upward trend.
(USDC 1D chart)
USDC is also showing a gap-up trend.
It's worth paying attention to the movements of USDT, which has a significant impact on the coin market.
-
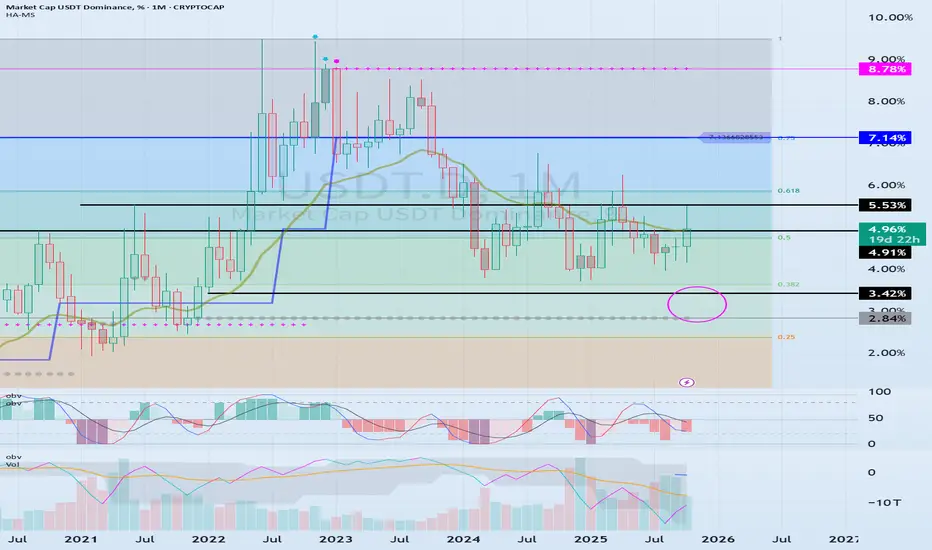
(USDT.D 1M chart)
USDT is showing a gap-down trend, leading to an increase in USDT dominance.
A rising USDT dominance is likely to lead to a downward trend in the coin market.
Therefore, it's beneficial to see a declining USDT dominance.
This means that funds are flowing into the coin market through USDT, and the inflow of USDT is used to purchase coins, causing USDT dominance to decline.
-
(BTC.D 1M chart)
As BTC dominance rises, I believe funds will flock to BTC, creating a BTC-led market.
Therefore, we expect an altcoin bull market to emerge when BTC dominance and USDT dominance coincide.
For this to occur, BTC dominance must fall below 55.01 and either remain stable or exhibit a downward trend.
-
Currently, USDT dominance is rising, while BTC dominance is falling.
I believe this movement is best interpreted as altcoins focusing on price defense.
The decline in BTC dominance indicates that funds are flocking to altcoins, while the rise in USDT dominance indicates a downward trend in the coin market.
-
Therefore,
we need to determine whether the upward trend of USDT and USDC can be sustained,
starting with the recent gap-up,
see whether the upward trend of USDT dominance has stalled,
and whether BTC dominance can support the price of BTC.
While the USDT, USDC, BTC.D, and USDT.D charts only provide a rough idea of the fund flow in the coin market, I believe this information alone is a valuable resource for individual investors who trade with limited information.
Therefore, I believe this is one of the reasons why the coin market is more transparent than any other investment market.
-
Thank you for reading to the end.
I wish you successful trading.
--------------------------------------------------
USDC

CRCL All time Low but ending soon?NYSE:CRCL as hit an all-time low, breaking below the IPO launch price.
A triangle printed. Triangle are penultimate patterns before the last move of the trend so its possible this is the final leg down, just in time to capitulate investors.
Bullish divergence has printed in the daily RSI from oversold
Keep an eye on this.
Safe trading

On-Chain Markets looking Defensive Normally, I just mark up charts and don't publish them ( I figure a lot of us do this ).
With all the fervor going on in the markets, I decided to see how capital is rotating on Chain; Lo' & behold, USDT and USDC ( Largest USD-Pegged Stablecoins by market cap ) are seeing dominance. Surely one could say that because BTC price is going down, other crypto's dominance will rise - The dollar tends to be inversely correlated to Crypto so It only makes sense that those profit-taking are moving money onchain.
Not sure what the next catalyst will be but Stablecoins on this chart look bullish ( which is probably a tell-tale sign crypto might be taking a dip in the near future...
NOT FINANCIAL ADVISE

$USDT & $USDC vs. $ETH - Warning a Funeral could occur. 💀 💀 💀
Watch the Stablecoin/ETH Market Cap ratio carefully.
A spike here isn't always 'Dry Powder' waiting to buy.
The Trap: If ETH breaks the $2,400 support level, we could see a 'Liquidation Spiral' that sends the ratio to all-time highs.
This isn't new money coming in—it's ETH value vanishing.
Safe Haven: Cash is King until ETH reclaims its 200-day SMA at $3,400."
#ETH #Ethereum #Stablecoins #MarketCrash #LiquidityTrap #CryptoAnalysis @thecryptosniper #HVF
what does AI say:
📉 The Doomsday Ratio: (USDT + USDC) / ETH
In a crash, this ratio spikes vertically. But unlike a "healthy" spike (where new money enters), this is a "Deleveraging Spike."
1. The ETH Collapse (The Denominator Shrinks)
Revenue Compression: Layer 2s are so efficient now that they are starving the Mainnet of fees. Without a high "burn" rate, ETH is becoming slightly inflationary again, losing its "Ultra Sound Money" appeal.
The ETF "Exodus": If institutional investors see ETH as a "leveraged claim on ecosystem activity" that isn't growing, they may rotate back to Gold or Bitcoin. A sustained outflow from spot ETFs could trigger a -40% re-rating.
The Liquidation Spiral: Since many "loopers" use ETH as collateral to borrow stablecoins, a price drop below $2,400 could trigger a cascade of liquidations on Aave/Compound, forcing more ETH onto the market and crushing its market cap.
2. The TradFi Standoff (The Numerator Stagnates)
The "Trust Gap": If the ratio increases simply because ETH is dying, TradFi institutions won't "buy the dip" with new USDC. They will wait for more regulatory "Supervision" rather than just "Legislation".
The Yield Trap: If stablecoins like USDT/USDC don't offer higher yields than risk-free US Treasuries (currently highly competitive in 2026), there is no incentive for a corporate treasurer to move cash onto the blockchain.

CRCL Top 10 Pick for 2026: Positioned for the Digital Dollar EraCRCL has been on my radar as one of my top 10 picks for 2026, and recent market activity only strengthens my conviction.
Toward year-end expirations, I observed fairly aggressive out-of-the-money call buying on CRCL. This isn’t random speculation—it suggests that traders are positioning for a potential catalyst, and it aligns with my long-term view of the company.
CRCL is closely associated with USDC, and there are strong indications that the company could play a role in the development of a blockchain-based digital dollar.
The implications of such a development are enormous!
A digital dollar wouldn’t just be a novel financial product—it could serve as a tool for inflation stabilization, monetary efficiency, and global transactional utility.
Over time, such an innovation may evolve from optional curiosity into a global necessity.
The aggressive positioning in calls, particularly out-of-the-money, reflects the market’s anticipation of a significant event or series of events.
Traders are effectively expressing confidence that CRCL’s narrative could materialize in a meaningful way over the next few quarters.
For investors, this creates a favorable risk/reward dynamic, especially considering the broader structural trends in digital currencies, blockchain adoption, and the push for a regulated digital dollar.
Of course, execution remains critical. CRCL must navigate regulatory hurdles, competition, and technological complexity.
But when you combine these risks with the potential upside of being a first-mover in the digital dollar ecosystem, the reward profile becomes compelling.
In my view, CRCL represents a rare convergence of market timing, structural trends, and optionality.
With bullish sentiment already showing up in the options market, and the broader narrative of a blockchain-based dollar gaining traction, CRCL is a stock that could surprise materially in 2026.

CRYPTO GOES 'TETHERED & CIRCLED' AMID THE PERDITION OF BTC BULLSThe recent 'Tethering and Circling' of crypto assets amid the downturn of Bitcoin (BTC) bulls can be explained by several interconnected factors rooted in market dynamics, investor behavior, and regulatory pressures.
As BTC bulls face setbacks in sustaining their upward momentum in 2025, the crypto market as a whole tends to become more tethered and circled around stablecoins like Tether (USDT) and Circle's USD Coin (USDC).
This shift is due to the need for stability, liquidity, and risk mitigation in an environment of uncertainty.
Role of Stablecoins Amid BTC Bear Pressure
Stablecoins like Tether and Circle have become dominant anchors in the crypto ecosystem, controlling over 80% of the global stablecoin market capitalization. Their foundational role is to provide a stable medium of exchange and store of value pegged to fiat currencies, predominantly the US dollar. As Bitcoin bulls lose steam and volatility spikes, investors and traders increasingly move their capital into these stablecoins to avoid the sudden price swings of BTC and altcoins. This creates a "tethering" effect where a large portion of liquidity is parked in stablecoins, allowing market participants to quickly enter or exit positions while minimizing exposure to risk. Stablecoins thereby act as a safe haven within the crypto market during periods of bearish sentiment or market correction.
Market Sentiment and BTC Cycle Influences
The 2025 Bitcoin cycle differs significantly from previous bull runs seen in 2021. Analysts suggest the true peak of Bitcoin’s cycle was back in April 2021, and since then the market has entered a phase characterized by cautious consolidation rather than explosive growth. Key macroeconomic indicators such as inflation trends, Federal Reserve rate policies, and quantitative tightening play substantial roles in shaping this slower, more measured market behavior. With BTC showing signs of a shallow bear phase and mixed momentum, investors' confidence is dented, pushing them towards safer crypto assets like stablecoins and highly liquid tokens.
Increased Regulatory and Competitive Pressures
The crypto market environment in 2025 is also shaped by growing regulatory scrutiny, especially around stablecoins themselves. Regulations in regions such as the EU have introduced frameworks like MiCA, impacting how stablecoin issuers operate. Tether, for instance, has responded cautiously to some regulatory moves, even choosing not to comply with certain restrictive regulations, leading to delisting from some centralized exchanges and challenges in maintaining its dominance.
Meanwhile, Circle’s USDC has been slightly less affected due to wider regulatory acceptance but still faces limitations on certain yield-generating activities. These regulatory pressures influence market dynamics, prompting crypto participants to actively circle around the most trusted and compliant stablecoin options to secure their holdings.
Market Dynamics of Crypto Herd Behavior
Moreover, cryptocurrencies tend to move together due to their correlated trading patterns. Large market movements in BTC often trigger cascading effects in altcoins and other digital assets. When BTC bulls falter, a wave of stop-loss liquidations occurs, leading traders to sell off altcoins and consolidate holdings into stablecoins or less volatile crypto instruments. This communal movement is amplified by the relatively smaller market caps of altcoins compared to BTC and the 24/7 nature of crypto trading, intensifying the tethering phenomenon as market participants seek to safeguard their assets and maintain liquidity.
Technical challenge
The main technical chart is a sum of USDT and USDC dominance; they both in nowadays represent more then 80 percent of all stablecoins market cap.
Long term upside trend is still looks robust, with a potential of Bull extension due to 200-week simple moving average brekthrough.
In summary, the crypto market's increasing tethering and circling around stablecoins amid the recent bearish phase of BTC bulls in 2025 is mainly due to the need for stability during heightened volatility, the maturation and changing cycle of Bitcoin, regulatory developments around stablecoins, and the inherent herd behavior in crypto trading. This dynamic ensures that stablecoins remain central hubs in the crypto economy as investors navigate uncertain market conditions.

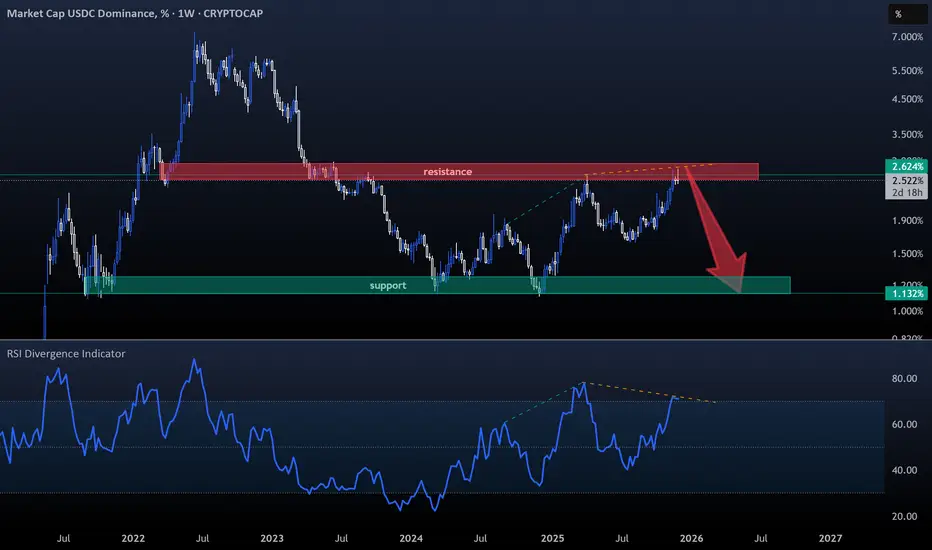
USDC DOM- I haven’t covered Circle’s stablecoin recently. Tether's USDT remains the clear leader at 6% Dom, but with USDC rising back to 2.5% Dom, it’s definitely worth watching again.
- The chart is simple, focus on the Weekly RSI and you’ll see a clear divergence developing on the weekly timeframe.
- So just keep an eye on USDC’s support around 1.1% (green zone) and it's resistance near 2.8% (red zone).
One Simple Rule : Stablecoins down = Bitcoin up.
Happy Tr4Ding !
The Convergence and Evolution of AI and BlockchainThe Convergence and Evolution of AI and Blockchain: Reconstructing Productivity and Production Relations in the New Digital Economy Paradigm
Authors: SanTi Li, Chunfeng Jun, Lisa, Nahida
Abstract: Current market discussions regarding the relationship between Artificial Intelligence (AI) and Blockchain (Crypto) are often limited to a zero-sum game perspective focusing on liquidity fragmentation. However, in-depth industry analysis and technological evolutionary paths suggest that the two are, in fact, complementary and symbiotic. Against the backdrop of AI driving exponential productivity growth and trending digital content supply toward infinity, the reconstruction of production relations and ownership mechanisms based on blockchain is not merely "icing on the cake," but a fundamental necessity. This article aims to deeply analyze—from the dimensions of reshaping trust mechanisms, establishing ownership systems, shifting economic paradigms, the importance of Tokens as value carriers, and risk control—why the widespread adoption of AI will become the core driver and accelerator propelling blockchain technology from fringe experiments to large-scale application.
1. The Digital Trust Crisis in the Wake of the AI Explosion
With recent breakthrough advancements in AI technology, particularly the widespread application of Large Language Models (LLMs) and Generative AI (AIGC), the core economic significance lies in reducing the marginal cost of content production to near zero. While this has tremendously unleashed social creativity and productivity, it also poses an unprecedented challenge to the existing internet ecosystem, leading to drastic changes in the information environment.
Entropy Increase and Distortion in the Digital Information Ecosystem: With the proliferation of Synthetic Media and Deepfakes, the internet faces the tangible risk of the "Dead Internet Theory." Under this theory, the vast majority of network traffic and content will be generated by bots. When the cost of forging video, audio, and text is extremely low and can achieve pixel-level realism,⚡ the traditional cognitive argument of "seeing is believing," which sustains social operations, faces a total threat of failure in the digital realm. Political elections could be disrupted by forged scandal recordings, and financial fraud can be perpetrated against individuals via real-time face-swapping. These are no longer sci-fi scenarios from Black Mirror, but imminent realities.
Exacerbated Information Asymmetry and Cognitive Overload: When the rate of machine-generated content exceeds human creation by several orders of magnitude, high-quality authentic information risks being submerged. Humans face exponentially rising screening costs when ensuring the veracity of massive amounts of machine-generated information that may carry specific biases or misleading data. This information overload not only reduces decision-making efficiency but may also lead to a tearing of social consensus. In particular, 👼t he new generation growing up with AI will have a much higher degree of trust in AI than the generation that invented AIGC, thereby increasing the probability of being misled or blindly following algorithms.
The Scarcity of Human Inspiration Amidst AI Convenience: It is well known that a significant part of the value distinction between humans and robots lies in human inspiration, which is difficult for AI to mimic. However, human laziness is also a driver of technological progress. Due to the immense increase in convenience, reliance on AI may make future inspiration an absolute "luxury." Meanwhile, the intellectual property of these inspired creators is being ruthlessly plundered and diluted by the extreme speed of AIGC (much of current secondary creation involves unauthorized "content spinning"). Without technical means of protection, the motivation for original human creation will dry up.
In this context, the primary systemic risk facing digital society is not the awakening or rebellion of AI, but the complete collapse of the bedrock of social trust. Building a verification mechanism that can effectively distinguish truth from falsehood, establish information sources, and remain tamper-proof has become a necessary condition for maintaining a healthy digital ecosystem—and this is precisely where blockchain technology finds its purpose.
2. Blockchain Ownership: Evolving from "Optional Component" to Digital Infrastructure
In the "infinite supply" model constructed by AI, scarcity will become the core anchor of digital asset value. Without scarcity constraints, the value of digital content will approach zero as supply increases infinitely, much like a flood of diamonds.💎 Blockchain technology, as a decentralized distributed ledger, functions essentially to establish digital scarcity and ownership attribution through cryptographic means, thereby re-imbuing digital assets with value.
Institutionalization of Data Provenance: As the barrier to content generation lowers, distinguishing between "human creation" and "AI generation" becomes crucial. In 2022, a custom hand-drawn cartoon could sell for hundreds of dollars💵💴(I bought it 🥹), whereas in 2025, similar non-high-precision custom content can be completed in seconds. The on-chain storage of high-value data (such as news reports, artistic creations, legal contracts, academic papers, and identity information) will become an industry standard. Every digital file will need to carry an unforgeable "birth certificate" and "chain of custody." Digital content lacking a Cryptographic Signature and on-chain timestamp will face a severe "trust discount." The combination of C2PA (Coalition for Content Provenance and Authenticity) standards and blockchain technology will build a trusted verification layer for digital content, making the source and modification history of content transparent to all.
Proof of Personhood and Anti-Sybil Attacks: In an era where automated bots can pass the Turing Test and flood the network, the economic and social value of verifying a user's "human identity" is increasingly prominent. Traditional CAPTCHAs are gradually failing and cannot stop advanced AI Agents. Identity verification systems combining biometrics and Zero-Knowledge Proofs (ZKP) will become key infrastructure for distinguishing human users from AI agents. This is not only to prevent airdrop farming but also to prevent online voting and public opinion manipulation by zombie botnets.
In summary, AI creates an infinite supply of productivity, while blockchain provides trusted scarcity constraints and identity anchors. Logically, the two constitute indispensable complementary gears in the digital economy loop: AI makes the world "faster," and Blockchain makes the world "truer."🚀
3. Reconstruction of the Commercial Paradigm: Autonomous Agent Economics
The combination of AI and blockchain heralds a brand-new mode of economic interaction—the rise of the Machine-to-Machine (M2M) economy. This is not just a change in payment methods, but a fundamental transformation in the nature of economic entities.
Future internet interaction subjects will no longer be limited to humans; billions of Autonomous AI Agents will become natives of cyberspace. Traditional financial infrastructure (such as bank accounts, KYC processes, credit card payment networks) is designed for humans; it does not possess the capability to serve non-human subjects, nor can it meet the demands of high-frequency, micro-amount, 24/7 machine transactions.
Machine-Native Currency Systems: Cryptocurrency is a medium of value exchange naturally adapted to machine logic. AI agents cannot walk into a bank branch to open an account, but they can instantly generate wallet addresses via code and manage private keys. They can utilize stablecoins (like USDC) or specific utility tokens for data procurement, API calls, or computing power leasing. This payment method is not constrained by the intermediary barriers, business hours, or high cross-border fees of traditional finance.
Agent-to-Agent (A2A) Economic Networks: The future commercial landscape will evolve beyond B2B and B2C models toward an A2A (AI Agent-to-AI Agent) 🤖model. For example, an AI Agent responsible for itinerary planning may need to purchase real-time data from another Agent responsible for weather forecasting and pay a deposit to a third Agent responsible for ticket booking. These service exchanges involving micropayments and high-frequency transactions are only economically feasible when relying on high-performance, low-friction blockchain networks. Smart contracts will automatically execute these complex business logics without human intervention.
Synergy with Decentralized Physical Infrastructure Networks (DePIN): The operation of AI requires massive amounts of computing power (GPUs) and data. Through DePIN networks (such as io.net, Render, Gensyn), AI Agents can directly lease idle personal or corporate computing power globally and settle in real-time using Tokens. To a certain extent, this breaks the monopoly of centralized cloud service providers (AWS, Google Cloud), reducing the operational costs of AI. It also provides real utility scenarios for blockchain (although initially, the core source of computing power may still come from traditional giants, in the long run, this model will empower market autonomy and gradually dismantle absolute monopolies).
It is foreseeable that while human users conduct daily mobile payments, AI Agents will automatically complete massive value exchanges on backend blockchain networks, forming a colossal and efficient shadow economy.
4. Crypto: The Value Carrier and Symbiotic Engine of Ownership in the AI Era
Blockchain is not just a database; it is a value network. After clarifying the technical level of anti-counterfeiting/provenance (Section 2) and the commercial level of agent interaction (Section 3), we must delve into the core of assets and finance. Property Rights are the prerequisite for transaction and pricing. In the "infinite supply" model constructed by AI, relying solely on technical means for "anti-counterfeiting" is far from sufficient. We can use Crypto to truly Tokenize and Financialize these rights, giving rise to the RWA (Real World Asset) concept.
The Token, as the granular carrier of ownership and the lifeblood of equity circulation, constitutes the indispensable digital property rights cornerstone of the AI era. This upgrades AI and Crypto from a simple "tool stacking" to a deep "symbiotic evolution."
Tokenization🪙: Transforming abstract rights into programmable digital assets. Crypto uses NFT (Non-Fungible Token) and SFT (Semi-Fungible Token) technologies to transform abstract intellectual property (IP), ownership, copyright📜, unique datasets, fine-tuned model parameters, or even the ownership of an AI Agent itself into unique, immutable on-chain assets.
IP-NFTs as Value Anchors: Every unique style or original work of a human creator can be minted as an NFT. When AI needs to access these works for training or style transfer, it is no longer a traceless plunder but must obtain NFT authorization through on-chain protocols. Here, the Token is not only a copyright certificate but also proof of the right to earnings. For example, RWA music projects like Opulous and Audius tokenize artists' album rights to share revenue with fans in advance.
Data Assetization (Data Tokens): High-quality data from individuals or companies is no longer a static file but an asset that can be encapsulated into Tokens for trading. Every time an AI model calls upon data, it essentially consumes the rights represented by that Token, thereby generating refined revenue and rights protection.
Crypto: Realizing Immediate Settlement and Circulation of Ownership Value Ownership is meaningless if it is not linked to value distribution. Digital currency provides the only execution layer for equity ownership in the AI era.
Micropayments and Streaming Payments: In the high-speed operation of AI, ownership verification often occurs at the millisecond level (e.g., AI quoting a sentence or generating an image). Traditional fiat currency systems cannot handle such extremely small amounts ($0.0001) and high-frequency copyright revenue sharing. Digital currency (Crypto) enables smart contracts to automatically "stream" revenue to Token holders the instant ownership is verified, realizing a closed loop of "use equals ownership verification, ownership verification equals settlement."
Construction of the Incentive Layer: Why would humans spend energy verifying the authenticity of AI content? Why would nodes contribute computing power to maintain network consensus? Because there is Crypto as an incentive. Tokenomics rewards participants who maintain the ownership system through digital currency, thereby building a self-running trust network resistant to AI attacks. This is also the core value of public chain systems and corresponding projects; the internal circulation or local circulation models of consortium chains and private chains are difficult to generalize to a larger scale.
The Co-Evolution of AI and Crypto: A Double Helix Ascent
AI Needs Blockchain/Crypto: Without the ownership and payment facilities provided by blockchain systems, AI creators and users will easily fall into a dead end of rampant piracy, data exhaustion, and inability to monetize. The smarter the AI, the more it needs clear property boundaries to avoid disputes. The current freshness of AI creation exists because of the accumulation of data and creative sharing over the past decades; when these accumulations are exhausted, whether new creativity can fill the gap depends heavily on the meticulous protection of rights.
Crypto Needs AI: AI creates massive amounts of digital assets and high-frequency trading scenarios, providing unprecedented Utility and liquidity for Crypto.
This symbiotic relationship indicates that Crypto is the "Physics" and "Economic System" of the AI era. The combination of the two will reconstruct the production relations of the digital world, allowing the productivity dividends of AI to be fairly returned to every participant through ownership mechanisms.
5. Risk Governance: The Paradigm Shift from "Moral Self-Discipline" to "Technical Constraint"
Current AI development is highly concentrated in a few tech giants (like OpenAI, Google, Meta), continuing the centralized black-box logic of the Web 2.0 era. In this model, the public can only hope that companies maintain a moral self-discipline of "Don't be evil." However, historical experience shows that centralized power is often accompanied by risks of monopoly, data abuse, and algorithmic bias.
Blockchain technology introduces a governance logic of "Can't be evil," strictly constraining system behavior through open-source code, cryptographic proofs, and mathematical contracts:
Zero-Knowledge Machine Learning (ZKML): As an important branch of privacy computing, ZKML allows verifying through mathematical proofs that the inference process of an AI model was executed according to a set algorithm and has not been tampered with, without revealing underlying sensitive data (such as medical records, financial transactions) or core model parameters. This ensures the transparency and auditability of algorithmic decisions, which is crucial for AI applications in high-risk fields like medical diagnosis and credit assessment, solving the "black box trust" problem.
Moreover, public chains that have experienced multiple bull and bear cycles offer a degree of reputational assurance. #NEAR has fully pivoted to AI as the first AI public chain, while projects like Render have transformed from game rendering to AI computing power. BINANCE:ETHUSD ETH, BINANCE:BNBUSDT BSC, #Solana, Cardano, BINANCE:AVAXUSDT #Avalanche, Algorand, Hbar, BINANCE:CFXUSD #Conflux, and others all have their own unique domain advantages, technical characteristics, and deficiencies. Emerging public chains like #Monad BYBIT:MONUSDT are also facing a new round of tokenomics examinations. Addressing the "VC long-cliff" unlock model that has plagued the primary market in the past two years—where institutional chips are locked, but project ecosystem incentives and airdrops circulate early, leading to heavy selling pressure—the market still needs 1-2 years to verify the balance between their token release curves and ecosystem value capture.
Data Sovereignty and Value Distribution: Addressing the widespread issues of data infringement and "data harvesting" in large model training, blockchain projects can return data ownership to users, allowing them to selectively authorize data for training and receive earnings. This reconstructs production relations, enabling data contributors to receive reasonable value returns through Token economic models, thereby incentivizing a higher quality data supply and avoiding the "tragedy of the commons" regarding data exhaustion.
6. Conclusion: Digital Civilization's Dialectic—Reshaping the Future in Chaos and Order
The essence of Artificial Intelligence tends toward entropy increase—it brings about an explosive generation of information, rapid expansion of boundaries, and future uncertainty. The essence of Blockchain, however, tends toward entropy reduction—it strives to establish immutable contracts, anchor unique factual truths, and solidify execution rules.
A robust digital world cannot be composed solely of vibrant "chaos" or absolutely stable "order." The deep integration of AI and Blockchain is not a simple technological stacking, but the inevitable result of the digital ecosystem seeking dynamic equilibrium. If AI is the nuclear power engine driving digital civilization forward, then Blockchain is the navigation system and safety foundation ensuring it does not derail.
For investors and industry practitioners, understanding this "Double Helix" evolutionary trend means grasping the underlying code of digital economic development for the next five to ten years. Our gaze should not be limited to the AI computing power race but should also extend to the Web3 infrastructure layers that provide payment settlement, property definition, and value circulation for silicon-based life.
The future has arrived. This great convergence, beginning with technology and ending with institutions, is on the eve of explosion.
Disclaimer: This article is for educational purposes only. Projects mentioned are for relatively objective description and do not constitute investment advice. Please perform your own research (DYOR).

What A Shocker That Would Be Huh?Blackrock, Saylor and gang are in for some big gains. As for most of you who sold you're in for a rude awakening!
Understanding the Money Flow in the Coin Market
Hello, fellow traders!
Follow me to get the latest information quickly.
Have a great day!
-------------------------------------
(USDT 1D Chart)
(USDC 1D Chart)
I believe that USDT and USDC show a gap up trend when funds flow into the coin market, and a gap down trend when funds flow out.
Therefore, unless the gap turns into a downtrend, the coin market is expected to maintain its upward trend.
-
(USDT.D 1D Chart)
(1M Chart)
As funds flow into and out of the coin market through USDT and USDC, USDT dominance is likely to ultimately rise.
However, I believe that the funds (USDT, USDC) flowing into the coin market will change dominance through trading.
In other words, if USDT dominance declines, the coin market is likely to trend upward.
This is because coins (tokens) are being purchased with USDT.
If USDT dominance remains below 4.91 or declines, the coin market is likely to trend upward.
Therefore, if USDT dominance rises without any evidence of fund outflows through USDT or USDC, it can be interpreted as a temporary increase in selling pressure.
If USDT or USDC gaps downward in this situation, the price will fail to defend, leading to a downward trend in the coin market.
Therefore, it's best to look at the USDT and USDT.D charts to understand the general flow of funds.
-
(BTC.D 1D chart)
(1M chart)
I believe BTC dominance reflects the relationship with altcoins, rather than the rise or fall of the coin market or the rise and fall of BTC itself.
In other words, rising BTC dominance indicates a concentration of funds toward BTC, increasing the likelihood that altcoins will gradually move sideways or experience a downward trend.
Therefore, for an altcoin bull market to begin, it must remain below 55.01-62.47 or show a downward trend.
Therefore, it is recommended to check BTC dominance before trading altcoins and develop a trading strategy.
--------------------------------------------------
Summary of the above:
For the coin market to continue its bull market,
1. USDT and USDC must maintain a gaping upward trend.
2. USDT dominance should decline below 4.91.
3. BTC dominance should decline below 55.01.
-
Thank you for reading.
I wish you successful trading.
--------------------------------------------------
STABLECOIN SUPERCYCLE CAN SEND AAVE TO $5,000We have a #HVF forming that is yet to breakout.
The fundamental driver is of course stablecoin growth. Namely the ones that the United States allow to dominate in this space. Permissioned quasi CBDC's like USDT and USDC.
So what is AAVE if you don't know;
Aave (AAVE) is a decentralized finance (DeFi) protocol enabling users to lend, borrow, and earn interest on crypto assets without intermediaries through automated liquidity pools.
Liquidity Markets – Users deposit assets into pools to earn yield or borrow against collateral.
Flash Loans – Pioneered uncollateralized loans executable within a single blockchain transaction.
Community Governance – AAVE token holders vote on protocol upgrades, risk parameters, and expansions.
So there we have it ... congrats to hodler's of this protocol that was once called ETHLend.
Theres still plenty meat left on the bone for these next few years.

STABLE COINS DOMINANCE BROKE THE SUPPORTAs the stable coins dominance broke the support then in any days rally comes to crypto market like in April's 12 & July's 8th

Trump’s Bond Strategy vs. Saylor’s High-Stakes Bitcoin BetBitcoin ( BITSTAMP:BTCUSD ) Macro Analysis: Trump’s Bond Strategy vs. Saylor’s High-Stakes Bitcoin Bet
1. Trump’s Bond Play and Crypto Ventures: A Dual Macro Hedge
Since returning to office in January 2025, Donald Trump has purchased over $100 million in corporate and municipal bonds, including debt from Meta, Citigroup, and local governments. These purchases are notable for two reasons:
Yield Lock: Trump’s bond buys were made at yields near 5%, a level not seen since the pre-2022 low-rate era. If the Federal Reserve cuts rates as expected in late 2025, the value of these bonds will rise, and their fixed 5% coupons will become increasingly attractive compared to new, lower-yielding issues.
Policy Alignment: Trump has publicly pressured the Fed to lower rates, which would further inflate the value of his bond portfolio. His administration’s fiscal and trade policies (e.g., tariffs, deregulation) could also indirectly support bond markets by stimulating demand for safe-haven assets.
Trump’s Crypto Ventures: Profiting from the Public
Unlike traditional crypto investors, the Trump family’s involvement in the sector is not built on holding Bitcoin or other digital assets. Instead, their companies focus on selling crypto-related products, cashing in on trading fees, and enriching themselves at the expense of an uninformed public. These ventures have been widely criticized as predatory, leveraging Trump’s political influence and public persona to attract unsuspecting investors into high-fee, low-value schemes—effectively an open scam that prioritizes short-term profits over genuine market participation.
Implications for Bitcoin:
If rates fall, bond yields become less competitive with risk assets like Bitcoin, potentially driving capital back into crypto.
However, Trump’s bond strategy and his family’s exploitative crypto ventures signal a preference for traditional financial instruments and extractive business models over supportive crypto policies. This could temper any positive impact on Bitcoin from his administration’s economic agenda.
2. Michael Saylor’s MicroStrategy: A Leveraged Bitcoin Bet
MicroStrategy, under Michael Saylor, has become the world’s largest corporate holder of Bitcoin, with over 446,000 BTC (worth ~$50 billion as of September 2025). The company’s strategy relies heavily on convertible debt issuance:
Debt Structure: MicroStrategy has issued billions in zero- or ultra-low-interest convertible notes (as low as 0.625%), using the proceeds to buy Bitcoin. This allows the company to avoid high interest payments and benefit from Bitcoin’s price appreciation.
Risks:
Leverage: If Bitcoin’s price falls sharply, MicroStrategy may face margin calls or be forced to sell BTC to meet debt obligations, exacerbating downward pressure on $BTCUSD.
Equity Dilution: The company’s aggressive stock issuance (planned dilution from 330M to 10B shares) could depress shareholder value if Bitcoin underperforms.
Recent Performance:
MicroStrategy’s stock NASDAQ:MSTR has outperformed Bitcoin in 2024–2025, but its valuation is now highly correlated with BTC’s price and market sentiment toward leverage.
3. Federal Reserve Policy: The Wild Card
Current Rates: The Fed has held rates at 4.25–4.50% since late 2024, but markets anticipate cuts in late 2025 (potentially 0.50–0.75% by year-end).
Impact on Bitcoin:
Rate Cuts: Historically, lower rates boost risk assets. Bitcoin could benefit from increased liquidity and weaker dollar, as seen in late 2024 when BTC rallied following Fed easing.
Inflation & Macro Risks: If cuts are delayed or inflation resurges, Bitcoin may face headwinds as investors favor bonds or cash.
4. The Crypto Winter Thesis: Is Doomsday Coming?
Bull Case: If the Fed cuts aggressively and liquidity floods markets, Bitcoin could resume its upward trajectory, especially if institutional demand (e.g., ETF inflows) remains strong.
Bear Case:
MicroStrategy’s Leverage: A sharp BTC drop could force NASDAQ:MSTR to liquidate holdings, triggering a cascade effect.
Regulatory Risks: Trump’s bond focus, his family’s extractive crypto ventures, and potential regulatory crackdowns could dampen sentiment.
Macro Uncertainty: Geopolitical tensions, recession fears, or a stronger-than-expected dollar could further pressure risk assets.
Technical Outlook:
BITSTAMP:BTCUSD is currently trading at $109,430 (as of September 4, 2025), up 1.63% over the past week but still range-bound between $107K–$112K.
Support/Resistance: Watch $105K (psychological support) and $115K (next resistance). A breakout or breakdown here could signal the next major move.
Conclusion: A Tale of Two Strategies
Trump’s bond purchases and push for rate cuts could indirectly benefit Bitcoin by reducing the appeal of fixed income, but his administration’s stance on crypto, and his family’s history of exploiting the public through crypto ventures, remains a significant red flag. Meanwhile, MicroStrategy’s leveraged Bitcoin bet is a high-risk, high-reward play that could either propel BITSTAMP:BTCUSD to new highs or accelerate a downturn if forced liquidations occur.
Traders should monitor:
Fed meetings (next: September 16–17, 2025) for rate cut signals.
MicroStrategy’s debt maturity schedule and Bitcoin holdings.
Trump’s policy shifts on crypto regulation and fiscal stimulus, as well as any new developments in his family’s crypto-related businesses.
Final Thought: The stage is set for a volatile Q4 2025. While the macro backdrop favors risk assets if the Fed eases, the specter of leverage unwinding, regulatory risks, and the Trump family’s extractive crypto practices looms large. Caution and active risk management are advised.
NASDAQ:MSTR NASDAQ:COIN TVC:GOLD TVC:SILVER NASDAQ:MARA BITSTAMP:ETHUSD CRYPTOCAP:USDC NASDAQ:TSLA NASDAQ:NVDA

WLFI Launch At Ridiculous Valuation | Stablecoin ComparisonBINANCE:WLFIUSDT.P is a protocol affiliated with the Trump family and managed by Chase Herro and Zak Folkman - both with a notorious past with Herro reffering to himself as the 'scumbag of the internet'.
World Liberty Financial has a major product in USD1. As of today its the sixth larget stablecoin by supply. $2.4b circulating with increasing adoption. USD1 is the main product of WLFI.
In the video I compare WLFI and USD1 to its competitors in BINANCE:ENAUSDT and USDe, NYSE:CRCL and USDC.
With this comparison you see a massive overvaluation of WLFI at ~$23b compared to $2.4b supply of USD1. Relative to ENA at $9b with $12b USDe supply. Circle is $30b with $70b USDC.
This shows an extreme extra cost added to WLFI with no real current product to rationalise it. Not to say that there wont be new products or a major expansion of USD1.. only that its priced as if theyve already achieved it.

The successful trader anticipates activity in BSC🔁 Wallet 0x1ebab9c329317082577f0e495cbe5b0d4958c5e7 just bridged: 4 000 USDC left Ethereum → HitBTC, then 3 915 USDC hit BNB Chain minutes later.
DefiLlama shows ~$14M fresh inflows today in BSC, while ETH flows cool—signaling a rotation play.
Expect this whale to farm BSC yield or snipe rising alts next 📈
🔝 Score: #39 | Balance: $13.4k | Results: $16.4k→$219.5k (+1,340 %, 44 trades, avg buy $1,020 / sell $2,643).

USDCHF – Two Levels, One PlanWe’re watching two key resistance zones for a potential short.
If the first level holds and gives a signal, we’ll short from there.
If that level breaks, we may switch to a short-term buy up to the next level.
Once price reaches the second resistance, we’ll be ready for another sell opportunity.
No predictions — just following the flow.

Recently Circle launched native USDC & CCTP on $SEIThis enables fast, low-cost stablecoin transfers on the efficient L1 blockchain, boosting liquidity and institutional adoption
This news made me curious about the chart
The price itself is reclaiming and holding a critical HTF level while breaking the bearish structure
The RSI above the 50 level is signaling a regaining of the bullish momentum
Perfect alignment to grab some for the longterm portfolio

Binance Blinked! High level of USDC volume across Binance..Binance has for many years tried their own versions of buying US debt with USD made from selling a stablecoin of their own. This has been squashed nearly every time and has most likely hindered the flow on binance itself.
It seems binance may have blinked. USDC has been flooding into Binance this year maintaining often very high levels of relative volume. This flow is overall better than if neither party capitulated. Must be careful of different streams of volume fragmenting both bullish and bearish data. While USDT is seeing all time highs its market share is falling with the wider adoption of stablecoins on chain and in traditional finance.
All this is occuring as stablecoin regulation is being passed in the US www.tradingview.com and Dimon says NYSE:JPM will be buying COINBASE:BTCUSD for clients soon

Steibles dominance: USDT.D+USDC.DThe graphic shows Kryptan blood and tears - in red variant. And bullish crypto - triumph in blue!
I am of course counting on the blue variant, as:
1)There has been no normal bulls with the fall of bitcoin dominance.
2)The American newly elected tech team hasn't shown anything meaningful except loud populist statements and family memes.
3)Stimulus with rate cuts, QE, M2 and other liquidity releases haven't really kicked in yet
So I'm waiting for an epic risk on and exit pamp!
Translated with DeepL.com (free version)

Wen Crypto Rally?If we want #CryptoRally , then first of all #usdc dominance must break down daily EMA200 i highlighted in the chart. If this support plays out well, then mid term W bounce of #usdcd must continue. And also in BTCXAU chart, 33 must be broken to be bullish for BTC.

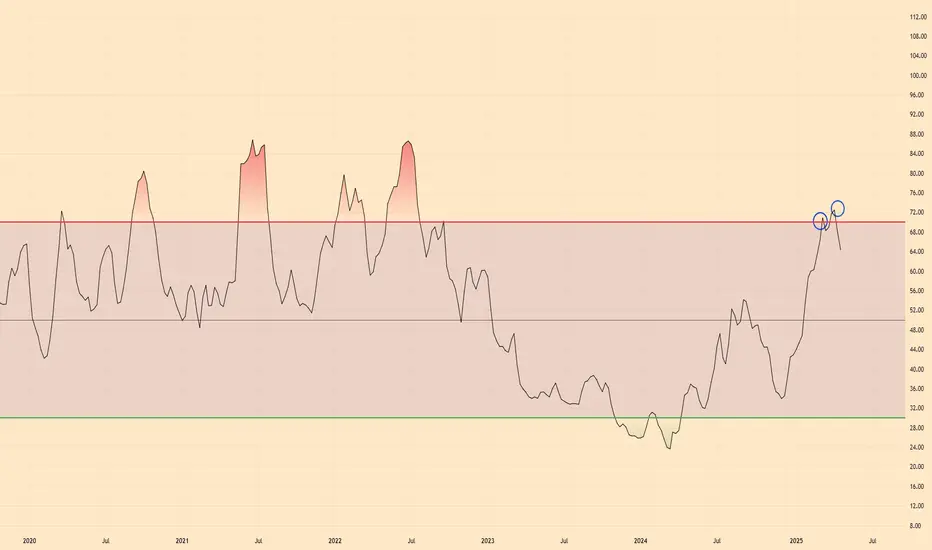
$USDC | Altseason Incoming.....FinallyCRYPTOCAP:USDC Dominance looks to be Double Topped on the RSI side and per historic movements, this looks promising for the market.
I say, BRING ON THE ALTCOINS.
USDT the big rebound - The Rise from the Ashesin my newest finding i will tell you about USDT rise from the Ashes
as you can see we build a very volume heavy low
corresponding to a low in March and a really good rebound is about to happen
be prepared for heavy downturns in the crypto market
as always, just my opinion and looking for ppl who share thougths on it
no trading advice

USDT Dominance + USDC Dominance 1WIMPORTANT!
CRYPTOCAP:USDT Dominance + CRYPTOCAP:USDC Dominance
These two dominances show us the cash position in the market. This is the crudest expression.
With the rise of this chart, we can see that there is an increase in cash transitions in the market or hot money inflows to the market.
In my previous post, I shared information that there may be a movement from the bottom to the falling trend line (red) above. Because this possibility was much higher. The reason was that it made a double bottom formation, supported by the rising trend line (green) and also pointed to a harmonic pattern.
With the OB level on the daily chart, the price retreated with the falling trend line (red) acting as resistance. With its retracement, the upward movement on the BTC side was realised. Because as it is known, this chart works in inverse correlation with the BTC chart.
If this chart continues its upward movement, that is, if it breaks the falling trend line and provides a movement towards 11% levels, then we can see much deeper declines on the BTC side.
Let me add one more comment to overlap here;
On the BTC side, I have been emphasising that I have an expectation of $123k - $130k for the first batch for a long time. So if this chart moves one round lower than these levels, to the bottom of the rising trend line (green), it is possible to see the levels I mentioned on the BTC side. Then again, the dominance chart will now move upwards and may cross the red line, which is the falling trend line, and move towards 11% levels.
Of course, there are other OB resistances on the route, and a pre-bullish retest will probably do. This gives misleading information that the decline on the BTC side is over.
If BTC really returns from the level I mentioned above and moves as I explained in this chart, there may not be a second spring in the market until it reaches 11% levels.
