DXY: long-term view🛠 Technical Analysis: On the weekly timeframe (W1), the U.S. Dollar Index is displaying a significant structural shift. Despite a brief breach of the psychological 100 level, the price failed to generate a strong downward impulse, suggesting that bearish momentum is exhausted.
As noted on the chart, "sellers are being bought out," paving the way for a recovery back above the 100 level. The primary objective of this move is a test of the long-term descending resistance line, which currently aligns with the 107.384 target.
———————————————
❗️ Trade Parameters (BUY)
———————————————
➡️ Entry Point: Confirmation of price holding above the pivot level (approx. 100.524).
🎯 Take Profit: 107.384 (Long-term Descending Resistance).
🔴 Stop Loss: Below the recent accumulation lows (approx. 97.787).
⚠️ Disclaimer: This is a potential trade idea based on current analysis; market conditions and price direction are subject to change based on news factors and volatility.
Usdindex!!

US Dollar: Bearish! Sell The Rip!Welcome back to the Weekly Forex Forecast for the week of Dec 15 - 19th.
In this video, we will analyze the following FX market: USD Dollar
The USD is bearish. I will look for a short term pullback to the -FVG and sell it from there. I expect price will hold from the -FVG and act as resistance.
Enjoy!
May profits be upon you.
Leave any questions or comments in the comment section.
I appreciate any feedback from my viewers!
Disclaimer:
I do not provide personal investment advice and I am not a qualified licensed investment advisor.
All information found here, including any ideas, opinions, views, predictions, forecasts, commentaries, suggestions, expressed or implied herein, are for informational, entertainment or educational purposes only and should not be construed as personal investment advice. While the information provided is believed to be accurate, it may include errors or inaccuracies.
I will not and cannot be held liable for any actions you take as a result of anything you read here.
Conduct your own due diligence, or consult a licensed financial advisor or broker before making any and all investment decisions. Any investments, trades, speculations, or decisions made on the basis of any information found on this channel, expressed or implied herein, are committed at your own risk, financial or otherwise.

US Dollar: Bearish! Look To Sell it towards 98.56!Welcome back to the Weekly Forex Forecast for the week of Dec 8-15th.
In this video, we will analyze the following FX market: USD Dollar
The USD is currently bearish, sitting in a Daily -FVG. If the FVG holds, the sell off will continue from last week. Should the -FVG fail, then hold off on sells! A close above the -FVG will be a bullish indication.
Wed's FOMC will likely weaken the currency further, as institutions have seemingly baked in their bearish bets.
Enjoy!
May profits be upon you.
Leave any questions or comments in the comment section.
I appreciate any feedback from my viewers!
Disclaimer:
I do not provide personal investment advice and I am not a qualified licensed investment advisor.
All information found here, including any ideas, opinions, views, predictions, forecasts, commentaries, suggestions, expressed or implied herein, are for informational, entertainment or educational purposes only and should not be construed as personal investment advice. While the information provided is believed to be accurate, it may include errors or inaccuracies.
I will not and cannot be held liable for any actions you take as a result of anything you read here.
Conduct your own due diligence, or consult a licensed financial advisor or broker before making any and all investment decisions. Any investments, trades, speculations, or decisions made on the basis of any information found on this channel, expressed or implied herein, are committed at your own risk, financial or otherwise.

US Dollar: Look For Buys As The Pullback Ends!Welcome back to the Weekly Forex Forecast for the week of Nov. 17 - 21st.
In this video, we will analyze the following FX market: USD Dollar
The USD was in retracement last week. It looks like that may be ending, and a new bullish leg could potential start early this week.
Wait patiently for the bullish shift in the market at a key poi... like the Weekly +FVG highlighted in the video. The 1H TF should make this obvious, and look to long the USD against its currency counterparts.
Enjoy!
May profits be upon you.
Leave any questions or comments in the comment section.
I appreciate any feedback from my viewers!
Disclaimer:
I do not provide personal investment advice and I am not a qualified licensed investment advisor.
All information found here, including any ideas, opinions, views, predictions, forecasts, commentaries, suggestions, expressed or implied herein, are for informational, entertainment or educational purposes only and should not be construed as personal investment advice. While the information provided is believed to be accurate, it may include errors or inaccuracies.
I will not and cannot be held liable for any actions you take as a result of anything you read here.
Conduct your own due diligence, or consult a licensed financial advisor or broker before making any and all investment decisions. Any investments, trades, speculations, or decisions made on the basis of any information found on this channel, expressed or implied herein, are committed at your own risk, financial or otherwise.

US Dollar: Buy The Rally!Welcome back to the Weekly Forex Forecast for the week of Nov. 10-14th
In this video, we will analyze the following FX market: USD Dollar
The USD is in a pullback... that I believe is ending. Buying is the best bet! Once price gives the signature of a market shift from bearish to bullish, buys are valid!
Enjoy!
May profits be upon you.
Leave any questions or comments in the comment section.
I appreciate any feedback from my viewers!
Disclaimer:
I do not provide personal investment advice and I am not a qualified licensed investment advisor.
All information found here, including any ideas, opinions, views, predictions, forecasts, commentaries, suggestions, expressed or implied herein, are for informational, entertainment or educational purposes only and should not be construed as personal investment advice. While the information provided is believed to be accurate, it may include errors or inaccuracies.
I will not and cannot be held liable for any actions you take as a result of anything you read here.
Conduct your own due diligence, or consult a licensed financial advisor or broker before making any and all investment decisions. Any investments, trades, speculations, or decisions made on the basis of any information found on this channel, expressed or implied herein, are committed at your own risk, financial or otherwise.

USD Index, AUD/USD Hint at Near Term ReversalsAs outlined in last week’s video, I suspect the US dollar may have the potential to break higher as part of its wave C before momentum realigns with its dominant bearish trend. However, Monday’s shooting star candle just below 100, coupled with an overbought RSI (2), warns of a potential pullback ahead of any breakout.
Also note that AUD/USD has formed a spinning top doji near the September low, suggesting that bearish momentum is waning despite closing lower for a fourth consecutive day.
With the RBA likely to deliver a hawkish tone when they hold rates today, there’s potential for a short-term bounce in the Australian dollar. However, if I’m right in expecting an eventual bullish breakout in the US dollar index, I’ll also be watching for evidence of a swing high on AUD/USD once that anticipated bounce is delivered.
Matt Simpson, Market Analyst at City Index

Forex Traders Focus on Central Bank DecisionsForex Traders Focus on Central Bank Decisions
As expected, the Federal Reserve yesterday cut the Federal Funds Rate from 4.25% to 4.00%, while Jerome Powell’s remarks reduced the likelihood of further rate cuts. Meanwhile, decisions by other key central banks are also influencing the currency markets, according to Forex Factory:
→ The Bank of Canada lowered its policy rate from 2.50% to 2.25%, in line with market expectations. Its official statement highlighted risks of slower GDP growth, “continued weakness in the economy”, and concerns over U.S. trade relations and tariffs.
→ The Bank of Japan (BoJ) kept interest rates unchanged but signalled readiness to raise borrowing costs if economic conditions allow. This has shifted traders’ focus towards a possible rate hike as early as December.
→ The European Central Bank (ECB) is expected to leave its key rate steady, with the decision due at 16:15 GMT+3 today.
→ Next week, both the Reserve Bank of Australia and the Bank of England are scheduled to announce their policy decisions.
Against this backdrop, attention is increasingly turning to the Dollar Index (DXY) chart today.
Technical Analysis of the DXY Chart
On 19 September, we conducted a key analysis of the DXY chart, noting that:
→ The long-term downward channel (shown in red) remains relevant, divided into quarters by the intermediate QL and QH lines.
→ The index had rebounded from the QL line (marked by an arrow).
→ A bullish scenario was emerging.
Following that rebound, the price began to form an upward trajectory, reaching the upper boundary of the channel by 10 October — which, as anticipated, acted as strong resistance.
Currently, the DXY chart displays a narrowing triangle pattern, where:
→ The resistance is defined by the upper edge of the long-term descending channel that has contained the index’s 2025 movements.
→ The short-term upward channel from the September low remains intact.
This formation may reflect both the current balance of the U.S. dollar against a basket of major currencies and the uncertainty among analysts about its future direction.
Given the combination of central bank decisions, the U.S. government shutdown, geopolitical risks, and trade tensions, a breakout from this triangle could mark the start of a major trend lasting several weeks or even months.
Yesterday’s Fed decision strengthened the dollar, breaking through a local Bullish Flag pattern (shown in blue) and increasing the likelihood of further upward momentum.
This article represents the opinion of the Companies operating under the FXOpen brand only. It is not to be construed as an offer, solicitation, or recommendation with respect to products and services provided by the Companies operating under the FXOpen brand, nor is it to be considered financial advice.

Technical Outlook for USD Index, EUR/USD, GBP/USDWhile my bias for the US dollar index remains bearish on the higher timeframes, a near-term bullish setup may have emerged. And that could see a pullback on EUR/USD and possible GBP/USD.
Matt Simpson, Market Analyst at City Index and Forex.com.

US Dollar: Hold Off On Selling The USD! Higher Prices Ahead?Welcome back to the Weekly Forex Forecast for the week of Sept 22 - 26th.
In this video, we will analyze the following FX market: USD Dollar
The USD recovered last Friday after the FED cut the rate .25 basis points. The USD was also supported by higher T-note yields.
What's next?
Although price swept the Swing Low last week, it recovered, trading back up into the consolidation. There is a bullish tone to this movement, and a manipulative one as well. The sell side LQ was taken, followed by a quick recovery.
The highlighted bullish FVG indicates bullish order flow.
There is a potential iFVG just above the +FVG. Monitor it to see if price will respect it as support. Should it hold, look to long the USD.
Wait and react. Do not predict.
Enjoy!
May profits be upon you.
Leave any questions or comments in the comment section.
I appreciate any feedback from my viewers!
Disclaimer:
I do not provide personal investment advice and I am not a qualified licensed investment advisor.
All information found here, including any ideas, opinions, views, predictions, forecasts, commentaries, suggestions, expressed or implied herein, are for informational, entertainment or educational purposes only and should not be construed as personal investment advice. While the information provided is believed to be accurate, it may include errors or inaccuracies.
I will not and cannot be held liable for any actions you take as a result of anything you read here.
Conduct your own due diligence, or consult a licensed financial advisor or broker before making any and all investment decisions. Any investments, trades, speculations, or decisions made on the basis of any information found on this channel, expressed or implied herein, are committed at your own risk, financial or otherwise.

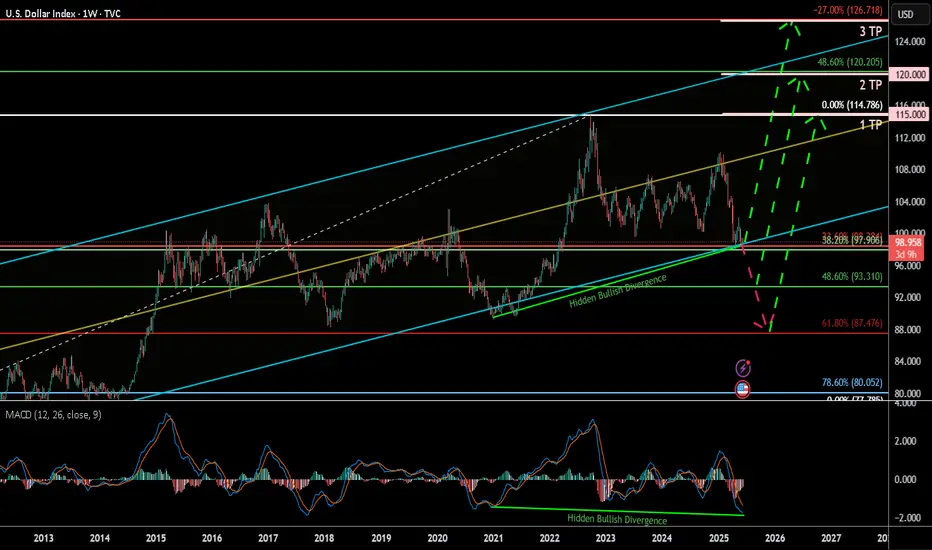
U.S. Dollar Index (DXY) Weekly 2025Summary:
The U.S. Dollar Index (DXY) has corrected down to the key 38.60% Fibonacci retracement zone and is currently showing signs of a potential bullish reversal, bolstered by a clear hidden bullish divergence on the MACD. This may signal a renewed rally toward key upside targets, especially if the 93.3–99.9 support Zone holds.
Chart Context:
Current Price: 98.864
Key Fib Support: 38.60% @ 99.906, 48.60% @ 93.310, 61.80% @ 87.476
Support Zone: 93.3–99.9 USD
Hidden Bullish Divergence: Observed both in 2021 and now again in 2025 on the MACD
Trendline Support: Long-term ascending trendline holding since 2011
Fib Extension Targets (Trend-Based):
TP1: 115.000
TP2: 120.000
TP3: 126.666
Key Technical Observations:
Fibonacci Confluence: DXY is bouncing from a strong Fib cluster between 93.310 and 99.906, historically acting as a reversal zone.
Hidden Bullish Divergence: Suggests potential upside despite price weakness.
Downtrend Retest: Price may revisit 93.3–87.4 before confirming full reversal.
Breakout Pathway: Green dashed arrows outline the likely recovery trajectory toward 114–126 range.
Indicators:
MACD: Showing hidden bullish divergence and potential signal crossover.
Trendline Support: Holding intact from 2021 low.
Fib Levels: Used for retracement and trend-based extension.
Fundamental Context:
Interest Rate Outlook: If U.S. inflation remains controlled and Fed signals future hikes or sustained high rates, DXY strength may persist.
Global Liquidity & Recession Risk: If risk aversion returns, the dollar may rise as a safe haven.
Geopolitical Risks: Conflicts, trade tensions, or BRICS dedollarization efforts may create volatility.
Our Recent research suggests the Fed may maintain higher-for-longer rates due to resilient labor markets and sticky core inflation. This supports bullish USD bias unless macro shifts rapidly.
Why DXY Could Continue Strengthening:
Robust U.S. economic performance & monetary policy divergence
U.S. GDP growth (~2.7% in 2024) outpaces developed peers (~1.7%), supporting stronger USD
The Fed maintains restrictive rates (4.25–4.50%), while the ECB pivots to easing, widening the policy and yield gap .
Inflation resilience and Fed hawkishness
Labor markets remain tight, keeping inflation “sticky” and delaying expected rate cuts; market-implied cuts for 2025 have been pushed into 2026
Fed officials (e.g. Kugler) emphasize ongoing tariff-driven inflation, suggesting rates will stay elevated.
Safe-haven and yield-seeking capital flows
With global risks, capital favors USD-denominated assets for yield and stability
Why the Dollar Might Face Headwinds
Fiscal expansion & trade uncertainty
Ballooning U.S. deficits (~$3.3 trn new debt) and erratic tariff policy undermine confidence in USD
Wall Street’s consensus bearish position.
Major banks largely expect a weaker dollar through 2025–26. However, this crowded bearish sentiment poses a risk of a sharp rebound if data surprises occur
barons
Tariff policy risks
Trump's new tariffs could dampen dollar demand—yet if perceived as fiscal stimulus, they could unexpectedly buoy the USD .
Synthesis for Our Biases
A bullish DXY thesis is well-supported by:
Economic and policy divergence (U.S. growth + Fed vs. peers).
Hawkish Fed commentary and sticky inflation.
Safe-haven capital inflows.
Conversely, risks include:
Deteriorating fiscal/trade dynamics.
Potential Fed pivot once inflation shows clear decline.
A consensus that could trigger a short squeeze or reversal if overstretched.
Philosophical / Narrative View:
The dollar remains the world’s dominant reserve currency. Periodic dips often act as strategic re-accumulation phases for institutional capital—especially during global macro uncertainty. A return toward 120+ reflects this persistent demand for USD liquidity and safety.
Bias & Strategy Implication:
1. Primary Bias: Bullish, contingent on support at 93.3–99.9 holding.
2. Risk Scenario: Breakdown below 93.3 invalidates bullish thesis and targets 87.4–80 zones.
Impact on Crypto & Gold and its Correlation and Scenarios:
Historically, DXY has had an inverse correlation to both gold and crypto markets. When DXY strengthens, liquidity tends to rotate into dollar-denominated assets and away from risk-on trades like crypto and gold. When DXY weakens, it typically acts as a tailwind for both Bitcoin and gold.
Correlation Coefficients:
DXY vs. Gold: ≈ -0.85 (strong inverse correlation)
DXY vs. TOTAL (crypto market cap): ≈ -0.72 (moderate to strong inverse correlation)
Scenario 1: DXY Rallies toward 115–126 then, Expect gold to correct or stagnate, especially if yields rise. Crypto likely to pull back or remain suppressed unless specific bullish catalysts emerge (e.g., ETF flows or tech adoption).
Scenario 2: DXY ranges between 93–105 then Gold may consolidate or form bullish continuation patterns. Then Crypto may see selective strength, particularly altcoins, if BTC.D declines.
Scenario 3: DXY falls below 93 and toward 87 Then Gold likely to rally, possibly challenging all-time highs. Crypto could enter a major bull run, led by Bitcoin and followed by altcoins, fueled by increased liquidity and lower opportunity cost of holding non-USD assets.
Understanding DXY’s direction provides valuable insight for portfolio positioning in macro-sensitive assets.
Notes & Disclaimers:
This analysis reflects a technical interpretation of the DXY index and is not financial advice. Market conditions may change based on unexpected macroeconomic events, Fed policy, or geopolitical developments.
US Dollar: Bearish! Buyside LQ Sweep Before Rate Cut?Welcome back to the Weekly Forex Forecast for the week of Sept 15 - 19th.
In this video, we will analyze the following FX market: USD Dollar
The USD has a .25 basis point rate cut coming Wednesday. Will there be a manipulation of the buy side liquidity before prices turn downward? I am looking out for this fake out maneuver by MMs, being mindful the rate cut will weaken the USD against its counterparts. A short term move higher before the market turns bearish with the news announcements is more then possible.
Wait and react. Do not predict.
React and do not predict.
Enjoy!
May profits be upon you.
Leave any questions or comments in the comment section.
I appreciate any feedback from my viewers!
Disclaimer:
I do not provide personal investment advice and I am not a qualified licensed investment advisor.
All information found here, including any ideas, opinions, views, predictions, forecasts, commentaries, suggestions, expressed or implied herein, are for informational, entertainment or educational purposes only and should not be construed as personal investment advice. While the information provided is believed to be accurate, it may include errors or inaccuracies.
I will not and cannot be held liable for any actions you take as a result of anything you read here.
Conduct your own due diligence, or consult a licensed financial advisor or broker before making any and all investment decisions. Any investments, trades, speculations, or decisions made on the basis of any information found on this channel, expressed or implied herein, are committed at your own risk, financial or otherwise.

DXY Analysis – Are Bad News Already Priced In?Since Trump entered the White House, the U.S. Dollar has taken a hard hit against its major counterparts, losing more than 10% overall.
But looking closer at the chart, we see a different story: since the April low around 97.80, the DXY has been stuck in a range-bound pattern, with the exception of July’s dip that was quickly reversed.
Lately, the USD has faced strong headwinds:
• Two weak NFP reports in a row.
• The Fed hinting at rate cuts.
• A constant flow of bearish headlines.
And yet, the Dollar did not collapse to fresh lows — instead, it simply revisited the same levels as before. This is a classic market signal that bad news may already be priced in.
From a technical standpoint, August was nothing but an annoying tight range:
• Support around 97.50.
• Resistance near 98.50.
Now, although the index looks like it’s breaking lower, I suspect this is another false breakdown, one that could be reversed quickly. If that plays out, the stage is set for a push higher — potentially to the 100 zone, a clean 3% rise from current levels.
Such a move would naturally translate into pressure on the majors:
• EUR/USD could slide back toward 1.14.
• GBP/USD could retreat near 1.35.
For now, I’m watching closely for reversal signals. The market has punished the USD for months, but if sellers are exhausted, the Dollar may surprise to the upside. 🚀

US Dollar: Bearish August. Rate Cuts Likely. Sell USD?Welcome back to the Weekly Forex Forecast for the week of Aug 25 - 29th.
In this video, we will analyze the following FX market: USD Dollar
The USD has been weak since the start of August. It took a huge move down Friday with FED Chairman Powell's dovish take on rate cuts.
So, this market is is not one to take buys in.
However, we are still in correction territory, looking at the Monthly and Weekly candles. Be mindful that the market can find support at current levels, even though it has been bearish for 7+ months. The Swing Low has not been violated as yet.
Be cautious. No buys are justified without a Bullish BOS. Sells are the best best, but keep your head on a swivel!
React and do not predict.
Enjoy!
May profits be upon you.
Leave any questions or comments in the comment section.
I appreciate any feedback from my viewers!
Disclaimer:
I do not provide personal investment advice and I am not a qualified licensed investment advisor.
All information found here, including any ideas, opinions, views, predictions, forecasts, commentaries, suggestions, expressed or implied herein, are for informational, entertainment or educational purposes only and should not be construed as personal investment advice. While the information provided is believed to be accurate, it may include errors or inaccuracies.
I will not and cannot be held liable for any actions you take as a result of anything you read here.
Conduct your own due diligence, or consult a licensed financial advisor or broker before making any and all investment decisions. Any investments, trades, speculations, or decisions made on the basis of any information found on this channel, expressed or implied herein, are committed at your own risk, financial or otherwise.

US Dollar Index (DXY) Rises Ahead of Fed Chair’s SpeechUS Dollar Index (DXY) Rises Ahead of Fed Chair’s Speech
On Monday, we:
→ noted that the US Dollar Index (DXY) was consolidating at the start of a week packed with key events;
→ outlined a descending channel (shown in red);
→ highlighted that the price was trading around the channel’s median line, signalling a balanced market;
→ suggested that a test of one of the quarter lines (QL or QH), which divide the channel into four parts, could take place.
As the DXY chart indicates, since then the balance has shifted in favour of buyers, with the price forming an upward trajectory (shown in purple lines) and breaking through short-term resistance R (which has now turned into support, as marked by the blue arrow). Support line S remains relevant.
Today brings the key event that may have the greatest impact on the US Dollar Index (DXY) this week – Jerome Powell’s speech at the annual Jackson Hole Symposium.
This appearance is particularly significant because:
→ it is likely to be Powell’s last speech after seven years as Fed Chair, with his term expiring in May amid ongoing tensions with President Trump;
→ market participants will closely monitor the tone of his remarks, as a rate cut is expected in September, while recent economic data – namely the rise in the Producer Price Index – suggest that the US economy could face renewed inflationary pressures due to Trump’s tariffs.
Technical analysis of the DXY chart
From a bullish perspective, in the short term the US dollar is advancing within the purple channel, supported by:
→ the lower boundary of this channel;
→ the demand imbalance zone in favour of buyers (shown in green), confirmed by yesterday’s sharp bullish candle.
From a bearish perspective:
→ the RSI has entered overbought territory;
→ bullish momentum may fade after a breakout above the QH line;
→ a key resistance at the 99 level lies nearby – a level that reclaimed its role as resistance at the beginning of August (indicated by black arrows).
A corrective pullback in the US Dollar Index (DXY) could happen after its rally to the highest level since 6 August. However, the further trajectory will largely depend on Powell’s words this evening. According to Forex Factory, the speech is scheduled for 17:00 GMT+3.
This article represents the opinion of the Companies operating under the FXOpen brand only. It is not to be construed as an offer, solicitation, or recommendation with respect to products and services provided by the Companies operating under the FXOpen brand, nor is it to be considered financial advice.

US Dollar: Bullish For The Near Term?Welcome back to the Weekly Forex Forecast for the week of Aug 11 - 15th.
In this video, we will analyze the following FX market:
USD Index
The US Dollar has been weakened by bad employment numbers, the expectation for interest rate cuts in the next FED meeting, and inflation sneaking higher. CPI Data is coming Tuesday, and a soft number will add to selling pressure.
However, price is at levels where a the bearish retracement could end, and the higher low could be established.
React and do not predict.
Enjoy!
May profits be upon you.
Leave any questions or comments in the comment section.
I appreciate any feedback from my viewers!
Disclaimer:
I do not provide personal investment advice and I am not a qualified licensed investment advisor.
All information found here, including any ideas, opinions, views, predictions, forecasts, commentaries, suggestions, expressed or implied herein, are for informational, entertainment or educational purposes only and should not be construed as personal investment advice. While the information provided is believed to be accurate, it may include errors or inaccuracies.
I will not and cannot be held liable for any actions you take as a result of anything you read here.
Conduct your own due diligence, or consult a licensed financial advisor or broker before making any and all investment decisions. Any investments, trades, speculations, or decisions made on the basis of any information found on this channel, expressed or implied herein, are committed at your own risk, financial or otherwise.

US Dollar Index: Was Friday the Start of a Pullback Or Reversal?Welcome back to the Weekly Forex Forecast for the week of Aug 4 - 8th.
In this video, we will analyze the following FX market:
USD Index
The DXY had a strong week, but turned bearish Friday on weak jobs numbers. Was this just a retracement from the impulsive move up? Will price now find support for another bullish leg?
It all comes down to the +FVG, whether it holds or folds.
Look for price to continue down to discount prices early in the week... and then find it's footing on support.
Enjoy!
May profits be upon you.
Leave any questions or comments in the comment section.
I appreciate any feedback from my viewers!
Disclaimer:
I do not provide personal investment advice and I am not a qualified licensed investment advisor.
All information found here, including any ideas, opinions, views, predictions, forecasts, commentaries, suggestions, expressed or implied herein, are for informational, entertainment or educational purposes only and should not be construed as personal investment advice. While the information provided is believed to be accurate, it may include errors or inaccuracies.
I will not and cannot be held liable for any actions you take as a result of anything you read here.
Conduct your own due diligence, or consult a licensed financial advisor or broker before making any and all investment decisions. Any investments, trades, speculations, or decisions made on the basis of any information found on this channel, expressed or implied herein, are committed at your own risk, financial or otherwise.

DXY Eyes Breakout – Dollar Strength Gaining GroundThe U.S. Dollar Index (DXY) is testing its 50-day moving average on the daily chart, with bulls eyeing a potential breakout. A move above 98.75 could confirm a short-term trend reversal and open the path for further gains.
Stronger-than-expected U.S. economic data continues to support the greenback. Recent inflation prints, job market resilience, and solid retail spending have pushed back expectations for imminent Fed rate cuts. This shift in rate outlook provides fundamental support for the dollar.
In addition, strong U.S. corporate earnings are bolstering equity markets, attracting capital flows into U.S. assets and indirectly supporting dollar demand. Rising Treasury yields, especially on the short end, also offer more attractive returns for dollar-based investments.
Geopolitical uncertainties and trade tensions in Asia and Europe are prompting a rotation into the dollar as a safe-haven currency.
Meanwhile, some emerging market currencies are under pressure, increasing global demand for dollar liquidity.
Technically, a close above 98.75 could confirm bullish momentum, with 99.80 as the next upside target. As long as macro and risk dynamics lean in the dollar’s favor, DXY may continue its rebound from recent lows.
USD Is Still Bullish! Wait For Buys!Welcome back to the Weekly Forex Forecast for the week of July 21-25th.
In this video, we will analyze the following FX market:
USD
The DXY has run bullish last week, up into an area of Supply, where the momentum hesitates now. Next week may pull back a bit... before continuing higher to the buy side liquidity.
Look out for the short term pullback to the W +FVG for a high probability move higher!
Enjoy!
May profits be upon you.
Leave any questions or comments in the comment section.
I appreciate any feedback from my viewers!
Like and/or subscribe if you want more accurate analysis.
Thank you so much!
Disclaimer:
I do not provide personal investment advice and I am not a qualified licensed investment advisor.
All information found here, including any ideas, opinions, views, predictions, forecasts, commentaries, suggestions, expressed or implied herein, are for informational, entertainment or educational purposes only and should not be construed as personal investment advice. While the information provided is believed to be accurate, it may include errors or inaccuracies.
I will not and cannot be held liable for any actions you take as a result of anything you read here.
Conduct your own due diligence, or consult a licensed financial advisor or broker before making any and all investment decisions. Any investments, trades, speculations, or decisions made on the basis of any information found on this channel, expressed or implied herein, are committed at your own risk, financial or otherwise.

DXY - USD Index: either 86 or 112If the current pullback can break above the Centerline, then massive upside is on the plate.
But if it gets rejected, massiv downside is possible.
We don't know yet.
Just let the market tell you.

DXY Weekly Update — July 14, 2025⌛ Timeframe:
.
📆 Analysis Date: July 14, 2025
.
🎯 Weekly Bias: Bearish-to-Neutral (Potential for retracement or reversal)
🔎 Market Overview:
⬇️ Persistent USD Weakness:
DXY has dropped nearly 10% YTD, marking the steepest half-year decline since 1986.
📉 Rate Cut Expectations:
Markets are pricing in a potential 75bps rate cut by the Fed in H2 2025, pushing yields and the dollar lower.
📦 Trade War Fears:
Renewed tariff risks (targeting EU, Japan, Mexico, South Korea) aren't boosting demand for USD — a signal of lost safe-haven appeal.
⚖️ Central Bank Diversification:
Global reserve managers are rotating into gold and away from USD, weakening long-term structural demand.
🌀 Sentiment & Risk Appetite:
💸 Liquidity Demand is Soft:
DXY is retesting a 4H fair value gap (97.10–97.30), suggesting potential short-term consolidation or correction.
🌍 Risk-On Mood Returns:
According to Goldman Sachs, the USD is trading more like a "risk asset" than a haven, aligning with rising equity appetite.
📉 Technical Landscape:
🟠 4H Structure:
If DXY breaks below 97.00, next support lies at 96.37, followed by 95.50–96.00.
Consolidation expected if price remains within the FVG.
🔻 Key Resistance:
97.70–98.20 zone. A break above this area could change the tone to bullish.
📌 Summary:
🔷 Fundamentals show long-term dollar weakening (rates, trade tension, reserve shifts)
🔷 Sentiment aligns with risk-on appetite and reduced USD demand
🔷 Technicals at critical level; break below 97.00 opens room for correction, break above 97.70 shifts bias bullish
.
.
.
.
🟠 Bias: Bearish to Neutral
Watch Levels: 97.00 support, 97.70–98.20 resistance
⚠️ Note: This analysis is for educational purposes only and is not financial advice. Always apply risk management.
✅ If you like this analysis, don't forget to like 👍, follow 🧠, and share your thoughts below 💬!

Tariff Wars Pushing USD HigherThis is the Weekly FOREX Forecast for the week of July 14 - 18th.
In this video, we will analyze the following FX market: USD Index
The latest headlines tell the story. The tariffs are triggering a slow run to the USD safe haven, but the inflows from investors are moving the needle. The previous week closed strong, with buyers in control. There's a good chance we'll see more of the same this coming week.
Look for the strength in USD to continue to be supported by fundamental news, and outperform the other major currencies.
Buy USDxxx
Sell xxxUSD
Enjoy!
May profits be upon you.
Leave any questions or comments in the comment section.
I appreciate any feedback from my viewers!
Like and/or subscribe if you want more accurate analysis.
Thank you so much!
Disclaimer:
I do not provide personal investment advice and I am not a qualified licensed investment advisor.
All information found here, including any ideas, opinions, views, predictions, forecasts, commentaries, suggestions, expressed or implied herein, are for informational, entertainment or educational purposes only and should not be construed as personal investment advice. While the information provided is believed to be accurate, it may include errors or inaccuracies.
I will not and cannot be held liable for any actions you take as a result of anything you read here.
Conduct your own due diligence, or consult a licensed financial advisor or broker before making any and all investment decisions. Any investments, trades, speculations, or decisions made on the basis of any information found on this channel, expressed or implied herein, are committed at your own risk, financial or otherwise.

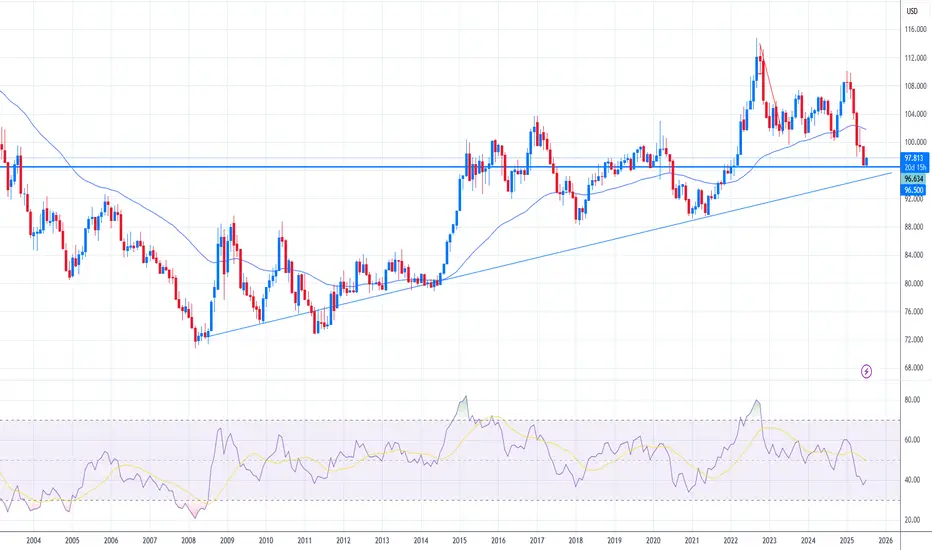
DXY Tests Key Support – What’s Next for the Dollar?
The U.S. Dollar Index (DXY), which tracks the dollar’s performance against a basket of major currencies, recently broke below its 50-month moving average based on the monthly chart —a significant technical signal. After this drop, the index is now bouncing off a key support zone near 96.50.
This area has acted as a pivot point in past cycles, and a sustained bounce could indicate the dollar regaining strength. If risk sentiment fades—due to weaker equity markets, geopolitical tensions, or stronger U.S. data—the dollar might find new momentum.
On the flip side, failure to hold 96.50 could open the door toward the 90.00 zone, a major long-term support level. Such a move would likely reflect expectations of looser U.S. monetary policy or further deterioration in economic confidence.
For now, price action near 96.50 will be decisive. A rebound could shift sentiment back in favor of the dollar, while a deeper decline may trigger broader adjustments in FX markets. Traders should closely monitor upcoming macro data and risk sentiment for cues on the next leg.