USDJPY The Target Is UP! BUY!
My dear subscribers,
My technical analysis for USDJPY is below:
The price is coiling around a solid key level - 152.81
Bias - Bullish
Technical Indicators: Pivot Points High anticipates a potential price reversal.
Super trend shows a clear buy, giving a perfect indicators' convergence.
Goal - 153.09
My Stop Loss - 152.66
About Used Indicators:
By the very nature of the supertrend indicator, it offers firm support and resistance levels for traders to enter and exit trades. Additionally, it also provides signals for setting stop losses
Disclosure: I am part of Trade Nation's Influencer program and receive a monthly fee for using their TradingView charts in my analysis.
———————————
WISH YOU ALL LUCK
USDJPY
USD/JPY | Where to next? USDJPY continued last week's trend of dropping further in price until NFP came out on Wednesday, after a surge in price, it dropped again and then started to consolidate between the IFVG and the demand zone.
Currently USDJPY is being traded at 152.82, if it bounces back up from the Demand Zone, it can go a bit higher and retest the IFVG. If it goes through the IFVG, it can go all the way up to 154.65, however, if it fails to stabilize above 153.60, abort mission.
Targets: 153.00, 153.50, 154.00, 154.30 and 154.65.
USDJPY Ready to drop?Hello traders, this is a complete multiple timeframe analysis of this pair. We see could find significant trading opportunities as per analysis upon price action confirmation we may take this trade. Smash the like button if you find value in this analysis and drop a comment if you have any questions or let me know which pair to cover in my next analysis.
NZD/USD | CPI aftermath! (READ THE CAPTION)As you can see in the 30m chart of NZDUSD, last night it had a dramatic fall in price just like the other Forex pairs, and then it continued to drop further and further to 0.6014. With the CPI news coming out, it went up to 0.6043 and then it dropped and went back up several times.
Now, it is being traded at 0.6037, just above the Feb 13th NDOG. If it stabilizes above 0.6040, I expect it to go higher. But if it fails to stabilize there, I expect another drop for AUDUSD.
If it stabilizes above 0.6040: 0.6048, 0.6056 and 0.6064.
If it fails: 0.6030, 0.6022 and 0.6014.
USDJPY: Bullish Push to 157.55?FX:USDJPY is eyeing a bullish reversal on the 4-hour chart , with price rebounding from support after forming lower highs in a downward trendline, converging with a potential entry zone that could ignite upside momentum if buyers break resistance amid recent volatility. This setup suggests a recovery opportunity post-downtrend, targeting higher levels with approximately 1:5.5 risk-reward .🔥
Entry between 152.25–152.85 for a long position. Target at 157.55 . Set a stop loss at a close below 152 , yielding a risk-reward ratio of approximately 1:5.5 . Monitor for confirmation via a bullish candle close above entry with rising volume, leveraging the pair's potential rebound near support.🌟
Fundamentally , USDJPY is trading around 152.8 in mid-February 2026, with key events next week potentially driving volatility. For the US Dollar, Monday February 16 at 08:25 AM ET features Fed Bowman Speech , which could strengthen USD if hawkish on rates. Tuesday February 17 at 08:15 AM ET brings ADP Employment Change Weekly, where strong hiring data may bolster USD amid labor resilience. For the Japanese Yen, Monday February 16 at 10:35 PM JST includes the 5-Year JGB Auction, with higher yields potentially weakening JPY if demand softens. Wednesday February 18 at 06:50 AM JST features Trade Balance (Jan), where a widening deficit could pressure JPY further. 💡
📝 Trade Setup
🎯 Entry (Long):
152.25 – 152.85
(Entry from current price is valid with proper risk & position sizing.)
🎯 Target:
• 157.55
❌ Stop Loss:
• Close below 152.00
⚖️ Risk-to-Reward:
• ~ 1:5.5
💡 Your view?
Is this the beginning of a broader USDJPY recovery toward 157.55, or will resistance cap the bounce and extend consolidation? 👇
USD/JPY: Takaichi wipeout marks bottom ahead of US CPI?USD/JPY is trading near a double-bottom support ahead of today's US CPI release. Despite a "hot" Non-Farm Payrolls report boosting the dollar elsewhere, this pair has erased all gains from the Japanese snap election rally, driven back down to 152.00 despite Prime Minister Sanae Takaichi’s landslide victory amid renewed intervention fears.
We are watching a potential consolidation bounce from 152.00, or a breakdown if US inflation data disappoints.
Key topics covered
Takaichi wipeout : How the PM's decisive win reignited intervention fears, forcing the market to fully erase the pre-election rally. This reset to 152.00 offers a potential technical consolidation opportunity.
Fed vs. sentiment : While Fed Governor Stephen Miran warns policy is too restrictive, a hot CPI today would reinforce Wednesday's NFP data, validating the exceptionalism narrative and potentially pushing rate cuts further down the road.
Risk drivers : Why AI disruption fears and Trump's tariff rollbacks dampened risk sentiment yesterday, adding complexity to the USD/JPY outlook.
USD/JPY scenarios :
Bullish : A hot CPI validates the 152.00 support. We watch for a breakout above 153.80, targeting resistance at 154.35 and 155.60 (61.8% Fib), with a medium-term target of 157.66. A long position here offers a potential 1.7x risk-reward ratio.
Bearish : A cool CPI could break the 152.00 floor. This opens the door to 150.29 and potentially 151.87 as the next downside targets based on Fibonacci extensions.
Trade plan : Volatility will be high. We are looking at pending orders around 153.80 for the upside breakout or 153.00 for the breakdown, while being mindful of potential whipsaws.
Are you speculating on the 152.00 support holding? Share your views in the comments.
This content is not directed to residents of the EU or UK. Any opinions, news, research, analyses, prices or other information contained on this website is provided as general market commentary and does not constitute investment advice.
ThinkMarkets will not accept liability for any loss or damage including, without limitation, to any loss of profit which may arise directly or indirectly from use of or reliance on such information.
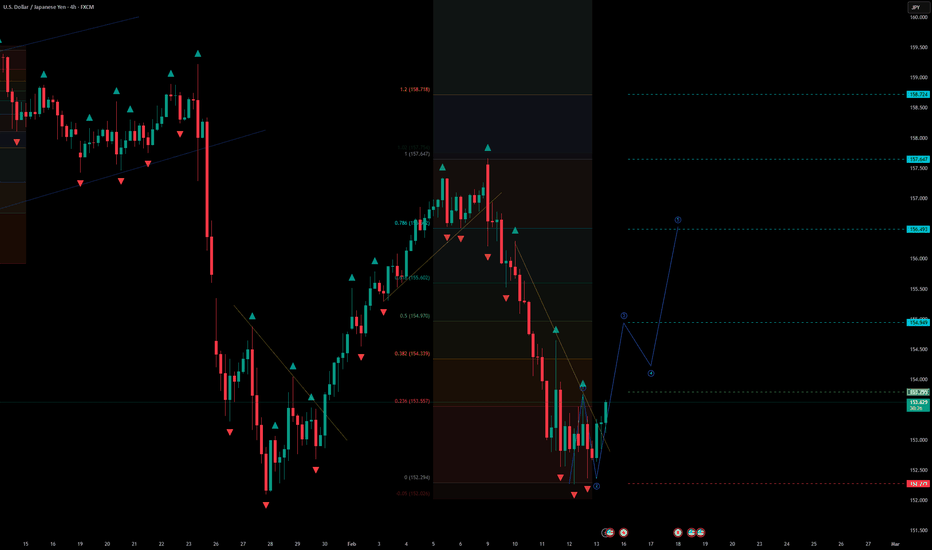
U.S. Dollar / Japanese Yen (USDJPY) — H4 Formation of Wave 3U.S. Dollar / Japanese Yen (USDJPY) — H4 Formation of Wave 3 + Trendline Break (Bullish Continuation)
🔎 Market Structure (H4)
On the H4 timeframe, USDJPY has formed the technical conditions for the development of Wave 3 to the upside, confirmed by:
• breakout of the corrective trendline (structure shift)
• completion of the pullback phase (Wave 2) after the sell-off
• strong rebound from the local support zone with acceleration
• first impulsive push that typically appears at the start of Wave 3
The current structure fits a classic Elliott Wave impulse scenario, where Wave 3 begins after Wave 2 completes and price exits the corrective channel.
📐 Elliott Wave Context
• Wave 1: initial impulsive move down / trend displacement leg
• Wave 2: corrective retracement into the structure (completed)
• Wave 3: projected impulsive expansion upward (current scenario)
📌 Key principle:
The bullish scenario remains valid as long as price holds above the low of Wave 2.
📍 Entry
Entry: 153.795
The entry is positioned:
• above the broken trendline
• within the impulse activation zone
• after the first rebound confirming buyers’ control
🎯 Target Levels (Wave 3 Projections)
Targets are projected using impulse expansion zones and key reaction levels:
TP1: 154.949
TP2: 156.493
TP3: 157.647
TP4: 158.724
Each target is a potential reaction zone and a logical level for partial profit-taking during Wave 3 development.
🛑 Invalidation / Stop Loss
Stop Loss: 152.279
📍 The stop is placed below the low of Wave 2, which:
• invalidates the Wave 3 bullish scenario if broken
• protects against continuation of the bearish leg / deeper correction
• aligns with Elliott Wave risk logic (Wave 2 low must hold)
🧠 Risk & Trade Management
Trend-following setup
Wave 3 can be fast and volatile once acceleration starts.
Recommended approach:
• partial profits at TP1 / TP2
• move stop to breakeven after confirmation (impulsive continuation + holding above breakout zone)
• avoid increasing risk before a clean Wave 3 structure is visible
• scaling is preferable only on pullbacks that respect the broken trendline as support
📌 Summary
USDJPY on H4 shows a corrective trendline breakout and signs of Wave 3 activation upward.
The bullish scenario remains valid above 152.279, with upside targets aligned to projected impulse expansion levels.
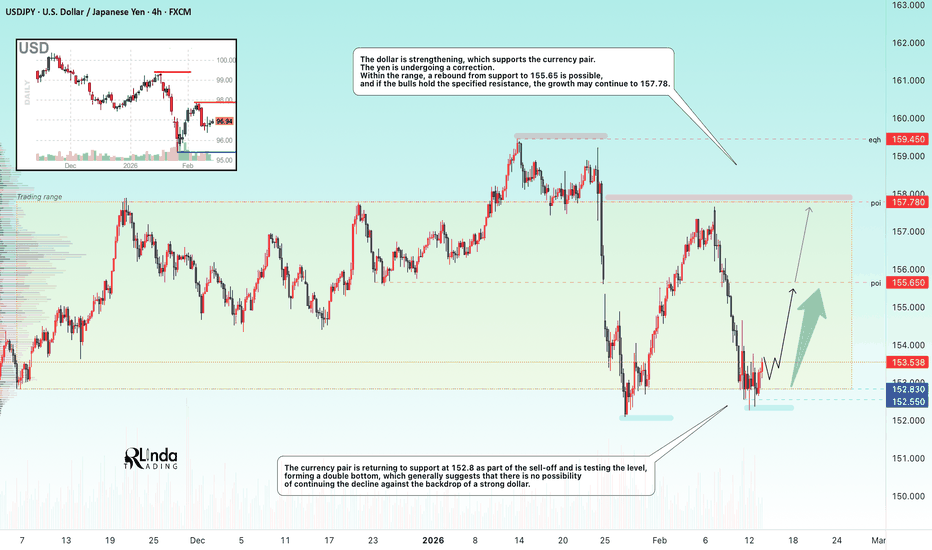
USDJPY - Reversal setup relative to range support FX:USDJPY faces strong support within the correction. The price closed within the trading range of 152.8 - 157.78 and is forming a strong reversal setup relative to the lower boundary.
The dollar is strengthening, which supports the currency pair. The yen is undergoing a correction. Within the range, a rebound from support to 155.65 is possible, and if the bulls hold the specified resistance, the growth may continue to 157.78.
The currency pair is returning to support at 152.8 as part of the sell-off and is testing the level, forming a double bottom, which generally suggests that there is no possibility of continuing the decline against the backdrop of a strong dollar.
Resistance levels: 155.65, 157.78, 159.45
Support levels: 152.83
The false breakout of support indicates that the bulls are trying to maintain their positions and are not letting the price fall, which also confirms the formation of a double bottom. If the bulls keep the price above 153.0, this move could support the price growth.
Best regards, R. Linda!
EURUSD: 1.19 breakout setup toward 1.2050🛠 Technical Analysis: On the H4 chart, EURUSD is consolidating right under the 1.1933 resistance after a strong rebound from the mid-1.16/1.17 support base. The structure still favors buyers as price continues to print higher lows and holds above the key 1.1800 support zone. Both the “local” and “global” bullish signals remain valid, while the 50/100/200 SMAs are acting as dynamic support beneath price. A confirmed close above 1.1933 would signal a clean breakout and open the way toward 1.1979 first, with an extended continuation objective toward the 1.2050 resistance area. If the breakout fails and price gets rejected from 1.19–1.1933, a pullback back into the 1.1800 zone is likely, with the next demand area near 1.1730. Volatility may increase around key US data releases, so confirmation is critical before committing.
———————————————
❗️ Trade Parameters (BUY)
———————————————
➡️ Entry Point: 1.19327 (buy on confirmation above resistance)
🎯 Take Profit: 1.19795 (extended target: 1.2050)
🔴 Stop Loss: 1.18858
⚠️ Disclaimer: This is a potential trade idea based on current analysis; market conditions and price direction are subject to change based on news factors and volatility.
XAUUSD: NFP spike trap and bearish reversal setup🛠 Technical Analysis: On the H4 timeframe, Gold is rebounding strongly and is now pressing into the key resistance area around 5,100–5,120. The chart highlights a local bearish signal, suggesting that despite short-term strength, buyers may be vulnerable to a “trap” if the breakout turns into a false move. Price is still below the major upper resistance zone near 5,600. The SMA 50/100 are rising and sit below price, but momentum is approaching a heavy supply zone where reversals often start. The main trigger for the sell scenario is a false breakout above resistance followed by a breakdown back below the 5,030 level. If that confirmation occurs, the next downside leg is projected toward the marked support near 4,598. A sustained hold above the resistance zone would weaken the bearish idea and delay the correction.
———————————————
❗️ Trade Parameters (SELL)
———————————————
➡️ Entry Point: 5,030.82
🎯 Take Profit: 4,598.02
🔴 Stop Loss: 5,318.65
⚠️ Disclaimer: This is a potential trade idea based on current analysis; market conditions and price direction are subject to change based on news factors and volatility.
XAGUSD: downside opportunuties🛠 Technical Analysis: On the H4 chart, Silver (XAGUSD) is consolidating after a sharp selloff from the recent peak. Price is currently capped by a descending trendline and a key resistance zone overhead, while the lower boundary of the formation is acting as short-term support. The Moving Averages show mixed conditions: price is holding above the fast MA, but remains below the higher-period averages, keeping the broader bias pressured. This compression typically precedes expansion, and a rejection/false breakout from the upper wedge line would reinforce the bearish continuation scenario. A confirmed breakdown from the pattern opens room for a move into the next major support area around 69–71. If momentum accelerates, the lower support band becomes the next downside objective near 64.
———————————————
❗️Trade Parameters (SELL)
———————————————
➡️ Entry Point: Approx. 81.00
🎯 Take Profit: 69.43
🔴 Stop Loss: 90.14
⚠️ Disclaimer: This is a potential trade idea based on current analysis; market conditions and price direction are subject to change based on news factors and volatility.
Stop!Loss|Market View: BTCUSD🙌 Stop!Loss team welcomes you❗️
In this post, we're going to talk about the near-term outlook for the BTCUSD☝️
Potential trade setup:
🔔Entry level: 72115.95
💰TP: 79200.75
⛔️SL: 66949.95
"Market View" - a brief analysis of trading instruments, covering the most important aspects of the FOREX market.
👇 In the comments 👇 you can type the trading instrument you'd like to analyze, and we'll talk about it in our next posts.
💬 Description: Bitcoin is unlikely to be attractive for a short-term trade today, but a more likely buy scenario could realize in the near future. This would require waiting for the price to return to the 67,000-71,500 range, and then wait for a breakout of the upper limit. The upside target in this case is considered to be near 80,000.
Thanks for your support 🚀
Profits for all ✅
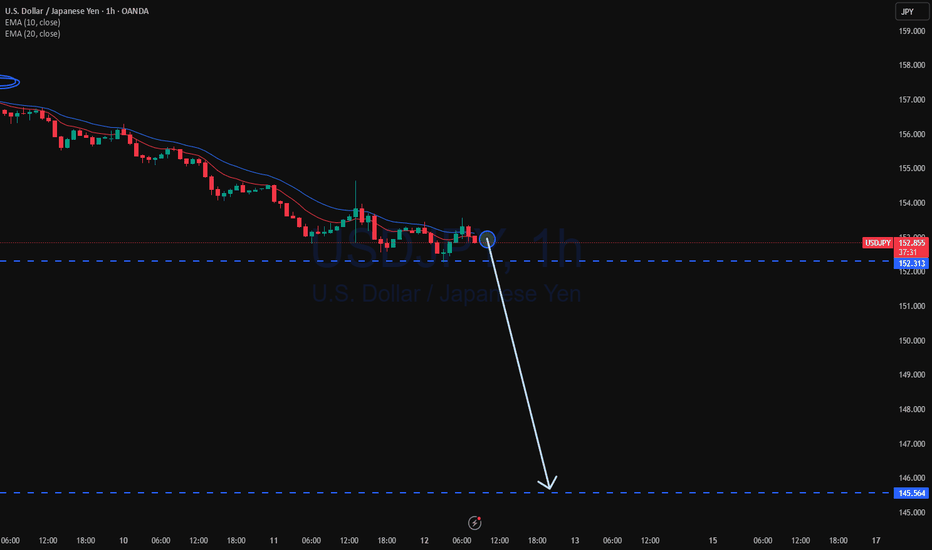
Fundamental Market Analysis for February 13, 2026 USDJPYOn Friday, February 13, USD/JPY is fluctuating near 153.100, as Japan’s yen strengthened amid a reassessment of political risks and a reduction in bets against the local currency. After the election, investors view fiscal policy as more predictable, and rising interest in Japanese assets is supporting demand for the yen.
From the U.S. side, the key trigger for the day remains inflation data. If price growth comes in above forecasts, expectations of a longer period of higher rates could restore support for the dollar and temporarily limit the yen’s strengthening. However, a softer inflation picture would strengthen expectations for a rate cut closer to mid-year and increase the likelihood that the pair continues to decline, so the market is pricing in elevated volatility.
Signals from Japanese officials also matter: authorities are closely monitoring sharp exchange-rate swings, and any verbal response can quickly shift sentiment. Combined with higher demand for defensive instruments in global markets, this creates a foundation for a stronger yen, while attempts by the dollar to recover will depend on whether U.S. data confirm persistent inflation.
Trading recommendation: SELL 153.100, SL 153.250, TP 152.050
USD/JPY ANALYSIS - 12.02.2026━━━━━━━━━━━━━━━━━━━━━━━━━━━━━━━━━━━━━━━━━━━━━━━━━
📊 USD/JPY ANALYSIS - 12.02.2026
━━━━━━━━━━━━━━━━━━━━━━━━━━━━━━━━━━━━━━━━━━━━━━━━━
📅 WEEKLY TIMEFRAME
──────────────────────────────────────────────────
There is no surprise or tought about UJ, long term it is bullish and fundamentally we are going to keep it bullish until policies will change. Altough the fact that long term is bullish, on the most imediate price action we can note some things such as: price made a huge liquidation of a swing high, entered supply zone and imediatelly bears took the price down, validating also a bearish orderflow. Currentlly as we are speaking, we saw after the selloff a imediate bullish reaction because of the demand zone that seems to hold price steady.
Right now, we are in a battle of supply vs demand on the weekly chart on USDJPY with the most current trend beeing bearish pressure.
📸 Chart:
📊 DAILY TIMEFRAME
──────────────────────────────────────────────────
If we move on to the daily chart, we can see better and in detail how price reacted to the main zones, especially that we can see daily demand and supply zones inside our main weekly zones.
Agreeable, we made a weekly liquidation but on daily we can see also some major sellside liquidations and right now price is testing again a powerfull demand zone on daily (wich is inside the weekly demand zone). Why powerfull? because we have a liquidation inside it and imediate reaction.
In my point of view, last selloff was because of the bearish ordeflow that is keept intact but if we do not count the weekly liquidation, on daily nothing much happend from the bulls yet. No progression, no manipulation. Bulls just kept their power and just let bears push it lower just to gain some strength in the future to make another push to upside.
In case of this demand to break, we are still inside the weekly demand zone and also because of the price beeing bullish on long term, i would still look for a upside recovery in near future.
📸 Chart:
⏱️ 4H TIMEFRAME
──────────────────────────────────────────────────
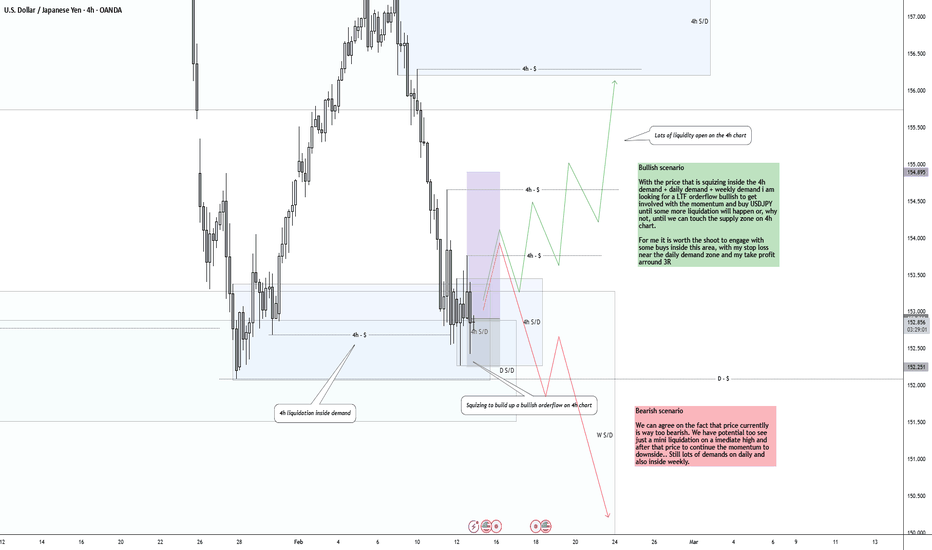
On the 4h chart we can presume 2 scenarios. One bullish and one bearish.
Bullish scenario
With the price that is squizing inside the 4h demand + daily demand + weekly demand i am looking for a LTF orderflow bullish to get involved with the momentum and buy USDJPY until some more liquidation will happen or, why not, until we can touch the supply zone on 4h chart.
For me it is worth the shoot to engage with some buys inside this area, with my stop loss near the daily demand zone and my take profit arround 3R.
Bearish scenario
We can agree on the fact that price currentlly is way too bearish. We have potential too see just a mini liquidation on a imediate high and after that price to continue the momentum to downside.. Still lots of demands on daily and also inside weekly.
📸 Chart:
⚡ 1H TIMEFRAME
──────────────────────────────────────────────────
To be really transparent, this would be my trade proposed for upcoming period on UJ.
As we can see, 1h is even more clear, we had a liquidation + a change of character. Right now i assume that we have another retracement to test again the demand, also another liquidation and i want to see price reacting to upside and connecting with the 1h zone.
If not..it is what it is.
📸 Chart:
━━━━━━━━━━━━━━━━━━━━━━━━━━━━━━━━━━━━━━━━━━━━━━━━━
CAD/JPY | NWOG Retest (READ THE CAPTION)As you can see in the 4H chart of CADJPY, ever since the Monday Open, it has been dropping in price from 115.32 all the way to 112.24, over 300 pips! but it has bounced back up today after hitting the Demand zone, and it's being traded at 113.07 right now. It has hit both the IFVG high and NWOG Low right now, so a small correction might happen, however even if it happens, I expect CADJPY to retest the NWOG zone again.
Targets for CADJPY: 113.15, 113.25, 113.35, 113.45 and 113.55.
If it fails at retesting: 113.00, 112.90, 112.80, 112.70 and 112.60.
USD/JPY - High-Stakes Demand Zone Defends the TrendHello Trading Fam! 👋
This USD/JPY daily chart highlights a long-term bullish setup:
Ascending Channel: The pair is trading within a broad upward-sloping channel, indicating an overall bullish trend.
Demand Zone: Price has retraced to a horizontal demand zone (pink box) around the 152.00–153.00 level.
Confluence: This demand zone aligns with the lower trendline of the channel, creating a high-probability area for buyers.
Trade Bias: The analysis suggests looking for long positions (buys) as the price attempts to bounce from this structural support.
Don’t forget to like and share your thoughts in the comments! ❤️
USDJPY 4H Bearish Breakdown – Trendline Rejection Targets 151.50Price broke below the ascending trendline.
Strong rejection from the 154.00 supply / support-turned-resistance zone.
Lower highs forming → short-term bearish structure confirmed.
Price currently consolidating around 152.90 – 153.10.
🔻 Bearish Scenario (Primary Bias)
As long as price remains below 154.00 – 154.30, downside pressure remains dominant.
Targets:
🎯 152.25 (minor intraday support)
🎯 151.50 – 151.70 (major support zone)
A continuation toward the lower boundary of the larger channel is likely if sellers maintain momentum.
🔴 Invalidation Level:
A strong 4H close above 154.30 would weaken the bearish bias.
Break and hold above that level may trigger a short squeeze toward 155.00 – 155.50.
📌 Conclusion:
The market has shifted from bullish recovery into a corrective bearish phase after trendline breakdown and supply rejection. Sellers are in control below 154.00, targeting deeper liquidity levels near 152.25 and possibly 151.50.
USDJPY and DXY Analysis todayHello traders, this is a complete multiple timeframe analysis of this pair. We see could find significant trading opportunities as per analysis upon price action confirmation we may take this trade. Smash the like button if you find value in this analysis and drop a comment if you have any questions or let me know which pair to cover in my next analysis.
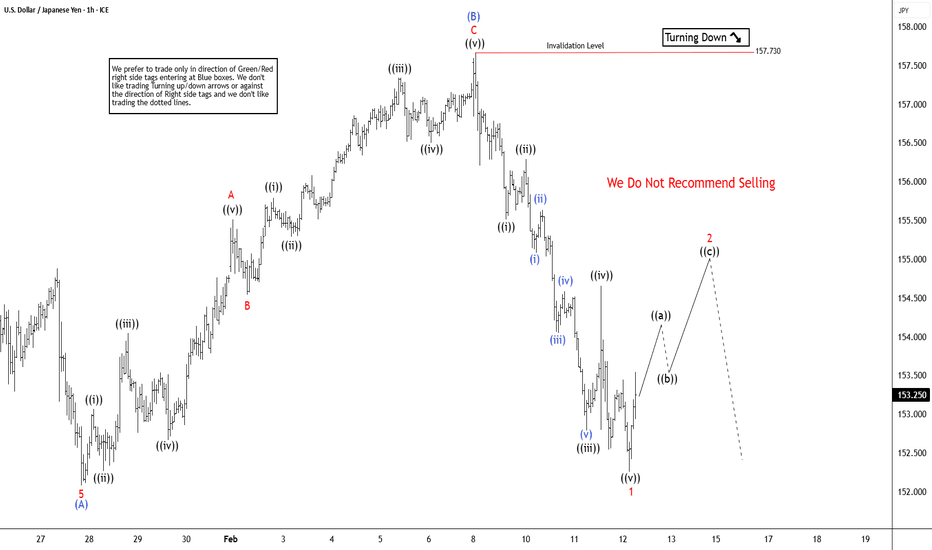
Elliott Wave Analysis on USDJPY Signals Broader PullbackFX:USDJPY has concluded the cycle from the April 22, 2025 low and is now entering a corrective phase of larger magnitude. From the January 14, 2026 peak, the pair has begun to retrace with internal subdivision unfolding as a zigzag Elliott Wave structure. The initial decline from the January 14 high saw wave (A) finish at 152.08, as shown on the one‑hour chart. Following this, the pair advanced in wave (B), which itself developed as a zigzag of lesser degree. Within this move, wave A ended at 155.51, wave B pulled back to 154.53, and wave C extended higher to 157.7. This completed wave (B) in the larger sequence.
From that point, the pair turned lower in wave (C), which is unfolding as a five‑wave impulse. The initial leg, wave ((i)), ended at 155.51. The corrective rally in wave ((ii)) reached 156.29. Subsequent decline in wave ((iii)) terminated at 152.79. A modest recovery in wave ((iv)) followed, ending at 154.65. The structure suggests that wave ((v)) of 1 remains in progress, with further downside expected before completion. Once wave 1 concludes, a corrective rally in wave 2 should emerge, correcting the cycle from the February 9 high before the broader decline resumes.
In the near term, as long as the pivot at 157.7 remains intact, rallies are expected to fail within the framework of 3, 7, or 11 swings. This reinforces the bearish outlook and highlights the importance of respecting the structural integrity of the Elliott Wave count. The pair continues to navigate its corrective path with measured precision, offering traders a clear framework for anticipating near‑term moves.
Stop!Loss|Market View: AUDUSD🙌 Stop!Loss team welcomes you❗️
In this post, we're going to talk about the near-term outlook for the AUDUSD currency pair☝️
Potential trade setup:
🔔Entry level: 0.70784
💰TP: 0.69414
⛔️SL: 0.71865
"Market View" - a brief analysis of trading instruments, covering the most important aspects of the FOREX market.
👇 In the comments 👇 you can type the trading instrument you'd like to analyze, and we'll talk about it in our next posts.
💬 Description: Buying momentum on AUDUSD and NZDUSD is surprising compared to other major pairs, and further gains are possible this week. Specifically, for AUDUSD, this represents a potential rise to 0.72, but the medium-term selling pressure remains strong. A likely reversal signal would be a price close below resistance at 0.71000. A false breakout in this case would pull the price toward support at 0.69000, with a more ambitious target near 0.67000 also a viable option.
Thanks for your support 🚀
Profits for all ✅
USDJPY 30Min Engaged ( Bearish & Bullish Entry Detected )⚡Base : Hanzo Trading Alpha Algorithm
The algorithm calculates volatility displacement vs liquidity recovery, identifying where probability meets imbalance.
It trades only where precision, volume, and manipulation intersect —only logic.
✈️ Technical Reasons
/ Direction — LONG / Reversal 153.110 Area
☄️Bullish momentum confirmed through strong candle body.
☄️Structure shifted with higher-low near key demand base.
☄️Volume expanding confirms order-flow alignment upward.
☄️Buyers reclaimed imbalance with sustained clean break.
☄️Algorithm detects rising momentum under low liquidity.
✈️ Technical Reasons
/ Direction — SHORT / Reversal 156.200 Area
☄️Bearish rejection confirmed through sharp candle body.
☄️Lower-high forming beneath resistance supply region.
☄️Volume decreasing confirms exhaustion in price rally.
☄️Sellers regained imbalance with heavy top rejection.
☄️Algorithm detects fading demand and shift to control.
⚙️ Hanzo Alpha Trading Protocol
The Alpha Candle defines the day’s real control zone — the first battle of momentum.
From this origin, the Volume Window reveals where the next precision strike begins.
⚙️ Hanzo Volume Window / Map
Window tracked from 10:30 — mapping true market behavior.
POC alignment exposes institutional bias and breakout potential zones.
⚙️ Hanzo Delta Window / Pulse
Delta window monitors real buying vs. selling power behind each move.
Tracks volume aggression to expose who controls the candle — buyers or sellers.
When Delta aligns with Volume Map, momentum becomes undeniable.


