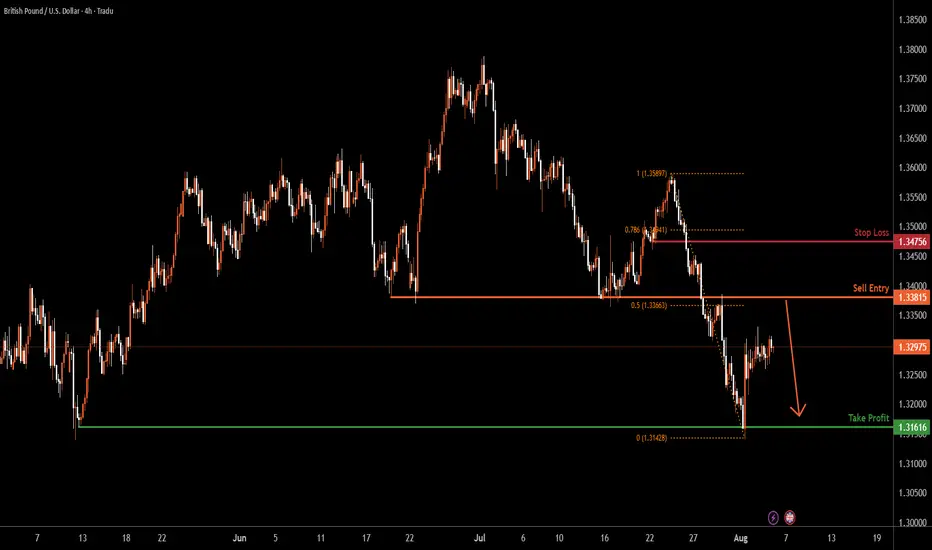
GBPUSD H4 | Bearish reversal off pullback resistanceThe Cable (GBP/USD) is rising towards the sell entry at 1.3381, which acts as a pullback resistance and could drop to the downside.
Stop loss is at 1.3475, which is a pullback resistance that is slightly below the 78.6% Fibonacci retracement.
Take profit is at 1.3161, which is a multi-swing low support.
High Risk Investment Warning
Trading Forex/CFDs on margin carries a high level of risk and may not be suitable for all investors. Leverage can work against you.
Stratos Markets Limited (tradu.com ):
CFDs are complex instruments and come with a high risk of losing money rapidly due to leverage. 65% of retail investor accounts lose money when trading CFDs with this provider. You should consider whether you understand how CFDs work and whether you can afford to take the high risk of losing your money.
Stratos Europe Ltd (tradu.com ):
CFDs are complex instruments and come with a high risk of losing money rapidly due to leverage. 66% of retail investor accounts lose money when trading CFDs with this provider. You should consider whether you understand how CFDs work and whether you can afford to take the high risk of losing your money.
Stratos Global LLC (tradu.com ):
Losses can exceed deposits.
Please be advised that the information presented on TradingView is provided to Tradu (‘Company’, ‘we’) by a third-party provider (‘TFA Global Pte Ltd’). Please be reminded that you are solely responsible for the trading decisions on your account. There is a very high degree of risk involved in trading. Any information and/or content is intended entirely for research, educational and informational purposes only and does not constitute investment or consultation advice or investment strategy. The information is not tailored to the investment needs of any specific person and therefore does not involve a consideration of any of the investment objectives, financial situation or needs of any viewer that may receive it. Kindly also note that past performance is not a reliable indicator of future results. Actual results may differ materially from those anticipated in forward-looking or past performance statements. We assume no liability as to the accuracy or completeness of any of the information and/or content provided herein and the Company cannot be held responsible for any omission, mistake nor for any loss or damage including without limitation to any loss of profit which may arise from reliance on any information supplied by TFA Global Pte Ltd.
The speaker(s) is neither an employee, agent nor representative of Tradu and is therefore acting independently. The opinions given are their own, constitute general market commentary, and do not constitute the opinion or advice of Tradu or any form of personal or investment advice. Tradu neither endorses nor guarantees offerings of third-party speakers, nor is Tradu responsible for the content, veracity or opinions of third-party speakers, presenters or participants.
USDJPY
XAU/USD | Bounce in Play – Watching $3350 Support for Next Move!By analyzing the gold chart on the 4-hour timeframe, we can see that after hitting the first target at $3361, gold continued its rally and reached our second supply level at $3385. Upon reaching this key level, the price faced strong selling pressure, dropping over 350 pips down to $3349. Gold is now trading around $3363, and if it can hold above the $3350 support level, we could expect another bullish push. The next upside targets are $3367, $3375, and $3385. This analysis will be updated in the coming hours with your continued support!
Please support me with your likes and comments to motivate me to share more analysis with you and share your opinion about the possible trend of this chart with me !
Best Regards , Arman Shaban

BoJ minutes indicate more rate hikes coming, yen dipsThe Japanese yen is in negative territory on Tuesday. In the European session, USD/JPY is trading at 147.74, up 0.45% on the day.
The Bank of Japan minutes from the June policy meeting were somewhat dovish, but the yen has still headed lower today. The minutes indicated that most BoJ members favored keeping interest rates unchanged, since there were downside risks to Japan's economy due to US tariffs. Still, Governor Ueda and most members support further rate hikes down the road, provided that inflation and growth continue to increase in line with the BoJ projections.
This stance was reiterated at last week's meeting, with the BoJ signalling that it planned further rate hikes if inflation and growth increased. At the meeting, the BoJ revised up its inflation forecasts for this fiscal year to 2.7%, from 2.2% in the April forecast. The central bank also raised its growth forecast by 0.1% from the April forecast.
The June meeting took place prior to the US-Japan trade agreement, which the BoJ said has reduced trade uncertainty. The trade deal should pave the way for another rate hike before the end of the year. The BoJ reacted positively to the agreement, which applies 15% tariffs on most Japanese imports to the US.
The ISM services PMI is expected to accelerate to 51.5 in July, compared to 50.8 in June. The services sector is back in expansion territory after a rare contraction (49.9) in May. Services purchase managers pointed to the uncertainty over tariff impacts as their number one concern.
On Friday, ISM Manufacturing PMI slipped to 48.0 for July, down from 49.5 in June. This marked the fifth consecutive contraction for manufacturing.
EUR/USD Chart Breakdown – Explained Like You're 5!📉 Big money doesn't move randomly – it follows patterns. In this short, I break down a real EUR/USD trade setup like a pro trader would explain it to a curious kid.
✅ Watch how institutional players trap retail traders
✅ Learn the psychology behind accumulation & distribution
✅ Find out why the market may drop toward 1.15030
✅ Explained in the simplest, most relatable way!
If you're tired of complicated chart talk — this one’s for YOU.
📍EUR/USD Forex Setup | Day 9 | Smart Money Concept | Price Action
🔔 Follow for daily breakdowns and market psychology

USDJPY key trading level at 148.90The USDJPY pair is currently trading with a bearish bias, aligned with the broader downward trend. Recent price action shows a retest of the falling resistance, suggesting a temporary relief rally within the downtrend.
Key resistance is located at 148.90, a prior consolidation zone. This level will be critical in determining the next directional move.
A bearish rejection from 148.90 could confirm the resumption of the downtrend, targeting the next support levels at 146.10, followed by 145.40 and 144.60 over a longer timeframe.
Conversely, a decisive breakout and daily close above 148.90 would invalidate the current bearish setup, shifting sentiment to bullish and potentially triggering a move towards 149.75, then 150.20.
Conclusion:
The short-term outlook remains bearish unless the pair breaks and holds above 148.90. Traders should watch for price action signals around this key level to confirm direction. A rejection favours fresh downside continuation, while a breakout signals a potential trend reversal or deeper correction.
This communication is for informational purposes only and should not be viewed as any form of recommendation as to a particular course of action or as investment advice. It is not intended as an offer or solicitation for the purchase or sale of any financial instrument or as an official confirmation of any transaction. Opinions, estimates and assumptions expressed herein are made as of the date of this communication and are subject to change without notice. This communication has been prepared based upon information, including market prices, data and other information, believed to be reliable; however, Trade Nation does not warrant its completeness or accuracy. All market prices and market data contained in or attached to this communication are indicative and subject to change without notice.

ujThe dollar index (DXY00) on Monday added to last Friday’s losses and fell by -0.38%. The dollar moved lower Monday on negative carryover from last Friday’s weaker-than-expected US payroll and ISM manufacturing reports, which sent T-note yields lower and bolstered speculation that the Fed may cut interest rates as soon as next month.

USDJPY Breakout and Potential RetraceHey Traders, in today's trading session we are monitoring USDJPY for a selling opportunity around 148.300 zone, USDJPY was trading in an uptrend and successfully managed to break it out. Currently is in a correction phase in which it is approaching the retrace area at 148.300 support and resistance area.
Trade safe, Joe.

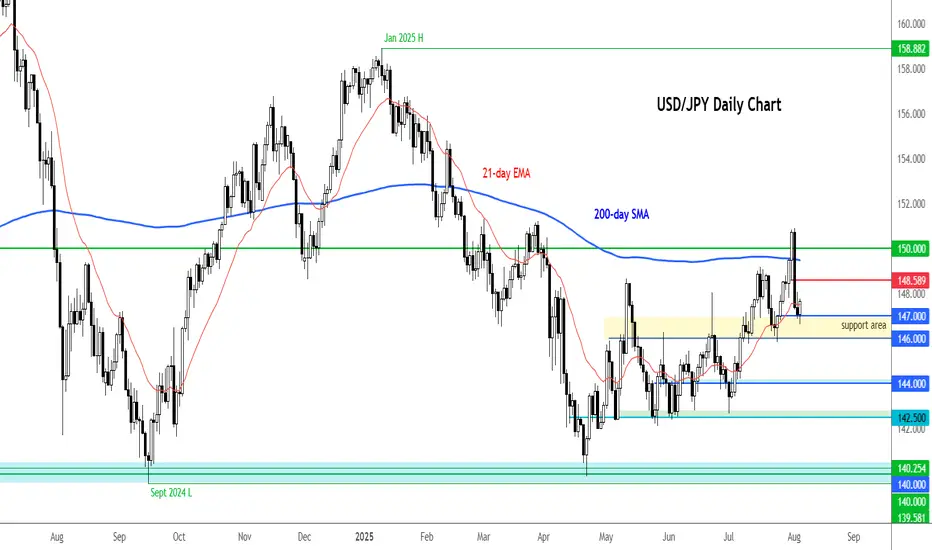
USD/JPY bounced off key support ahead of ISM surveyAfter Friday's weak jobs report and the downward revisions to prior readings, the mood shifted towards the dollar, with markets leaning towards the Fed delivering more than a couple of rate cuts this year. But we have seen a bit of a recovery in the USD since, suggesting investors are either expecting employment to pick up again or inflation to remain sticky amid higher tariffs.
Today’s attention turns to the ISM services report for July, where a modest uptick is expected. Should that materialise, it could give the dollar some further support following Friday’s wobble. We’ll also be hearing from Fed officials Susan Collins and Lisa Cook on Wednesday – and their comments may well shape expectations heading into the autumn.
Ahead of these events, the USD/JPY has bounced off the key support range we highlighted yesterday, between 146.00-147.00 area. A close below this zone would be a bearish outcome, but while it continues to hold we would favour looking for bullish trades than bearish ones. 148.60 then 150.00 are the next key levels to watch on the upside.
By Fawad Razaqzada, market analyst with FOREX.com
USD/JPY) support boost Bullish Trend Read The captionSMC Trading point update
Technical analysis of USD/JPY on the 4-hour timeframe, based on a rejection from a key support zone and signs of trend continuation toward a higher target.
---
Technical Breakdown:
1. Support Level:
Price has bounced from a clearly defined support zone around 146.00 – 146.50, which has held multiple times in the past.
This zone is acting as a strong demand area where buyers are stepping in.
2. Bullish Rejection + Structure:
A bullish candle has formed from the support area, signaling potential reversal.
The drawn projection suggests higher highs and higher lows forming — indicating bullish continuation.
3. EMA (200):
Price has respected the 200 EMA (blue line), bouncing off it — a strong confluence for bullish trend continuation.
EMA is slightly upward sloping, indicating a longer-term bullish bias remains intact.
4. RSI (14):
RSI is rising from oversold territory (42.09), indicating a bullish momentum shift.
A potential bullish divergence might be forming (price made lower low, RSI made higher low).
5. Target Point:
Price is projected to reach 150.904, giving a potential move of ~2.91% (426 pips) from current levels.
---
Trade Idea Summary:
Bias: Bullish
Entry Zone: 146.90 – 147.30 (current levels or slight pullback)
Stop Loss: Below the support zone (~145.90)
Take Profit (TP): 150.900 (key resistance / previous high)
Risk-to-Reward Ratio: Attractive, based on the size of the support zone vs. projected move
Mr SMC Trading point
---
Key Insights:
Strong confluence between price structure, support zone, and 200 EMA bounce.
Favorable risk-reward ratio for swing or intraday traders.
Best confirmation would come from a bullish engulfing candle or break above minor resistance near 147.80.
Please support boost 🚀 this analysis)

USDJPY – DAILY FORECAST Q3 | W32 | D5 | Y25📊 USDJPY – DAILY FORECAST
Q3 | W32 | D5 | Y25
Daily Forecast 🔍📅
Here’s a short diagnosis of the current chart setup 🧠📈
Higher time frame order blocks have been identified — these are our patient points of interest 🎯🧭.
It’s crucial to wait for a confirmed break of structure 🧱✅ before forming a directional bias.
This keeps us disciplined and aligned with what price action is truly telling us.
📈 Risk Management Protocols
🔑 Core principles:
Max 1% risk per trade
Only execute at pre-identified levels
Use alerts, not emotion
Stick to your RR plan — minimum 1:2
🧠 You’re not paid for how many trades you take, you’re paid for how well you manage risk.
🧠 Weekly FRGNT Insight
"Trade what the market gives, not what your ego wants."
Stay mechanical. Stay focused. Let the probabilities work.
FX:USDJPY

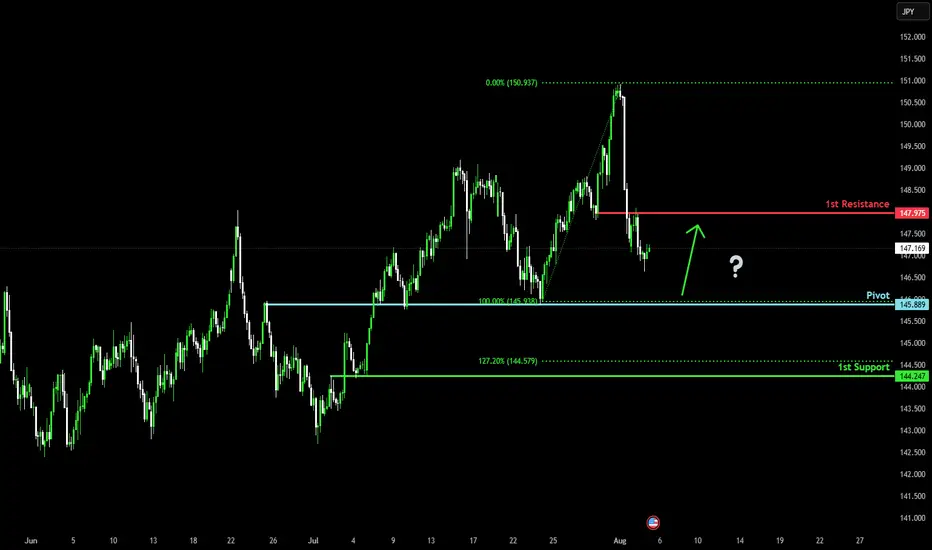
Falling towards major support?USD/JPY is falling towards the pivot, which has been identified as an overlap support and could bounce to the 1st resistance.
Pivot: 145.88
1st Support: 144.24
1st Resistance: 147.97
Risk Warning:
Trading Forex and CFDs carries a high level of risk to your capital and you should only trade with money you can afford to lose. Trading Forex and CFDs may not be suitable for all investors, so please ensure that you fully understand the risks involved and seek independent advice if necessary.
Disclaimer:
The above opinions given constitute general market commentary, and do not constitute the opinion or advice of IC Markets or any form of personal or investment advice.
Any opinions, news, research, analyses, prices, other information, or links to third-party sites contained on this website are provided on an "as-is" basis, are intended only to be informative, is not an advice nor a recommendation, nor research, or a record of our trading prices, or an offer of, or solicitation for a transaction in any financial instrument and thus should not be treated as such. The information provided does not involve any specific investment objectives, financial situation and needs of any specific person who may receive it. Please be aware, that past performance is not a reliable indicator of future performance and/or results. Past Performance or Forward-looking scenarios based upon the reasonable beliefs of the third-party provider are not a guarantee of future performance. Actual results may differ materially from those anticipated in forward-looking or past performance statements. IC Markets makes no representation or warranty and assumes no liability as to the accuracy or completeness of the information provided, nor any loss arising from any investment based on a recommendation, forecast or any information supplied by any third-party.
USDJPY Strong Breakout!
HI,Traders !
#USDJPY made a bearish
Breakout of the rising support
Line and the breakout is
Confirmed so we will be
Expecting a further bearish
Move down !
Comment and subscribe to help us grow !

USD/JPY testing key support after Friday's dropThe USD/JPY fell sharply Friday in reaction to the weak US jobs data. But it is now testing the upside of a massive short-term support area, between 146.00-147.00. Can we see a bounce here towards 148.60 zone initially?
By Fawad Razaqzada, market analyst with FOREX.com
USDJPY My Opinion! BUY!
My dear friends,
My technical analysis for USDJPY is below:
The market is trading on 147.23 pivot level.
Bias - Bullish
Technical Indicators: Both Super Trend & Pivot HL indicate a highly probable Bullish continuation.
Target - 148.77
About Used Indicators:
A pivot point is a technical analysis indicator, or calculations, used to determine the overall trend of the market over different time frames.
Disclosure: I am part of Trade Nation's Influencer program and receive a monthly fee for using their TradingView charts in my analysis.
———————————
WISH YOU ALL LUCK

US dollar gets hit by weird disappointing NFP numbersLast Friday the US delivered not its best NFP reading. US dollar bears jumped into action. Let's dig in!
MARKETSCOM:DOLLARINDEX
TVC:DXY
FX_IDC:EURUSD
FX_IDC:USDJPY
FX_IDC:USDCAD
Let us know what you think in the comments below.
Thank you.
75.2% of retail investor accounts lose money when trading CFDs with this provider. You should consider whether you understand how CFDs work and whether you can afford to take the high risk of losing your money. Past performance is not necessarily indicative of future results. The value of investments may fall as well as rise and the investor may not get back the amount initially invested. This content is not intended for nor applicable to residents of the UK. Cryptocurrency CFDs and spread bets are restricted in the UK for all retail clients.

USDJPY Will Grow! Buy!
Here is our detailed technical review for USDJPY.
Time Frame: 12h
Current Trend: Bullish
Sentiment: Oversold (based on 7-period RSI)
Forecast: Bullish
The market is testing a major horizontal structure 147.215.
Taking into consideration the structure & trend analysis, I believe that the market will reach 150.314 level soon.
P.S
The term oversold refers to a condition where an asset has traded lower in price and has the potential for a price bounce.
Overbought refers to market scenarios where the instrument is traded considerably higher than its fair value. Overvaluation is caused by market sentiments when there is positive news.
Disclosure: I am part of Trade Nation's Influencer program and receive a monthly fee for using their TradingView charts in my analysis.
Like and subscribe and comment my ideas if you enjoy them!


GBPJPY and USDJPY Analysis todayHello traders, this is a complete multiple timeframe analysis of this pair. We see could find significant trading opportunities as per analysis upon price action confirmation we may take this trade. Smash the like button if you find value in this analysis and drop a comment if you have any questions or let me know which pair to cover in my next analysis.

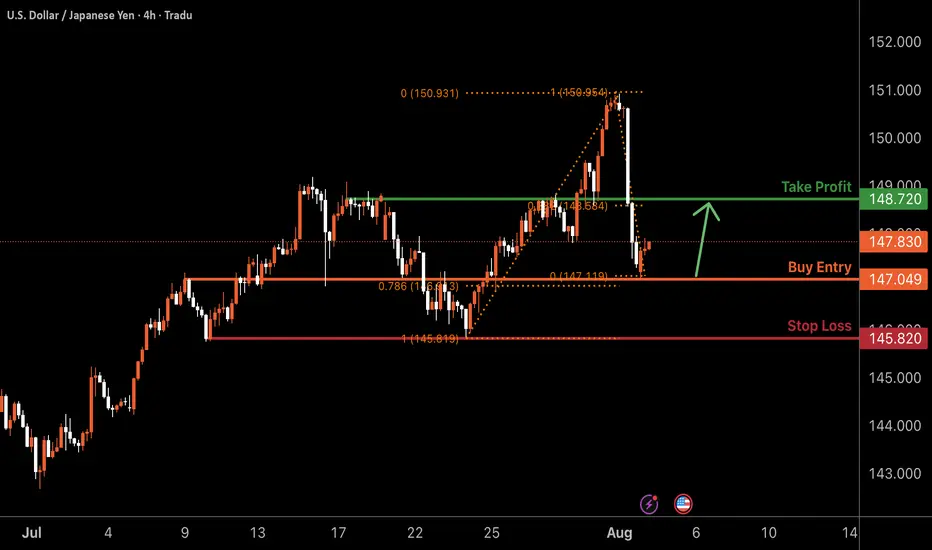
USDJPY H4 | Bullish bounce offBased on the H4 chart analysis, we can see that the price has bounced off the buy entry, which is an overlap support, and could potentially rise further.
Buy entry is at 147.04, which is an overlap support that aligns with the 78.6% Fibonacci retracement.
Stop loss is at 145.82, which is a multi-swing low support.
Take profit is at 148.72, which is a pullback resistance that lines up with the 38.2% Fibonacci retracement.
High Risk Investment Warning
Trading Forex/CFDs on margin carries a high level of risk and may not be suitable for all investors. Leverage can work against you.
Stratos Markets Limited (tradu.com ):
CFDs are complex instruments and come with a high risk of losing money rapidly due to leverage. 65% of retail investor accounts lose money when trading CFDs with this provider. You should consider whether you understand how CFDs work and whether you can afford to take the high risk of losing your money.
Stratos Europe Ltd (tradu.com ):
CFDs are complex instruments and come with a high risk of losing money rapidly due to leverage. 66% of retail investor accounts lose money when trading CFDs with this provider. You should consider whether you understand how CFDs work and whether you can afford to take the high risk of losing your money.
Stratos Global LLC (tradu.com ):
Losses can exceed deposits.
Please be advised that the information presented on TradingView is provided to Tradu (‘Company’, ‘we’) by a third-party provider (‘TFA Global Pte Ltd’). Please be reminded that you are solely responsible for the trading decisions on your account. There is a very high degree of risk involved in trading. Any information and/or content is intended entirely for research, educational and informational purposes only and does not constitute investment or consultation advice or investment strategy. The information is not tailored to the investment needs of any specific person and therefore does not involve a consideration of any of the investment objectives, financial situation or needs of any viewer that may receive it. Kindly also note that past performance is not a reliable indicator of future results. Actual results may differ materially from those anticipated in forward-looking or past performance statements. We assume no liability as to the accuracy or completeness of any of the information and/or content provided herein and the Company cannot be held responsible for any omission, mistake nor for any loss or damage including without limitation to any loss of profit which may arise from reliance on any information supplied by TFA Global Pte Ltd.
The speaker(s) is neither an employee, agent nor representative of Tradu and is therefore acting independently. The opinions given are their own, constitute general market commentary, and do not constitute the opinion or advice of Tradu or any form of personal or investment advice. Tradu neither endorses nor guarantees offerings of third-party speakers, nor is Tradu responsible for the content, veracity or opinions of third-party speakers, presenters or participants.
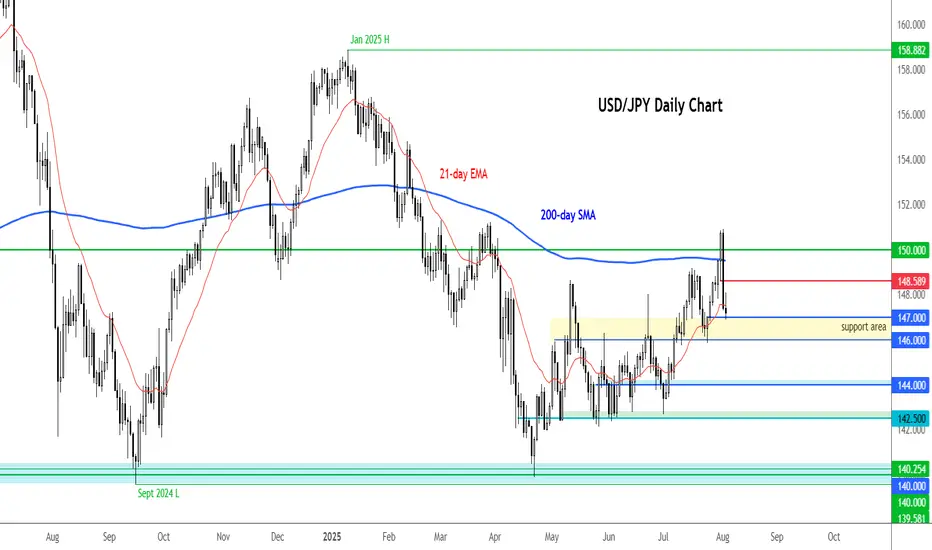
Fundamental Market Analysis for August 4, 2025 USDJPYAfter Friday’s weak U.S. jobs report, USD/JPY fell sharply, breaking below 150. At the start of the new week the pair stabilized around 147–148, yet the fundamental backdrop remains tilted against the dollar: expectations for Fed cuts in the coming months are weighing on U.S. yields and narrowing the U.S.–Japan yield spread—the primary long-run driver of USD/JPY.
Exclusive for our readers – a 202% bonus on deposits of $202 or more! Give the promo code PROFIT202 to customer support and start trading with TRIPLED capital. Full promo details are available via the link.
The Bank of Japan continues an ultra-loose stance, with forecasts showing inflation around target but little appetite for aggressive tightening in the near term. That leaves the main channel of yen support tied to U.S. yield dynamics and global demand for safe-haven assets. With softer U.S. yields and elevated U.S. political uncertainty, demand for defensive currencies may stay resilient.
Additional risk factors include commentary from Japan’s Ministry of Finance regarding the yen and potential bouts of volatility around Fed communications and incoming U.S. data. Today’s base case favors selling USD/JPY on corrective upticks toward 146, as pressure from lower U.S. yields persists.
Trade idea: SELL 147.550, SL 148.550, TP 146.050

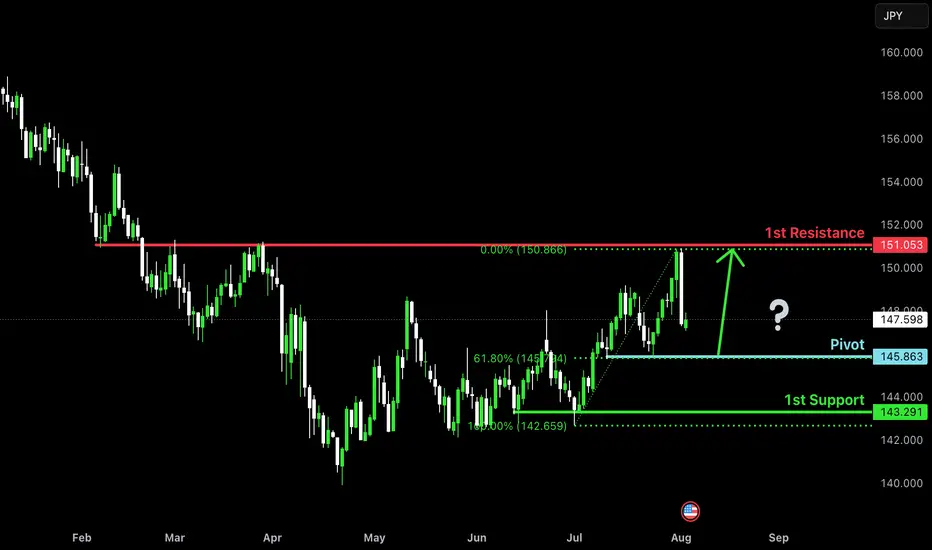
Bullish bounce off pullback support?USD/JPY is falling towards the pivot, which is a pullback support and could bounce to the 1st resistance.
Pivot: 145.86
1st Support: 143.29
1st Resistance: 151.05
Risk Warning:
Trading Forex and CFDs carries a high level of risk to your capital and you should only trade with money you can afford to lose. Trading Forex and CFDs may not be suitable for all investors, so please ensure that you fully understand the risks involved and seek independent advice if necessary.
Disclaimer:
The above opinions given constitute general market commentary, and do not constitute the opinion or advice of IC Markets or any form of personal or investment advice.
Any opinions, news, research, analyses, prices, other information, or links to third-party sites contained on this website are provided on an "as-is" basis, are intended only to be informative, is not an advice nor a recommendation, nor research, or a record of our trading prices, or an offer of, or solicitation for a transaction in any financial instrument and thus should not be treated as such. The information provided does not involve any specific investment objectives, financial situation and needs of any specific person who may receive it. Please be aware, that past performance is not a reliable indicator of future performance and/or results. Past Performance or Forward-looking scenarios based upon the reasonable beliefs of the third-party provider are not a guarantee of future performance. Actual results may differ materially from those anticipated in forward-looking or past performance statements. IC Markets makes no representation or warranty and assumes no liability as to the accuracy or completeness of the information provided, nor any loss arising from any investment based on a recommendation, forecast or any information supplied by any third-party.
USDJPY 4Hour TF - August 3rd, 2025🟦 USDJPY 4H Analysis Bullish Idea
📅 August 3, 2025
🔹 Top-Down Trend Bias:
• Monthly – Bullish
• Weekly – Bearish
• Daily – Bullish
• 4H – Bearish
USDJPY has retraced sharply from local highs, breaking down into prior support near 147.50. Short term structure has shifted bearish, but higher timeframes still lean bullish making this a key reaction zone to monitor.
🔍 Key Zone: 147.00 – 147.50
This zone sits at a prior key support zone. How price reacts here will determine whether the pair resumes its bullish leg or continues deeper.
✅ Scenario A: Bullish Rejection (Blue Path)
1.If price holds above 147.00–147.50 and prints bullish confirmation
2.Look for continuation toward 151.50
Target: 151.50 (next clean resistance zone)
This setup aligns with the HTF bullish trend. Clean break of structure and bullish reactions are needed for confirmation.
⚠️ Scenario B: Bearish Breakdown (Orange Path)
1.If price breaks and closes below 147.500 zone
2.Watch for lower high + retest rejection
Target: 145.00 support zone
This is a lower probability counter trend continuation but is possible if price action presents the needed confirmations.
🧠 Final Notes
• Price is at a decision point, wait for Price action confirmation
• HTF bias leans bullish, but 4H structure must shift back up
• Trade with structure, not against it

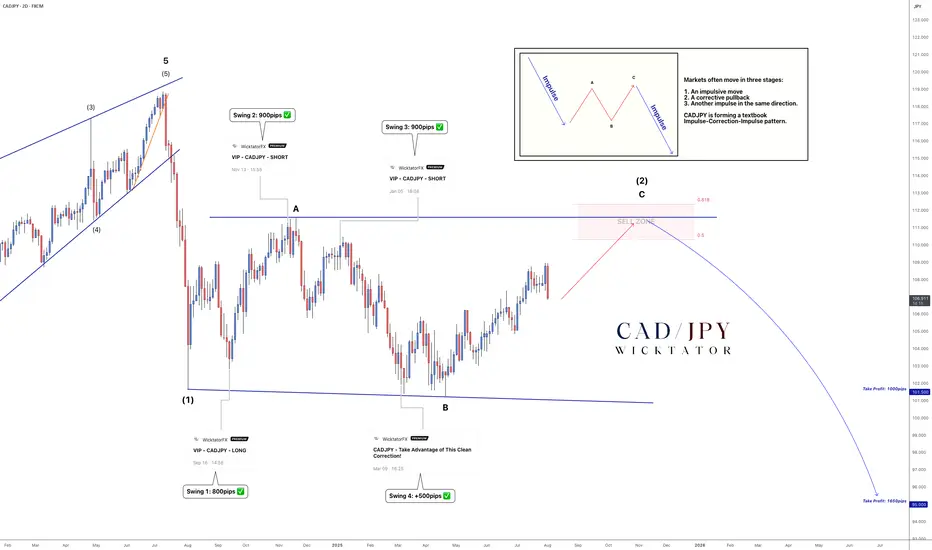
CADJPY - Wave C Near Completion: Big Drop Coming!We’ve been tracking CADJPY for years, and price has followed Elliott Wave structure almost perfectly.
In mid‑2024, an ending diagonal signalled the top and kicked off a major bearish impulse. That drop formed wave A of the current ABC correction. Wave B completed in late 2024, and price is now in wave C -pushing toward the 50–61.8 % Fibonacci retracement, which marks our sell zone.
We’ll be watching for a trendline to form into this zone. A clean break of that trendline will be our trigger to enter shorts.
Trade Idea:
- Watch for rejection in the 50–61.8 % sell zone
- Aggressive entry: Inside sell zone with stops above rejection
- Conservative entry: On break of trendline, stops above the break candle
Targets:
TP1: 101.5 (1000pips)
TP2: 95 ( 1650pips)
Optional: Leave a runner for a long-term swing
See below for our previous CADJPY setups:
Swing 1:
Swing 2:
Swing 3:
Swing 4:
Goodluck and as always, trade safe!