EUR/USD | EURUSD Breakdown Alert: Could It Drop Toward 1.1565?By analyzing the EUR/USD chart on the 2-hour timeframe, we can see that the price is currently trading around 1.162 .
If it manages to hold below the 1.164 level, we could expect further downside movement from the Euro.
The next potential bearish targets are 1.160, 1.158, and 1.1565 .
Please support me with your likes and comments to motivate me to share more analysis with you and share your opinion about the possible trend of this chart with me !
Best Regards , Arman Shaban
USDJPY

USDJPYShort Entry in USDJPY
15m time frame for entry
4hrs time frame for Target
Follow the Risk Management

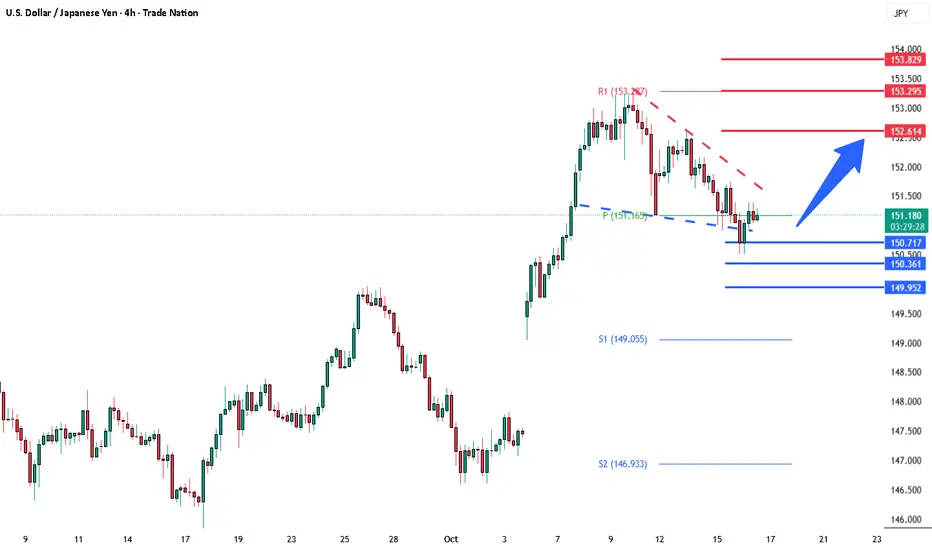
USDJPY coiling price pattern supported at 150.70The USDJPY remains in a bullish trend, with recent price action showing signs of a breakout within the broader sideways trend.
Support Zone: 150.70 – a key level from previous consolidation. Price is currently testing or approaching this level.
A bullish rebound from 150.70 would confirm ongoing upside momentum, with potential targets at:
152.60 – initial resistance
153.30 – psychological and structural level
153.80 – extended resistance on the longer-term chart
Bearish Scenario:
A confirmed break and daily close below 150.70 would weaken the bullish outlook and suggest deeper downside risk toward:
150.35 – minor support
149.95 – stronger support and potential demand zone
Outlook:
Bullish bias remains intact while the USDJPY holds above 150.70. A sustained break below this level could shift momentum to the downside in the short term.
This communication is for informational purposes only and should not be viewed as any form of recommendation as to a particular course of action or as investment advice. It is not intended as an offer or solicitation for the purchase or sale of any financial instrument or as an official confirmation of any transaction. Opinions, estimates and assumptions expressed herein are made as of the date of this communication and are subject to change without notice. This communication has been prepared based upon information, including market prices, data and other information, believed to be reliable; however, Trade Nation does not warrant its completeness or accuracy. All market prices and market data contained in or attached to this communication are indicative and subject to change without notice.
usdjpy On the last day of last week, the sharp decline of this symbol caused the last 4-hour price low to disappear and in the meantime, it hit resistance near the last weekly candle formed.
There is a possibility of filling the price gap of last week.

Stop!Loss|Market View: USDJPY🙌 Stop!Loss team welcomes you❗️
In this post, we're going to talk about the near-term outlook for the USDJPY currency pair☝️
Potential trade setup:
🔔Entry level: 151.332
💰TP: 153.800
⛔️SL: 149.766
"Market View" - a brief analysis of trading instruments, covering the most important aspects of the FOREX market.
👇 In the comments 👇 you can type the trading instrument you'd like to analyze, and we'll talk about it in our next posts.
💬 Description: The gap continues to attract sellers to the USDJPY market, but for now, the USD is still bullish. Without any unexpected news from Japan, we'll likely see growth, and the 150 area is likely to form the basis for continued growth. Closing the gap is less likely in the current situation.
Thanks for your support 🚀
Profits for all ✅
❗️ Updates on this idea can be found below 👇

USDJPY 30-Min — Volume Reversals Triggered by Institutional Flow🩸 Key Technical / Direction (Bullish Reversal Scenario)
Type: Mid-Term Reversal / Volume-Based Entry
———————————
Bullish Reversal Zone:
Price Range: 150.550
☄️Reasons for Entry:
➕Volume Cluster Support (2+ sessions confirmed)
➕Missing POC Retest from Previous Range
➕Delta Imbalance Shows Buyer Absorption
➕10:30 Fixed Range Sweep Below POC (Liquidity Cleared)
➕17:00 Candle Closed Above POC – Confirmation of Defense
➕Cluster Volume Expansion (Reversal Trigger)
➕Clean Liquidity Pool Below Session Low
👽Bias Summary:
Volume absorption visible at support.
Smart money positioned early — reversal logic validated.
🩸 Key Technical / Direction (Bearish Reversal Scenario)
Bearish Reversal Zone:
Price Range: 151.900
Reasons for Entry:
🩸Volume Cluster Resistance (2+ sessions confirmed)
🩸Unretested POC Above Current Session
🩸Delta Imbalance Showing Seller Control
🩸10:30 Fixed Range Sweep Above POC (Liquidity Cleared)
🩸17:00 Candle Failed to Reclaim Above POC
🩸Cluster Volume Expansion (Shift to Supply)
🩸Liquidity Pool Above Previous High
👽Bias Summary:
Distribution confirmed at volume peak.
Cluster rejection aligns with delta flow — reversal logic active

Bearish drop off in play?USD/JPY has rejected off the pivot which is an overlap resistance that aligns with the 50% Fibonacci retracement and could drop to the 1st support.
Pivot: 151.60
1st Support: 149.90
1st Resistance: 152.43
Disclaimer:
The above opinions given constitute general market commentary, and do not constitute the opinion or advice of IC Markets or any form of personal or investment advice.
Any opinions, news, research, analyses, prices, other information, or links to third-party sites contained on this website are provided on an "as-is" basis, are intended only to be informative, is not an advice nor a recommendation, nor research, or a record of our trading prices, or an offer of, or solicitation for a transaction in any financial instrument and thus should not be treated as such. The information provided does not involve any specific investment objectives, financial situation and needs of any specific person who may receive it. Please be aware, that past performance is not a reliable indicator of future performance and/or results. Past Performance or Forward-looking scenarios based upon the reasonable beliefs of the third-party provider are not a guarantee of future performance. Actual results may differ materially from those anticipated in forward-looking or past performance statements. IC Markets makes no representation or warranty and assumes no liability as to the accuracy or completeness of the information provided, nor any loss arising from any investment based on a recommendation, forecast or any information supplied by any third-party.

USDJPY Bullish energy build up support at 150.70The USDJPY remains in a bullish trend, with recent price action showing signs of a breakout within the broader sideways trend.
Support Zone: 150.70 – a key level from previous consolidation. Price is currently testing or approaching this level.
A bullish rebound from 150.70 would confirm ongoing upside momentum, with potential targets at:
152.60 – initial resistance
153.30 – psychological and structural level
153.80 – extended resistance on the longer-term chart
Bearish Scenario:
A confirmed break and daily close below 150.70 would weaken the bullish outlook and suggest deeper downside risk toward:
150.35 – minor support
149.95 – stronger support and potential demand zone
Outlook:
Bullish bias remains intact while the USDJPY holds above 150.70. A sustained break below this level could shift momentum to the downside in the short term.
This communication is for informational purposes only and should not be viewed as any form of recommendation as to a particular course of action or as investment advice. It is not intended as an offer or solicitation for the purchase or sale of any financial instrument or as an official confirmation of any transaction. Opinions, estimates and assumptions expressed herein are made as of the date of this communication and are subject to change without notice. This communication has been prepared based upon information, including market prices, data and other information, believed to be reliable; however, Trade Nation does not warrant its completeness or accuracy. All market prices and market data contained in or attached to this communication are indicative and subject to change without notice.

USDJPY: Selling on lower timeframes as price retraces on the 4hTo better understand my current outlook on USDJPY, please refer to my previous higher-timeframe and fundamental analyses:
* Trend: assessed using at least three trend indicators, with market structure as the primary guide.
** Weak or Reversal Signals: Assessed based on one of our criteria for trend reversal signals.
*** Support/Resistance: Selected from multiple factors – static (Swing High, Swing Low, etc.), dynamic (EMA, MA, etc.), psychological (Fibonacci, RSI, etc.) – and determined based on the trader’s discretion.
**** Our advice takes into account all factors, including both fundamental and technical analysis. It is not intended as a profit target. We hope it can serve as a reference to help you trade more effectively. This advice is for informational purposes only and we assume no responsibility for any trading results based on it.
George Vann @ ZuperView

USDJPY Is Very Bearish! Sell!
Take a look at our analysis for USDJPY.
Time Frame: 1h
Current Trend: Bearish
Sentiment: Overbought (based on 7-period RSI)
Forecast: Bearish
The price is testing a key resistance 152.178.
Taking into consideration the current market trend & overbought RSI, chances will be high to see a bearish movement to the downside at least to 151.305 level.
P.S
Please, note that an oversold/overbought condition can last for a long time, and therefore being oversold/overbought doesn't mean a price rally will come soon, or at all.
Like and subscribe and comment my ideas if you enjoy them!

USDJPY- Do Not Ignore The Gaps And US Yields USDJPY has seen a nice recovery in the last few weeks, but prices are coming out of a previous triangle formation in wave B, meaning the upside could be limited within wave C. Especialyl fi we also conider that recovery from 2025 lows is coming into important 61-78.6% Fib area, where recently bulls slowe down a bit.
We are already seeing some reversal, so it wouldn’t be a surprise to see some new leg down in xxx/JPY pairs too. Also keep in mind there are still some big unfilled gaps, and we can also see one at 149.20 on USDJPY, which could act as a magnet zone in the weeks ahead.
Its important to add at US yields are coming down, as investors moves into treasuries after recent stocks crash, and this can keep JPY supported.
GH

Fundamental Market Analysis for October 15, 2025 USDJPYThe yen is strengthening on Wednesday, 15 October 2025, as the dollar loses support amid expectations of an imminent Fed rate cut. Heightened US–China trade frictions lift demand for defensive assets, including the yen, pulling the pair lower from the 152.000 area. Periodic risk-off episodes during the Asian session add to corrective pressure on the dollar versus the yen.
On a medium-term basis, Japan’s fundamentals are gradually improving: international institutions have raised growth estimates for 2025, and the scenario of cautious Bank of Japan normalization alongside persistent inflation remains in place. Even gradual policy adjustment by the BoJ—against potential easing in the US—narrows the rate differential and caps USD/JPY upside.
Another constraint for the pair is the market’s sensitivity to the possibility of Japanese authorities stepping in during abrupt currency swings. Taken together, these factors form a constructive setup for a tactical short in USD/JPY with a balanced risk-to-reward and clearly defined management levels.
Trading recommendation: SELL 151.500, SL 152.000, TP 150.500

Forex Market Outlook | GU, UJ & Gold Analysis | Oct 13–17In this weekend’s Market Outlook, we break down the big moves from last week and share what to watch for in the coming week (Oct 13–17). We’ll look at GBP/USD, USD/JPY, and XAU/USD side by side, combining fundamentals (news, sentiment, data) with technicals (key price zones and chart setups).
By the end of this video, you’ll understand:
✅Why did the USD gain strength despite the government shutdown?
✅The key levels to watch on GBP/USD, USD/JPY, and Gold.
✅How upcoming events like Powell’s speech, UK jobs data, and U.S. inflation could move the markets.
⚠️ This isn’t a signal service; it’s my personal trading map, shared to help you think and trade smarter.
🔔 I’ll also be dropping updates in the comments section as the week unfolds, so keep an eye there for my real-time thoughts.

Market Analysis: USD/JPY Corrects GainsMarket Analysis: USD/JPY Corrects Gains
USD/JPY is correcting gains from 153.20 and might decline further below 151.00.
Important Takeaways for USD/JPY Analysis Today
- USD/JPY rallied significantly before the bears appeared near 153.20.
- There is a major bearish trend line forming with resistance near 151.55 on the hourly chart.
USD/JPY Technical Analysis
On the hourly chart of USD/JPY, the pair started a steady decline from well above the 153.00 zone. The US Dollar gained bearish momentum below 152.50 against the Japanese Yen.
The pair even settled below 152.00 and the 50-hour simple moving average. A low was formed at 151.00, and the pair is now consolidating losses. On the downside, the first major support is near 151.00.
The next key region for the bulls might be 150.00. If there is a close below 150.00, the pair could decline steadily. In the stated case, the pair might drop toward 148.80. Any more losses might send the pair toward 148.00.
Immediate resistance on the USD/JPY chart is near the 23.6% Fib retracement level of the downward move from the 153.27 swing high to the 151.00 low at 151.55. There is also a major bearish trend line at 151.55.
If there is a close above the trend line and the hourly RSI moves above 50, the pair could rise toward 152.00 or the 50% Fib retracement level at 152.15. The next major barrier for the bulls could be 152.75, above which the pair could test 153.50 in the coming days.
This article represents the opinion of the Companies operating under the FXOpen brand only. It is not to be construed as an offer, solicitation, or recommendation with respect to products and services provided by the Companies operating under the FXOpen brand, nor is it to be considered financial advice.

USDJPY: Bearish Wave Confirmed?! 🇺🇸🇯🇵
Remember a huge gap up opening that USDJPY formed
at the beginning of the last trading week.
It looks like the market is finally ready to fill it.
A formation of a bearish imbalance candle on a daily time frame
this Monday provides a clear sign of a strong selling pressure.
I think that the market will continue falling steadily.
Goal - 148.0
❤️Please, support my work with like, thank you!❤️
I am part of Trade Nation's Influencer program and receive a monthly fee for using their TradingView charts in my analysis.

Stop!Loss|Market View: GBPUSD🙌 Stop!Loss team welcomes you❗️
In this post, we're going to talk about the near-term outlook for the GBPUSD currency pair☝️
Potential trade setup:
🔔Entry level: 1.32869
💰TP: 1.31574
⛔️SL: 1.33603
"Market View" - a brief analysis of trading instruments, covering the most important aspects of the FOREX market.
👇 In the comments 👇 you can type the trading instrument you'd like to analyze, and we'll talk about it in our next posts.
💬 Description: The situation for the pound is very similar to that for the euro. Here, too, the most likely scenario is further price accumulation near the key support level (1.32870), followed by an expected downward breakout toward 1.31000. An alternative scenario involves monitoring a sell entry point near the resistance level at 1.34500. Also, the 1.27000 - 1.28000 range can be looked for as an additional target.
Thanks for your support 🚀
Profits for all ✅
❗️ Updates on this idea can be found below 👇

USD/JPY Bearish Channel Breakdown – Order Block Retest StrategyThe pair is clearly in a downtrend channel (bearish parallel channel).
Price has been respecting lower highs and lower lows, indicating consistent bearish pressure.
The recent bearish order block (OB) and support retest area are the key zones.
---
📉 Chart Structure Analysis
1. Bearish Channel:
Price continues to move inside a well-defined descending channel.
Each pullback toward the upper boundary has been followed by a new lower low.
2. Support Zone:
The price is currently testing a support level near 151.00.
There’s a temporary pause here — possibly a minor liquidity grab before further downside.
3. Bearish Order Block (OB):
The OB is around 151.700–152.000, acting as a strong supply zone.
If price retraces back to this OB, sellers might re-enter with strong momentum.
🔍 Strategy Plan
✅ Bearish Scenario (Most Probable)
Expect a retest of the OB zone (151.700–152.000) before continuing down.
Once rejection appears (bearish engulfing / pin bar / break of structure on smaller TF), enter Sell.
Target: 149.700 (previous swing projection).
Stop-loss: Above OB at 152.200.
Trade Setup Example:
Entry: 151.800 (OB retest)
SL: 152.200 (40 pips)
TP: 149.700 (210 pips)
Risk/Reward: ≈ 1:5.2 ✅
⚠ Bullish Scenario (Low Probability
If price breaks above 152.200 with strong bullish candles and retests it as support,
the bearish channel is invalidated → next target could be 153.000–153.500.
📊 Confirmation Tips
Before entering:
Check for bearish rejection candles on the 15m–30m timeframe.
Confirm with RSI divergence (bearish) or MACD crossover downward.
Watch DXY strength — if the dollar weakens, USD/JPY will likely drop.
🧭 Summary
Bias Entry Zone Stop Loss Target R:R Confidence
🔻 Bearish 151.7–152.0 152.2 149.7 1:5+ High

USDJPY H1 | Bearish Drop-Off in MomentumUSD/JPY has rejected off the sell entry, which is a pullback resistance and could drop from this levle to the downside.
Sell entry is at 152.43, whichis a pullback resistance.
Stop loss is at 153.21, whichis a swing high resistance.
Take profit is at 150.50, whichis a pullback support that is slightly below the 50% Fibonacci retracement.
High Risk Investment Warning
Trading Forex/CFDs on margin carries a high level of risk and may not be suitable for all investors. Leverage can work against you.
Stratos Markets Limited (tradu.com/uk ):
CFDs are complex instruments and come with a high risk of losing money rapidly due to leverage. 65% of retail investor accounts lose money when trading CFDs with this provider. You should consider whether you understand how CFDs work and whether you can afford to take the high risk of losing your money.
Stratos Europe Ltd (tradu.com/eu ):
CFDs are complex instruments and come with a high risk of losing money rapidly due to leverage. 66% of retail investor accounts lose money when trading CFDs with this provider. You should consider whether you understand how CFDs work and whether you can afford to take the high risk of losing your money.
Stratos Global LLC (tradu.com/en ):
Losses can exceed deposits.
Please be advised that the information presented on TradingView is provided to Tradu (‘Company’, ‘we’) by a third-party provider (‘TFA Global Pte Ltd’). Please be reminded that you are solely responsible for the trading decisions on your account. There is a very high degree of risk involved in trading. Any information and/or content is intended entirely for research, educational and informational purposes only and does not constitute investment or consultation advice or investment strategy. The information is not tailored to the investment needs of any specific person and therefore does not involve a consideration of any of the investment objectives, financial situation or needs of any viewer that may receive it. Kindly also note that past performance is not a reliable indicator of future results. Actual results may differ materially from those anticipated in forward-looking or past performance statements. We assume no liability as to the accuracy or completeness of any of the information and/or content provided herein and the Company cannot be held responsible for any omission, mistake nor for any loss or damage including without limitation to any loss of profit which may arise from reliance on any information supplied by TFA Global Pte Ltd.
The speaker(s) is neither an employee, agent nor representative of Tradu and is therefore acting independently. The opinions given are their own, constitute general market commentary, and do not constitute the opinion or advice of Tradu or any form of personal or investment advice. Tradu neither endorses nor guarantees offerings of third-party speakers, nor is Tradu responsible for the content, veracity or opinions of third-party speakers, presenters or participants.

USDJPY (15M) – Demand Zone Reversal Setup FX:USDJPY
🚀
Structure | Trend | Key Reaction Zones
Price has tapped into the strong yellow demand zone, showing initial rejection wicks.
Structure forming a potential double bottom pattern, hinting at early bullish pressure.
Descending structure lines show a clear breakout point near 152.05 where momentum could shift.
Market Overview
USDJPY is trading within a compression channel after a heavy correction phase. The recent touch into the 151.60–151.65 zone confirms institutional demand. If buyers maintain pressure above this base, we could see a clean bullish continuation toward the 152.05–152.60 resistance zone. Patience for confirmation candle or BOS (Break of Structure) above 151.90 is key before entry.
Key Scenarios
✅ Bullish Case 🚀 → 🎯 Target 1: 152.05 → 🎯 Target 2: 152.60
❌ Bearish Case 📉 → Invalidation below 151.50
Current Levels to Watch
Resistance 🔴: 152.05 – 152.60
Support 🟢: 151.60 – 151.50
⚠️ Disclaimer: This analysis is for educational purposes only. Not financial advice.

UJ Sell🆓 Sell Entry: 152.350
⏹️ Stop Loss: 153.600
*️⃣ Take Profit-1: 150.700
*️⃣ Take Profit-2: 150.000

Bearish reversal in play?USD/JPY has rejected off the rersistance level which is a pullback resistance and could drop from this level too ur take profit.
Entry: 152.44
Why we like it:
There is a pullback resistance level.
Stop lodd: 153.25
Why we ike it:
There is a swing high resistance level.
Take profit: 150.42
Why we like it:
There is a pullback support that lines up with the 145% Fibonacci extension.
Enjoying your TradingView experience? Review us!
Please be advised that the information presented on TradingView is provided to Vantage (‘Vantage Global Limited’, ‘we’) by a third-party provider (‘Everest Fortune Group’). Please be reminded that you are solely responsible for the trading decisions on your account. There is a very high degree of risk involved in trading. Any information and/or content is intended entirely for research, educational and informational purposes only and does not constitute investment or consultation advice or investment strategy. The information is not tailored to the investment needs of any specific person and therefore does not involve a consideration of any of the investment objectives, financial situation or needs of any viewer that may receive it. Kindly also note that past performance is not a reliable indicator of future results. Actual results may differ materially from those anticipated in forward-looking or past performance statements. We assume no liability as to the accuracy or completeness of any of the information and/or content provided herein and the Company cannot be held responsible for any omission, mistake nor for any loss or damage including without limitation to any loss of profit which may arise from reliance on any information supplied by Everest Fortune Group.

XAU/USD | Gold Rockets Past $4090 – Over 1000 Pips Gained!By analyzing the Gold (XAU/USD) chart on the 30-minute timeframe, we can see that Gold continued its strong bullish momentum, exactly as expected, and successfully hit all our targets at $4006, $4016, and $4028, fully filling the FVG.
However, Gold didn’t stop there — it kept pushing higher and has just printed a new all-time high (ATH) at $4090!
This move has already delivered over 1000 pips of profit.
Key demand zones are now located at $4051–$4060 and $4020–$4024.
Given the current momentum, I expect Gold to continue rising toward targets above $4100 in the short term.
THE Previous TA :
Please support me with your likes and comments to motivate me to share more analysis with you and share your opinion about the possible trend of this chart with me !
Best Regards , Arman Shaban

USD/JPY Price Outlook – Trade Setup📊 Technical Structure
FOREXCOM:USDJPY USD/JPY is trading near 151.70, consolidating after recent declines. The chart highlights a resistance zone at 152.28–152.39 and a support zone at 151.05–151.18. A short-term rebound toward resistance is possible, but failure at the resistance zone could trigger a downside move back to support. A break below 151.05 would open the door to deeper losses.
🎯 Trade Setup
Entry: 152.28–152.39 (sell near resistance)
Stop Loss: 152.50
Take Profit 1: 151.40
Take Profit 2: 151.18
Take Profit 3: 151.05
Risk/Reward (R:R): ~1 : 4.96
🗝️ Key Technical Levels
Support Zone: 151.05–151.18
Resistance Zone: 152.28–152.39
Trendline Resistance: Downtrend from October highs
🌍 Macro Background
The Japanese Yen gained modest support after Finance Minister Katsunobu Kato warned of one-sided FX moves, fueling speculation of possible intervention. Expectations that the Bank of Japan may raise rates later this year also underpin the yen. However, political uncertainty following the LDP–Komeito coalition breakup and the pending confirmation of Sanae Takaichi as Japan’s first female Prime Minister adds risks, possibly slowing BoJ’s tightening.
On the US side, Trump softened his tariff stance after previously threatening 100% tariffs on Chinese imports effective November 1, easing trade-war fears and supporting risk appetite. The US Dollar remains firm near recent highs, but dovish Fed rate cut expectations (25 bps in October and December, with 97% and 90% odds respectively) limit further upside. Meanwhile, the US government shutdown has dragged into a third week, delaying key economic data releases. The market focus is now on Fed Chair Powell’s speech, which could provide the next directional driver.
📌 Trade Summary
USD/JPY is capped by 152.39 resistance. Short positions near this zone could offer favourable setups, targeting 151.17–151.05 support levels. A clear break above 152.55 would invalidate the bearish outlook.
⚠️ Disclaimer
This analysis is for reference only and does not constitute trading advice. Trading involves significant risk, and proper risk management is essential.
