USD/JPY Buy Zone Setup – Targeting 152.54Current Price: 147.190
Buy Entry Zone: ~146.403
Support Zone (Blue Area): 146.403 – 145.183
Stop Loss: Below 145.183
Target Point: 152.547
Technical Breakdown:
Channel Trend:
The pair is moving inside an upward-sloping channel.
Price is currently in a pullback phase, approaching the lower-mid part of the channel.
Support Zone:
Strong support at 146.40 – 145.18 (marked as the blue buy zone).
Buyers are expected to step in here if tested.
Bullish Scenario:
If price respects the support and bounces, we could see a rally toward 152.547 (target).
This aligns with the upper boundary of the ascending channel.
Bearish Risk:
If price breaks 145.18 with strong volume, bearish momentum could extend, invalidating the long setup.
Next downside risk would open toward 144.00.
Trading Plan (Based on Chart Idea):
Buy Entry: Around 146.40 – 145.80 zone.
Stop Loss: Below 145.18.
Take Profit (TP): 152.54.
Risk/Reward Ratio: Approx 1:4+, which is a strong setup.
📌 This chart is suggesting a buy-the-dip strategy at support for a potential bullish continuation.
Usdjpyidea

USD/ JPY) Bearish Trend analysis Read The captionSMC Trading point update
Technical analysis of USD/JPY (1H) chart idea breakdown from your image:
---
USD/JPY – Bearish Setup (1H Timeframe)
Market Structure:
After a strong bullish rally, price has rejected from 149.6–150.0 zone and shifted bearish.
Price is currently trading below the 50 EMA (148.98) and testing around the 200 EMA (148.45) → showing weakening momentum.
Two Fair Value Gaps (FVG) are highlighted:
Upper FVG (resistance supply zone) near 149.1 – 149.3.
Mid FVG near 148.8 – 149.0, likely a retest area before continuation down.
Price Projection:
Expecting a possible short-term pullback into the yellow FVG zone → rejection from 148.9–149.1.
Bearish continuation could drive price toward the target point: 147.46.
This aligns with the projected measured move shown on the chart.
Indicators:
50 EMA (red) turning down → confirming bearish shift.
200 EMA (blue) being tested → a break below strengthens bearish case.
Mr SMC Trading point
---
Bias: Bearish
Target: 147.46
Invalidation: A strong break and hold above 149.3 (FVG supply)
---
Pelas support boost 🚀 this analysis

USD/JPY) Bearish Trend analysis Read The captionSMC Trading point update
Technical analysis of USD/JPY (1H timeframe) chart analysis:
---
Bearish USD/JPY Setup
Rejection at Resistance: Multiple rejections (red arrows) show strong selling pressure around 149.70 – 149.80 zone.
Fair Value Gap (FVG): Price may retest the FVG supply area before continuing lower.
Moving Averages:
50 EMA (red) is turning flat, showing short-term weakness.
200 EMA (blue) is below, acting as the larger support zone.
Market Structure Shift (MSS): Breakdown of recent support suggests bearish intent.
---
Target Point
Expected drop towards 148.38 – 148.37 (aligned with 200 EMA & previous demand zone).
Mr SMC Trading point
---
Trading Idea
Bias: Bearish.
Entry Zone: Retest of 149.60 – 149.70 (FVG).
Target: 148.38.
Invalidation: A break above 150.00 would invalidate the bearish outlook.
Please support boost 🚀 this analysis

USD/JPY Bullish Reversal Setup – Long Entry at Support Zone1. Price Structure
Price has been in a downtrend channel (highlighted in pink).
It has reached the lower boundary of the channel and seems to be consolidating.
This suggests a possible reversal or breakout to the upside.
2. Entry Point
Marked near 148.419 – 148.439.
This is right at the bottom of the consolidation zone, just above the support area.
3. Stop Loss
Placed around 148.085 – 148.099 (yellow box).
Smartly set below the most recent low to protect against further downside if price breaks support.
4. Target
Target point is at 150.249.
This is a big upside move (around 180 pips from entry).
Good risk-to-reward ratio (approx. 1:4), meaning potential profit is much higher than potential loss.
5. Market Context
The chart suggests that once price breaks above the small downtrend (dashed blue line), it could push strongly upward.
This looks like a bullish flag pattern, which is generally a continuation pattern in an uptrend.
---
📊 Conclusion
Bias: Bullish (buy setup)
Reason: Price is at channel support + entry is near demand zone + bullish breakout potential.
Plan: Buy near 148.42 with stop loss at 148.09 and target 150.25.
Risk/Reward: Favorable (good setup if price respects support and breaks upward).
⚠ Key Risk: If price closes below 148.09 support, this setup becomes invalid and could drop further.

USDJPY further drop?USDJPY has finally drop the first TP hit. with multiple liquidity grab, price drop to the daily support level.
It is possible the price may continute to drop as the respose from the buyers is weak.
From daily perspective price price is approaching the daily 20ema and may continue to drop to the daily support level or beyond.

USDJPY Analysis todayHello traders, this is a complete multiple timeframe analysis of this pair. We see could find significant trading opportunities as per analysis upon price action confirmation we may take this trade. Smash the like button if you find value in this analysis and drop a comment if you have any questions or let me know which pair to cover in my next analysis.

USDJPY Will Keep Growing!
HI,Traders !
#USDJPY is trading in an
Uptrend and the price
Made a bullish breakout
Of the key horizontal
Level of 148.876 and the
Breakout is confirmed so
We are bullish biased
And we will be expecting
A further bullish continuation !
Comment and subscribe to help us grow !

USD/JPY Bullish Breakout Setup – Targeting 150.30 with Strong RiChart Overview
The chart shows a rising channel (highlighted in red with blue borders).
Price recently broke above the upper boundary of the channel and pulled back.
The trader’s setup marks:
Entry Point: 148.417
Stop Loss: 148.067
Target Point: 150.307
Analysis
Trend Context
Since September 18th, price has been in an uptrend (higher highs, higher lows).
The breakout from the channel suggests continuation to the upside.
Entry Point (148.417)
Positioned slightly below the breakout area, allowing entry on a pullback confirmation.
This reduces the risk of entering at the top of the breakout wick.
Stop Loss (148.067)
Well-placed below recent consolidation and the channel’s midline.
If price breaks below this level, it would signal a potential failed breakout and bearish reversal.
Target Point (150.307)
Target is based on the measured move projection (height of the channel added to breakout level).
This aligns with a strong psychological resistance near 150.30 – 150.50.
Risk-to-Reward Ratio (RRR)
Risk (Entry to SL): ~35 pips
Reward (Entry to TP): ~190 pips
RRR ≈ 1:5.4 → very favorable.
Conclusion
This is a bullish breakout trade setup.
If price respects the pullback and stays above 148.40, continuation toward 150.30 is likely.
Watch out for news/events (like BoJ or US Fed comments) since USD/JPY is highly sensitive to fundamentals.
👉 In short: The setup looks solid with a strong uptrend, clean breakout, and excellent risk-to-reward

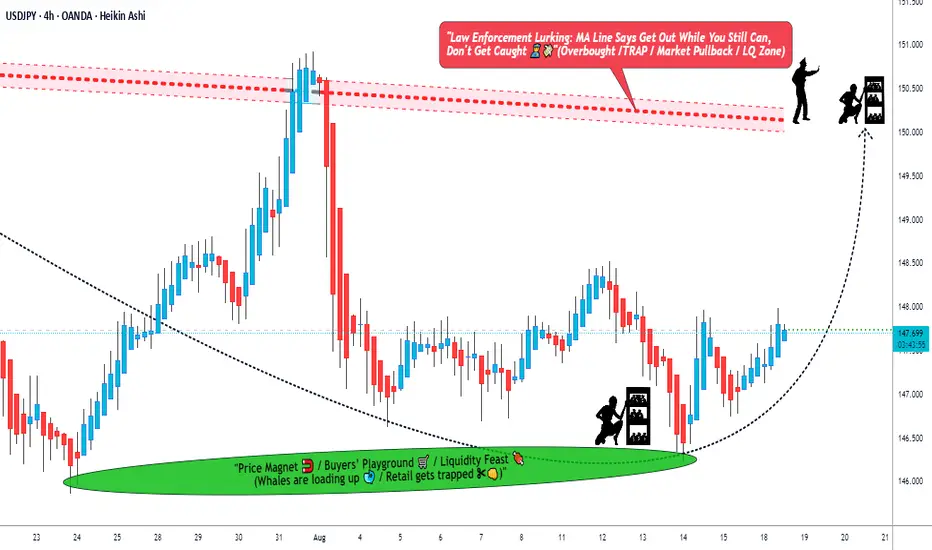
"The USDJPY Ninja Trade – Silent Entry, Big Exit!"🚨💰 USD/JPY “The Ninja” Forex Bank Heist Plan (Swing Trade) 🐱👤💴💵
🎭 Dear Money Makers, Robbers & Thief OG’s,
It’s time to gear up for our biggest Ninja heist on the Forex streets!
We’re breaking into the USD/JPY vault with a Bullish Master Plan – grab your mask, load your limit orders, and let’s rob the market clean! 💰🔫
🗡️ Heist Entry (Layering Style) 📈
Thief doesn’t enter with one bullet – we spray the vault with multiple limit orders! 🎯
First layer: 147.600
Second layer: 147.400
Third layer: 147.200
👉 Add more layers if you want a deeper pullback entry – the more locks you pick, the bigger the loot! 🏦💎
🛑 Thief Stop Loss
This is Thief SL 🔒: 146.500
But remember, dear ladies & gentlemen (Thief OG’s) – adjust your SL based on your own strategy, capital & risk appetite. Stay slick, don’t get caught! 🚔💨
🎯 Target Escape Zone
Police barricade spotted 🚨👮 @ 150.700
Our heist exit point is locked at 150.000 🏃♂️💨
👉 Make sure you grab the loot & escape before the cops arrive. Take profit & celebrate with stolen sushi 🍣 & sake 🍶!
⚠️ Thief Trading Notes
News drops = extra police patrols 🚔 – avoid opening fresh entries during major releases.
Trail your stops to lock in profits – no thief leaves empty-handed!
Stay alert to price traps – don’t get stuck behind enemy lines.
💎 If this heist plan made you some loot, smash that 💖 & BOOST button to power up the Thief Gang 🚀🤝💰
The more boosts, the bigger our robbery squad becomes!
Stay tuned, Ninjas 🐱👤 … the next heist plan is already loading.
💵💎🚀 Thief Trader OUT.
USDJPY Tight Range, Bearish Pressure Building Below TrendlineUSDJPY continues to trade inside a broad descending channel, with sellers stepping in near the 148.20–148.50 region once again. Despite short-term rebounds, the pair struggles to maintain momentum above resistance, signaling that bearish pressure remains intact. A break below near-term supports could open the way for a deeper move toward 145.50.
Current Bias
Bearish – short-term rejection at trendline resistance points to downside continuation unless bulls reclaim 148.50.
Key Fundamental Drivers
Federal Reserve: Softer U.S. data and cooling inflation have increased expectations for rate cuts later this year, weighing on USD strength.
Bank of Japan: Still holding an ultra-loose stance, but higher JGB yields and speculation about eventual policy tweaks are helping limit yen weakness.
Risk Sentiment: Equity pullbacks or tariff-related shocks can drive safe-haven demand for JPY, putting additional pressure on USDJPY.
Macro Context
Interest Rates: U.S. yields are softer as markets price in Fed easing; Japanese yields are edging higher, narrowing the yield gap.
Growth Trends: U.S. growth momentum is slowing, while Japan’s economy remains fragile but stable.
Geopolitics: Trade tensions and tariff headlines add uncertainty and may amplify yen demand in risk-off phases.
Primary Risk to the Trend
A sudden rebound in U.S. yields or stronger U.S. inflation prints could lift the dollar back above 148.50, invalidating the bearish setup.
Most Critical Upcoming News/Event
U.S. PCE inflation data
FOMC speeches regarding rate-cut timing
Japanese CPI release
Leader/Lagger Dynamics
USDJPY is often a leader within yen pairs, driving sentiment across JPY crosses. Movements here influence EURJPY, GBPJPY, and CADJPY.
Key Levels
Support Levels: 147.05, 145.52
Resistance Levels: 148.20, 149.25
Stop Loss (SL): 149.25 (above key resistance)
Take Profit (TP): 147.05 (first target), 145.52 (secondary target)
Summary: Bias and Watchpoints
USDJPY remains capped under trendline resistance, keeping the bias bearish as long as 148.50–149.25 holds. Stops above 149.25 protect against a breakout, while downside targets rest at 147.05 and then 145.52. The main watchpoint is U.S. inflation data and Fed commentary—if they confirm easing, sellers could gain control and extend the decline. Conversely, a surprise hawkish shift could trigger a squeeze higher.

USDJPY setting up for a drop!Series of lower highs with multiple liquidity grab from the trend line, with respecting dynamic resistance 20ema showing up the market to potentially continue to drop through the daily FVG. With upcoming Fed rate cut decision made dollar weaker, while BOJ policy rate on Friday causing to JPYX move up for correction which also fueling USDJPY to drop.
Based on current market structure on 1h timeframe, A potential sell entry upon price action confirmation around 146.48 zone is an ara of value for sell entry!

USDJPY breakout ?USDJPY with Fed interest rate annoucement, has finally got a rejection from key level of support at 145.50 to another key level 148.27. As BOJ policy rate remain as forecast <0.5%, signaling continued bearish turn on JPY which fueling further bullish on USDJPY.
From technical perspective, price had a very strong rejection from key support which potentially continue to rise above 149.12
A potential buy trade upon cross of this 148.27 on a retest is high probable.

Market Analysis: USD/JPY Shows WeaknessMarket Analysis: USD/JPY Shows Weakness
USD/JPY declined below 147.00 and is currently consolidating losses.
Important Takeaways for USD/JPY Analysis Today
- USD/JPY is trading in a bearish zone below 147.00.
- There is a short-term bearish trend line forming with resistance at 146.65 on the hourly chart.
USD/JPY Technical Analysis
On the hourly chart of USD/JPY, the pair started a steady decline from 148.00. The US Dollar gained bearish momentum below 147.50 against the Japanese Yen.
The pair even settled below 147.20 and the 50-hour simple moving average. There was a spike below 146.25 and the pair traded as low as 146.21. It is now consolidating losses with a bearish angle. Immediate resistance on the USD/JPY chart is near the 23.6% Fib retracement level of the recent decline from the 148.07 swing high to the 146.21 low at 146.65.
There is also a short-term bearish trend line forming at 146.65. The next resistance for the bulls could be near the 50% Fib retracement at 147.15.
If there is a close above the 147.15 level and the hourly RSI moves above 50, the pair could rise toward 147.65. The next key area of interest is near 148.05, above which the pair could test 148.50 in the coming days.
On the downside, the first major support is near 146.20. The next key zone is near 145.80. If there is a close below 145.80, the pair could decline steadily. In the stated case, the pair might drop toward 145.00.
This article represents the opinion of the Companies operating under the FXOpen brand only. It is not to be construed as an offer, solicitation, or recommendation with respect to products and services provided by the Companies operating under the FXOpen brand, nor is it to be considered financial advice.

[UPDATE] FOR USDJPY HOURLY IDEAUJ, doing its thing, still on a downtrend and still within a balance Area, and this trade still running according to plan.

USDJPY set to drop fueled by BOJ policy ratewith upcoming FOMC dollar index continue to down while BOJ plicy rate fueling the move showing usdjpy price action showing continued bearish price action with 147.80 to be high liquidity zone with strong liquidity trigger. That may continue the price back to the support level.

USDJPY setting up for another sell?Upcoming Fed rate cut with BOJ policy rate has finally driven DXY to below long term support level with stong impulse of breakdown.
Current support 147.21 turn resistance aligning with the 61.8% fib level may reject with another impulse back below the daily support level.
possible entry at 147.21 to 147.34 after price action confirmation.

USDJPY exactly dropped from the liquidity zone!As our previous prediction on USDJPY for the potential down trend upon liquidity sweep price in fact started to move in the major direction of the trend. There was few pip over extension which may drive the price now well below the support level. Multiple timeframe trend on USDJPY is bearish, price may continue to drop to the long term monthly supprt 144.81

USDJPY possible drop to monthly supportwith weak US job data has weakens the Dollar Index which led USDJPY to break from the resistance. Price has formed currently a bearish market structure which is maintaining series of lower high's showing a probability to drop the price to monthly support. If further downtrend continuation, entry at break of structure is expected.

USDJPY Sell zone to look forWith NFP 22k weaker job data, USDJPY along with DXY rejected from the higher price to the major direction of the trend. Price has got strongly rejected from the monthly, weekly and daily level of resistance. As price approaching the high liquidity zone 147.87, we may expect a strong rejection from the higher price.
147.87 can be a sell level upon price action confirmation.

The Trapdoor Series | USDJPY and the Illusion of StabilityHello traders,
"Markets often build structures that look strong from the outside, but inside they hide a trapdoor waiting to open. On this chart, USDJPY is trading within a rising channel, showing strength at first glance. Yet, multiple CHoCH (Change of Character) points reveal that momentum is fragile every rise carries a hidden weakness.
📌 What stands out here:
Middle Zone has acted as a deceptive balance point, pulling price back again and again, but never giving clear continuation.
Liquidity Pool below, where sell-side orders remain untouched, acts as the hidden floor that price could test at any time.
Gap Fill reaction shows how quickly the market closes imbalances before deciding on its next move.
BSL vs SSL battle highlights how traders are tricked between the highs and lows of the channel, unsure which side will truly break.
This structure is like walking on a floor that looks solid but has a trapdoor hidden beneath. Each candle is a step some are firm, some are fragile and traders who rush forward risk falling through the false ground.
💡 Lesson: A trapdoor only opens when enough weight is placed on it. Similarly, in markets, the real move only happens after enough liquidity has been built to justify a breakout. Until then, what looks like stability can simply be a false stage covering the real path.
👉 The question is: will USDJPY’s next move reveal the hidden trapdoor below 🔻, or will it defy expectations and climb higher 🔺 before the floor gives way? Share your perspective — every view adds another piece to the puzzle."

USDJPY - ShortUSDJPY Analysis - SELL 👆
In this Chart USDJPY H4 Timeframe: By Nii_Billions.
❤️This Chart is for USDJPY market analysis.
❤️Entry, SL, and Target is based off our Strategy.
This chart analysis uses multiple timeframes to analyze the market and to help see the bigger picture on the charts.
The strategy uses technical and fundamental factors, and market sentiment to predict a BEARISH trend in USDJPY, with well-defined entry, stop loss, and take profit levels for risk management.
🟢This idea is purely for educational purposes.🟢
❤️Please, support our work with like & comment!❤️

USDJPY Daily Forecast -Q3 | W36 | D5 | Y25📅 Q3 | W36 | D5 | Y25
📊 USDJPY Daily Forecast
🔍 Analysis Approach:
I’m applying Smart Money Concepts, focusing on:
Identifying Points of Interest on the Higher Time Frames (HTFs) 🕰️
Using those POIs to define a clear trading range 📐
Refining those zones on Lower Time Frames (LTFs) 🔎
Waiting for a Break of Structure (BoS) for confirmation ✅
This method allows me to stay precise, disciplined, and aligned with the market narrative, rather than chasing price.
💡 My Motto:
"Capital management, discipline, and consistency in your trading edge."
A positive risk-to-reward ratio, paired with a high win rate, is the backbone of any solid trading plan 📈🔐
⚠️ Losses?
They’re part of the mathematical game of trading 🎲
They don’t define you — they’re necessary, they happen, and we move forward 📊➡️
🙏 I appreciate you taking the time to review my Daily Forecast.
Stay sharp, stay consistent, and protect your capital
— FRNGT 🚀
FX:USDJPY

USDJPY Daily Forecast -Q3 | W36 | D4 | Y25📅 Q3 | W36 | D4 | Y25
📊 USDJPY Daily Forecast
🔍 Analysis Approach:
I’m applying Smart Money Concepts, focusing on:
Identifying Points of Interest on the Higher Time Frames (HTFs) 🕰️
Using those POIs to define a clear trading range 📐
Refining those zones on Lower Time Frames (LTFs) 🔎
Waiting for a Break of Structure (BoS) for confirmation ✅
This method allows me to stay precise, disciplined, and aligned with the market narrative, rather than chasing price.
💡 My Motto:
"Capital management, discipline, and consistency in your trading edge."
A positive risk-to-reward ratio, paired with a high win rate, is the backbone of any solid trading plan 📈🔐
⚠️ Losses?
They’re part of the mathematical game of trading 🎲
They don’t define you — they’re necessary, they happen, and we move forward 📊➡️
🙏 I appreciate you taking the time to review my Daily Forecast.
Stay sharp, stay consistent, and protect your capital
— FRNGT 🚀
FX:USDJPY
