The USD has lost critical support !!Gold and silver down today but this is the REAL story
(which will affect crypto, stocks, precious metals and commodities also):
the USD has lost a 18 year rising support !!!
Let that sink in !
1 8 y e a r s u p p o r t
Rick Rule has been saying for a long time that the US dollar will probably lose 75% of its purchasing power in the coming years.
Our chart is projecting a 40% loss if the dollar falls along the blue line (in a similar form as in the period from 2002 until 2008) until it touches the falling support line of the magenta multi decade descending channel.
Let's see how it plays out.
Once thing is for sure: precious metals, commodities, crypto and stocks should rip !!
DJ FXCM Index

Is Gold Going Past 6000$- AnalysisGold has been going up for several reasons: Central banks around the world are buying gold at record volumes; Trump's threats of taking over Greenland and Iran are a clear violation of international law, which means that other conflicts around the world can start; Trump's threats of taking Greenland destabilize NATO relationships; China's Mineral Act puts immense pressure on metals such as Silver, which destabilizes supply chains all over the world; The Dollar keeps losing value, and this can be seen with EUR/USD that is around 1.2; FED might lower rates in the future, which helps gold's value rise compared to the dollar.
The reasons for which gold can rise to 6k per ounce might be there. The main reasons revolve around wars that might destabilise the world we live in (Greenland and Iran being taken over), but I believe it mainly involves around new wars that might occur due to a violation of international law by Trump. Now, Gold prices can drop really hard if all these wars settle, Trump makes a deal with China regarding minerals and he stabilizes the US relationship with NATO members, but it seems very unlikely to happen fast. Nonetheless, gold might actually rise to 6k but beware of risks such as it dropping hard in the near future as this gold rise might only be hyper speculation. Don't forget that these institutions buying gold have to sell their gold to realise their unrealized profit, so don't become exit liquidity by buying at any levels. Do your due diligence first before buying in.
Disclaimer:
This analysis is for informational and educational purposes only and does not constitute financial advice, investment recommendation, or an offer to buy or sell any securities. Asset prices, valuations, and performance metrics are subject to change and may be outdated. Always conduct your own due diligence and consult with a licensed financial advisor before making investment decisions. The information presented may contain inaccuracies and should not be solely relied upon for financial decisions. I am not a licensed financial advisor or professional trader. I am not personally liable for your own losses; this is not financial advice.

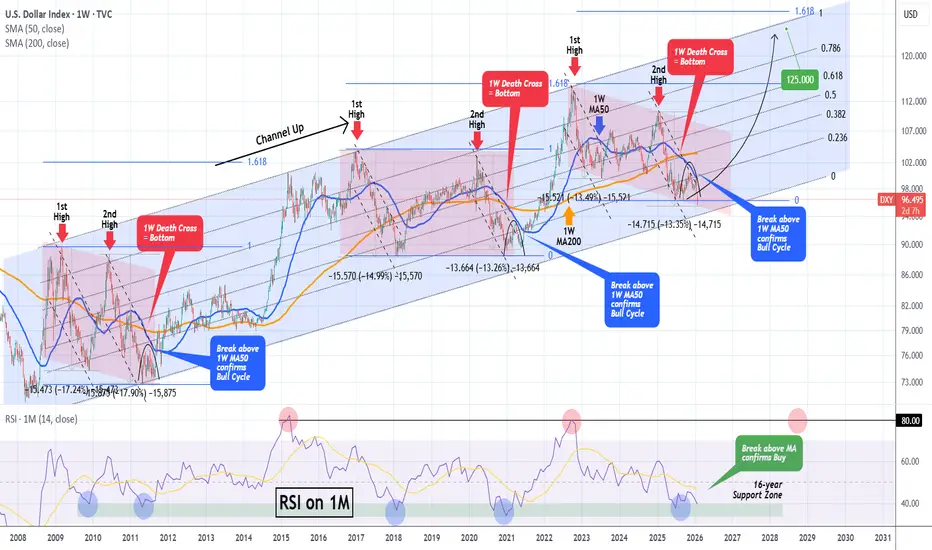
DXY has bottomed and is starting a massive 2-year rallyThe U.S. Dollar index (DXY) has been trading within a Channel Up since the March 2008 bottom during the U.S. Housing Crisis. This is not the first time we use this pattern to identify key macro trend shifts, in fact we revisited it 2 months ago, calling for 'a final pull-back before a massive rally'.
Well the time for this rally is here as yesterday it completed a -13.35% decline from the January 2025 High a year ago.
That decline was technically the Bearish Leg of this pattern's correction phase (red Channel). This is part of its incredible symmetry, with similar correction phases throughout this time period followed by bullish phases, that eventually lead to price rallies to the 1.618 Fibonacci extension.
All conditions for the new Bull Cycle (Bullish Leg) have been fulfilled. Along with the price being at the bottom of the Channel Up, with the -13.35% decline being a benchmark correction historically, we are also past a 1W Death Cross, which has always been a bottom signal on this multi-year Channel Up.
This has always happened at the end of the Bear Cycles (red correction phase) with the Arc pattern making a multi-week Double Bottom before the decisive rebound the breaks above the 1W MA50 (blue trend-line). That break-out is the confirmation of the Bull Cycle start (Bullish Leg).
With the 1M RSI having already touched its 16-year Support Zone, which has provided the most optimal Buy Signals throughout this pattern, we expect the Dollar Index to start rising aggressively in the long-term, targeting the 120.000 - 128.000 Zone on its way to the 1.618 Fib ext, which has been where the previous Higher Highs (Cycle Tops) were priced. 125.000 is a fair Target within a 2-year time-frame.
Notice also that a solid peak indicator (Sell signal) is when the 1M RSI hits 80.00, indicating that the market is massively overbought (overheated trend).
---
** Please LIKE 👍, FOLLOW ✅, SHARE 🙌 and COMMENT ✍ if you enjoy this idea! Also share your ideas and charts in the comments section below! This is best way to keep it relevant, support us, keep the content here free and allow the idea to reach as many people as possible. **
---
💸💸💸💸💸💸
👇 👇 👇 👇 👇 👇
EURUSD 28/01 Retracement in 1.19200 ***US NEWS AHEAD***EURUSD traded in shallow ways which didn't offer me any trade (check the entry level and conditions to support my trade):- No trade "Happy :)"
A quick retracement in 1.1920, level from the HTF's need to support the market and increase the bullish trend we are riding out here.
Big news on USD ahead so the retracement happens now makes sense as we will continue with the HTF's momentum by tomorrow.
Check out the daily FOREXCOM:EURUSD ideas and minds early in the mornings at 6.00 UTC+1
***** Happy trading and see you tomorrow****

XAUUSD - Long Entries Targeting Continuation Higher HighsPrice is in a strong uptrend inside an ascending channel, so bias is bullish toward higher levels around 5,200–5,300. The idea is to wait for a pullback into the marked demand/support zone near the lower channel line and then look for long entries rather than selling.

USD Weakness Fuels Risk-On Ahead of the FedThe US Dollar remains under strong pressure as risk appetite stays elevated. Stocks continue to benefit, but today’s Fed decision could be a key volatility trigger.
Good morning, traders! The US Dollar continues to weaken aggressively, while equities are pushing higher as anticipated, confirming that a risk-on environment remains in play. As long as the USD has room for further downside, stocks may continue to trade within a bullish trend. However, caution is warranted ahead of today’s FOMC meeting, as increased volatility and potential pullbacks are likely.
If the Fed does not deliver a rate cut as expected, markets could react with a short-term risk-off move. That said, the sharp decline in the USD may suggest that a rate cut is already partially priced in. A surprise cut would likely extend USD weakness further and support equities and risk assets.
From a technical perspective, the US Dollar Index (DXY) remains under intraday bearish pressure with scope for additional downside. Still, the structure suggests that price may be completing subwave (v) of wave iii. This opens the door for a corrective rebound in wave iv, potentially revisiting the 96.40–96.80 resistance zone. If that correction unfolds, it could be followed by another impulsive sell-off in wave v of wave 3, targeting the 94.00 area.
Key takeaway: trend remains bearish for the USD, bullish for risk—but the Fed decision is the near-term catalyst that could reshape the next move.

U.S. Dollar Index (DXY) Breaks Down From Range SupportThe U.S. Dollar Index has shifted into a more fragile technical posture after a decisive move below a well-established horizontal support zone near the lower boundary of its recent range. This area had previously acted as demand multiple times, making the breakdown a notable change in structure rather than routine volatility.
From a trend perspective, price is now trading below both the 50-period and 200-period simple moving averages. The 50 SMA has rolled over and is crossing beneath price from above, while the 200 SMA remains overhead, reinforcing a broader bearish bias. The loss of these moving average supports suggests that rallies are currently being met with supply rather than follow-through strength.
Momentum indicators confirm the weakening tone. The MACD has crossed below the zero line, with the signal and histogram both pointing lower, indicating bearish momentum is gaining traction rather than stabilizing. At the same time, RSI has slipped into the low 20s, reflecting strong downside momentum. While this reading highlights short-term oversold conditions, it also underscores the intensity of the recent selloff rather than signaling immediate stabilization on its own.
Overall, the combination of structural support failure, bearish moving average alignment, and negative momentum signals suggests a bearish bias remains in place. Any near-term pauses or rebounds would need to reclaim former support and key averages to meaningfully challenge the current downside pressure.
-MW

Live trade: NZD USD long Similar to last week, I'm (for the time being) more focused on the DXY than the S&P. And I feel sentiment for USD could remain subdued, at least up until tomorrow's FOMC meeting.
The NZD currently has a bit of wind in it's sails thanks to positive data, the AUD or GBP could also be good long options along with the EUR.
The risk to the trade is something happening to stop the current 'sell America' sentiment.
The 12 pip stop loss is 'only' behind a 15min swing. With an 18 pip profit target.

USDCHF Oversold and approaching an 11-year Low.The USDCHF pair has been trading within a Channel Down since its November 2022 High rejection on the 1M MA200 (orange trend-line). This month isn't only approaching the bottom of that pattern but also Support 1, which consists of the January 2015 Low (0.74250).
With the 1M RSI almost oversold and similar to December 2020 (every oversold 1M RSI has historically been a massive long-term buy signal), we don't technically believe that this decline has much more room to extend to, beyond at least the -17.86% of the previous Bearish Leg.
Instead, we treat this as an excellent long-term buy opportunity, with a first Target on the 0.5 Fibonacci retracement level (again similar as the previous Channel Down rebound) at 0.83450. Note that this is more suited to long-term investors and not shorter term traders.
---
** Please LIKE 👍, FOLLOW ✅, SHARE 🙌 and COMMENT ✍ if you enjoy this idea! Also share your ideas and charts in the comments section below! This is best way to keep it relevant, support us, keep the content here free and allow the idea to reach as many people as possible. **
---
💸💸💸💸💸💸
👇 👇 👇 👇 👇 👇

EURUSD and Assets against USD are in strong bullishness ! The EURUSD and the Assets against USD are in continuity of the bullish momentum trend .
Target level in EURUSD of 1.1920 reachable by today may be the best outcome going forward a we reach the end of bullishness.
OANDA:EURUSD
www.tradingview.com

USDJPY Strongest Buy Signal in 4 months on the 1D MA100.The USDJPY pair has hit its 1D MA100 (green trend-line) for the first time in more than 4 months (since September 17 2025), which was the last Higher Low exactly at the bottom of the 9-month Channel Up.
With the 1D RSI oversold, exactly like when the Channel Up started on April 21 2025, we treat this as the strongest long-term buy opportunity towards a potential Resistance (July 03 2024 High) test. As a result, we turn bullish here targeting 162.000.
---
** Please LIKE 👍, FOLLOW ✅, SHARE 🙌 and COMMENT ✍ if you enjoy this idea! Also share your ideas and charts in the comments section below! This is best way to keep it relevant, support us, keep the content here free and allow the idea to reach as many people as possible. **
---
💸💸💸💸💸💸
👇 👇 👇 👇 👇 👇

Can Dollar ready to run!If this breaks out, it always aligns with a commodity bull run. I expect with Canada and China as new allies... China will be heavily involved here.

Can Dollar is setting up for one more massive breakout. This only happens when commodities get really hot.

EURUSD ahead of biggest test in 8 years! Collapse or Golden era?The EURUSD pair is going for its most important test in 8 years, the 1M MA200 (orange trend-line). This level last tested in February 2018, causing a massive rejection, which kick-started the Bear Cycle of 2018 - 2019. Technically that was the Bearish Leg of the 11-year Bearish Megaphone pattern that the pair has been trading in basically since the last time it closed a 1M candle above the 1M MA200, which was in November 2014.
The previous Bearish Leg of 2021 - 2022 also started close to the 1M MA200 but the price got rejected a little lower. Nonetheless, it did create a Lower Highs trend-line, which is currently sitting marginally above the 1M MA200. As a result, EURUSD is approaching a massive Resistance Zone, while at the same time its 1M RSI is attempting to re-test its 66.50 Resistance, which got rejected in June 2025 and also started 8 years ago with the first Lower High.
As a result, until the price closes a 1M candle above the 1M MA200 (would be the first in more than 11 years), we believe it is more likely to see a rejection starting the new Bearish Leg. However the development that confirmed that during the previous two Bearish Legs was a 1M candle closing below the 1W MA50 (red trend-line). If that takes place, it will be the confirmation signal for a long-term Sell.
As far as Targets are concerned, the Jan 2025 Low is our first candidate, targeting 1.0200 fulfils this condition as well as the 0.618 Channel Fibonacci level, which has priced three bottoms in the past 6 years (green circles). A monthly close below Support 1 (Jan 2025 Low) could grant an extension to the 0.786 Channel Fib at 0.9800, which is where another three Lows were price (blue circles).
In any event, if the 1M RSI turns oversold (below 30.00) it has been the ultimate long-term Buy Signal within 11 years and we will turn into long-term buyers regardless of the actual price of EURUSD at the time.
---
** Please LIKE 👍, FOLLOW ✅, SHARE 🙌 and COMMENT ✍ if you enjoy this idea! Also share your ideas and charts in the comments section below! This is best way to keep it relevant, support us, keep the content here free and allow the idea to reach as many people as possible. **
---
💸💸💸💸💸💸
👇 👇 👇 👇 👇 👇

FOREX: Weekly Review USD selling was practically relentless throughout the week starting Monday 19 January. A return of the post liberation day 'sell America' trading environment hit stocks bonds and the dollar. The initial catalyst was the president's threat of more traffis on European countries, an attempt to gain leverage in Greenland. Causing a breakdown in the standard correlations we are used too, the AUD and NZD gained during the initial risk off environment. And thanks to its own issues, the JPY didn't strengthen when the market was 'risk off'.
The AUD and NZD strength whilst the environment was fraught could be attributed to a number of things, traders sought the relative 'safety' of two islands largely shielded from the chaos. Plus, both countries released positive data throughout the week, for the RBA in particular, the prospect of a 'rate hike' is back on the table.
By mid week, the Greenland tension 'de-escalated'. But sentiment for the USD remained subdued as US data continues to come in 'just soft enough' to warrant thoughts of a soft landing'. And in the lead up to the BOJ meeting, there was a case to say 'take your pick' for either a USD or JPY short trade.
The BOJ once again held rates and once again didn't provide clarity on the timing of the next rate hike. Compounding JPY weakness. Only for the MOF to 'seemingly' step in with intervention, giving a sharp bout of strength to the yen. Whether the MOF did intervene, or whether it was market jitters in anticipation of intervention is unclear. But the playbook remains, once any bouts of JPY strength peters out, 'short JPY trades' are on the table.
In other news, it was a solid data week for the UK, keeping the GBP on the 'to long list'. Earnings season once again is slipping under the radar, long may that continue. And the price of gold continues to make headlines, maybe there is an overdue case to add XAUUSD to the list of tradable currencies?, something I will give thought to.
For now, I'll begin the new week with a tentative 'risk on' bias, keeping a keen eye on JPY and the MOF's tolerance. Plus I'll keep a keen eye and the DXY.
On a personal note, it was my first four trade week for a very long time.
A NZD JPY long, which was eventually closed for a very small profit pre US CPI data. It was one of those that 'looks like' I should have let the trade run. But I still say it was the right decision to close the trade early ahead of data.
Due to my personal calender, I then found myself 'anticipating' a positive environment due to 'Greenland de-escalation'. A GBP CHF long, which stopped out and a EUR USD long, which hit profit. The EUR USD trade was particularly bold as it required trading through red flag US data and the trade could very easily have gone the other way.
Finally, once Friday's ISM data wasn't 'hot', I felt it could be a springboard for USD weakness to continue. I placed a GBP USD long trade which hit profit.
US Dollar: Bearish! Look To Sell A Short Term Pullback.Welcome back to the Weekly Forex Forecast for the week of Jan 26-30th.
In this video, we will analyze the following FX market: USD Dollar
The USD took a hard downturn last week with the announcement of Trump tariffs. The market closed bearish, and I think there will be some continuation going into this week.
I am expecting a short term pullback followed by further declines.
Enjoy!
May profits be upon you.
Leave any questions or comments in the comment section.
I appreciate any feedback from my viewers!
Disclaimer:
I do not provide personal investment advice and I am not a qualified licensed investment advisor.
All information found here, including any ideas, opinions, views, predictions, forecasts, commentaries, suggestions, expressed or implied herein, are for informational, entertainment or educational purposes only and should not be construed as personal investment advice. While the information provided is believed to be accurate, it may include errors or inaccuracies.
I will not and cannot be held liable for any actions you take as a result of anything you read here.
Conduct your own due diligence, or consult a licensed financial advisor or broker before making any and all investment decisions. Any investments, trades, speculations, or decisions made on the basis of any information found on this channel, expressed or implied herein, are committed at your own risk, financial or otherwise.

EUR/USD - H4 Weekly Outlook - Breakout Loading ?📝 Description 🔍 Market Structure
EUR/USD remains in a strong H4 uptrend, supported by a rising trend OANDA:EURUSD line and higher-high / higher-low structure. Price is currently compressing below a key resistance zone, suggesting a breakout or pullback scenario is loading.
🔴Trendline support respected multiple times
🔴Price holding above key moving averages
🔴Momentum slowing near resistance → decision zone
📍 Key Support & Resistance
🟢 Resistance Zone: 1.1760 – 1.1800
(June & September highs in focus)
🔴 1st Support: 1.1600 – 1.1580
🔴 2nd Support: 1.1540 – 1.1520
#EURUSD #ForexTrading #WeeklyOutlook #BreakoutSetup #PriceAction #SupportResistance #TradingView #Kabhi_TA_Trading
⚠️ Disclaimer
This analysis is for educational purposes only.
Forex trading involves risk — always manage position size and use a stop-loss.
💬 Support & Engagement👍 Like if you’re waiting for the breakout
💬 Comment: Breakout or Pullback first?
🔁 Share with traders watching EUR/USD

Gold ATH Is Not Random – It’s a War to Defend the USDBombs and bullets are just smoke screens.
The real war is about who still controls the world’s money.
And that’s why Trump appears at the right time.
This is not a shooting war.
It’s a war to protect the US dollar.
If you look at US actions separately, everything feels messy:
Pressure on Iran
Sanctions and control over Venezuela
Tough stance with Russia, yet still talking
For new traders → it looks chaotic.
But once you put everything on one chessboard, there’s only one objective:
👉 Make sure the world still needs USD.
Not oil.
Not Iran.
Not Venezuela.
👉 Settlement currency.
Why is USD so important?
The US today:
Doesn’t compete on cheap labor
Doesn’t mass-produce low-cost goods
Doesn’t live off exports
👉 The US lives on money and the financial system.
If USD loses its central role:
Printing money becomes hard
National debt becomes a real burden
Military power loses its “credit-backed” strength
👉 Lose USD = lose superpower status.
Where does the real problem start?
Some countries sell oil to China without using USD, instead using:
Chinese yuan
Bilateral swaps
Systems outside US control
👉 For the US, this is a direct attack on the foundation of its power,
without firing a single bullet.
So what is Trump doing?
Not fighting to seize oil.
Not fighting to take land.
👉 Trump is making non-USD oil trading risky.
Very pragmatic moves:
Creating controlled instability
Disrupting “off-system” oil flows
Forcing countries back to USD because… it’s safer
A simple example for traders
Imagine a market where only one currency is accepted.
You want to buy anything?
You must use that currency.
One day, some stalls say:
“We’ll accept another currency. It’s cheaper.”
The market owner doesn’t shut them down.
He just:
Makes selling harder
Increases delivery risks
Tightens inspections
👉 Eventually, those stalls go back to the old currency to avoid headaches.
That’s exactly how USD and oil work.
Putting it all together – the trader’s view
Iran – Venezuela – Middle East
These are not random events.
👉 This is a war to maintain the monetary order.
Trump:
Isn’t fighting for oil
Isn’t fighting for morality
👉 He’s fighting for the settlement currency.
Anyone who makes the world less dependent on USD
automatically becomes a target.
CONCLUSION – trader style, slightly sarcastic 😄
Gold ATH is not the market being crazy.
👉 It’s the result of a war to protect the global “toll currency.”
If you understand this:
Charts feel less “stupid”
You stop wanting to short every high candle
Your account suffers less heart attacks
But wait 😄
The real question is:
If the big players are fighting a monetary chess game,
where should retail traders stand to avoid getting wiped out?
In the next part, I’ll talk about:
Why SELLING gold at ATH is extremely hard to survive
When chasing BUYs is stupid – and when it’s actually right
How traders can protect their rice bowl when the chart runs like it’s being chased
👉 If this hits home, drop a 🚀
Enough 🚀 and I’ll continue – no secrets 😏

GBPUSD M30 HTF FVG Rejection and Bearish Continuation Setup📝 Description
GBPUSD on the 30-minute timeframe has impulsively rallied toward the higher-timeframe Fair Value Gap (H1 FVG) and is now trading in close proximity to this premium area. While price has not yet fully mitigated the FVG, the approach into this zone raises the probability of a bearish reaction and downside rotation.
________________________________________
📈 Signal / Analysis
Primary Bias: Bearish below the H1 FVG
Preferred Setup:
• Entry: 1.3527
• Stop Loss: Above 1.3541
• TP1: 1.3510
• TP2: 1.3497
• TP3: 1.3483
________________________________________
🧠 ICT & SMC Notes
• Liquidity taken above recent highs (buy-side sweep)
• No strong bullish continuation or acceptance above value
• Downside targets align with internal sell-side liquidity
________________________________________
📌 Summary
As long as price remains below the H1 FVG and fails to reclaim higher structure, the bearish continuation scenario remains favored with expectations of a rotation toward lower liquidity pools.
________________________________________
🌍 Fundamental Notes / Sentiment
With USD maintaining relative strength and no strong bullish catalysts for GBP, near-term downside pressure remains likely, especially if upcoming data supports a risk-off tone.
________________________________________
⚠️ Risk Disclosure
Trading involves substantial risk and may result in capital loss. This analysis is for educational purposes only and does not constitute financial advice. Always apply proper risk management, predefined stop-loss levels, and disciplined position sizing aligned with your trading plan.

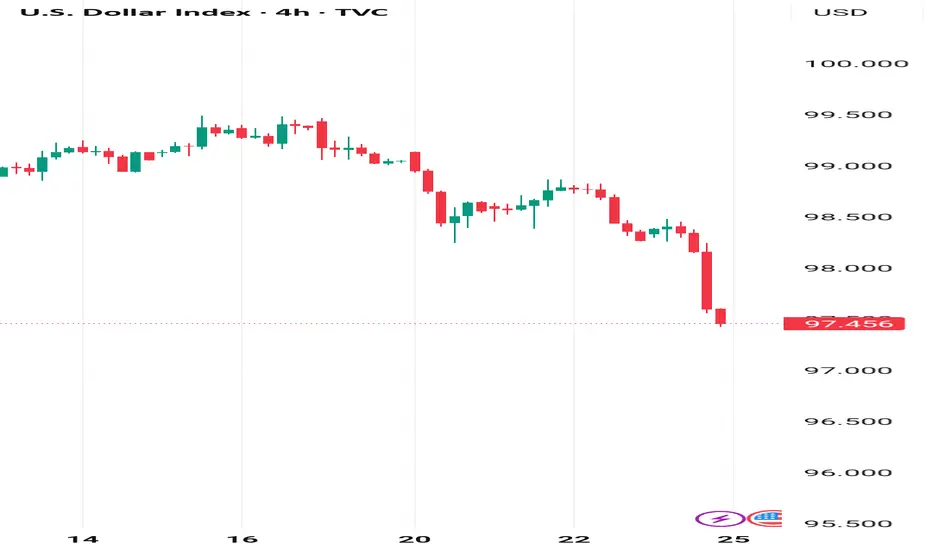
DXY — Execution NeutralVolume expanded into the NY session as price broke the prior low at 97.884, while cross-asset strength in gold and the euro increased execution risk.
Market data behavior observation.
No prediction. No instruction.
— Danel Fadejev
CORE5 Tradecraft

GBPUSD Final rally before a 2026 collapse.The GBPUSD pair has been trading within a giant Bullish Megaphone pattern for the past 3 years. This week will most likely be the first to close green after three straight bearish 1W candles. It is likely however to be the last one as having broken below its 1W MA50 (blue trend-line) in November 2025, the pair has confirmed the start of a new Bear Cycle.
So far, that is similar to the 2019 - 2021 Bullish Megaphone, which after making a 1W MA100/ 200 Bearish Cross and breaking below its 1W MA50, it confirmed a massive Bear Cycle that first hit its bottom on the 0.836 Fibonacci level and then broke the pattern to the downside making a new market Low.
As a result, we expect this week's bullish sentiment to reverse on the Lower Highs Resistance (2021 also displayed one) and towards the end of 2026 test the 0.836 Fib at 1.2400. Notice also the striking similarities among the 1W RSI sequences of those two fractals.
---
** Please LIKE 👍, FOLLOW ✅, SHARE 🙌 and COMMENT ✍ if you enjoy this idea! Also share your ideas and charts in the comments section below! This is best way to keep it relevant, support us, keep the content here free and allow the idea to reach as many people as possible. **
---
💸💸💸💸💸💸
👇 👇 👇 👇 👇 👇

EURUSD M15 Bearish Pullback Into FVG and Continuation Setup📝 Description
EURUSD on the 15-minute timeframe is trading within a corrective pullback after a bullish impulse and is now reacting inside a refined M30 Fair Value Gap. Price shows signs of rejection from premium, suggesting a potential continuation toward lower HTF liquidity.
________________________________________
📈 Signal / Analysis
Primary Bias: Bearish while price holds below the M30 FVG and recent lower high
Preferred Setup:
• Entry: 1.1738
• Stop Loss: Above 1.1742
• TP1: 1.1731
• TP2: 1.1727
• TP3: 1.1718 (HTF FVG draw)
________________________________________
🧠 ICT & SMC Notes
• Pullback into M30 FVG acting as premium PD array
• Weak bullish follow-through after impulse
• No bullish CHOCH on lower timeframes
• Targets aligned with H1 FVG and downside liquidity
________________________________________
📌 Summary
As long as price remains capped below the M30 FVG, bearish continuation remains favored with a draw toward lower-timeframe inefficiencies.
________________________________________
🌍 Fundamental Notes / Sentiment
In the absence of strong euro catalysts and with short-term dollar stability, downside continuation remains technically supported.
________________________________________
⚠️ Risk Disclosure
Trading involves substantial risk and may result in capital loss. This analysis is for educational purposes only and does not constitute financial advice. Always apply proper risk management, predefined stop-loss levels, and disciplined position sizing aligned with your trading plan.

GBPUSD M15 HTF FVG Support and Bullish Continuation Setup📝 Description
GBPUSD on the 15-minute timeframe has delivered an impulsive bullish expansion and is now consolidating above a fresh M15 Fair Value Gap. Price is holding above the pullback low, indicating acceptance above value and continuation potential toward higher liquidity.
________________________________________
📈 Signal / Analysis
Primary Bias: Bullish while price holds above the M15 pullback low and FVG base
Preferred Setup:
• Entry: 1.3527
• Stop Loss: Below 1.3515
• TP1: 1.3537
• TP2: 1.3544
• TP3: 1.3554
________________________________________
🧠 ICT & SMC Notes
• Strong bullish displacement confirming short-term order flow shift
• Price respecting M15 FVG as a support PD array
• No bearish CHOCH observed on lower timeframes
________________________________________
📌 Summary
As long as price remains above the M15 FVG and the pullback low holds, bullish continuation remains favored with expectations of a draw toward higher buy-side liquidity.
________________________________________
🌍 Fundamental Notes / Sentiment
With relative GBP strength and stable risk sentiment, short-term bullish continuation remains supported unless macro risk-off conditions emerge.
________________________________________
⚠️ Risk Disclosure
Trading involves substantial risk and may result in capital loss. This analysis is for educational purposes only and does not constitute financial advice. Always apply proper risk management, predefined stop-loss levels, and disciplined position sizing aligned with your trading plan.
