USDJPY FRGNT DAILY FORECAST & RESULT - FORECAST POSTED 2 DAYS AG📅 Q4 | W50 | D12 | Y25 |
📊 USDJPY FRGNT DAILY FORECAST & RESULT - FORECAST POSTED 2 DAYS AGO
🔍 Analysis Approach:
I’m applying Smart Money Concepts, focusing on:
Identifying Points of Interest on the Higher Time Frames (HTFs) 🕰️
Using those POIs to define a clear trading range 📐
Refining those zones on Lower Time Frames (LTFs) 🔎
Waiting for a Break of Structure (BoS) for confirmation ✅
This method allows me to stay precise, disciplined, and aligned with the market narrative, rather than chasing price.
💡 My Motto:
"Capital management, discipline, and consistency in your trading edge."
A positive risk-to-reward ratio, paired with a high win rate, is the backbone of any solid trading plan 📈🔐
⚠️ Losses?
They’re part of the mathematical game of trading 🎲
They don’t define you — they’re necessary, they happen, and we move forward 📊➡️
🙏 I appreciate you taking the time to review my Daily Forecast.
Stay sharp, stay consistent, and protect your capital
— FRNGT 🚀
USDJPY 📈 +4% Locked In 🎯
Shared earlier inside FRGNT Learn & Earn 🔥
👉 Standard snap-retest entry
👉 HTF directional long bias
👉 Asia range confluence perfectly aligned
🚀 Targeting the 4H 50 EMA — clean, controlled execution.
FRGNT 📌
DJ FXCM Index

US Dollar: Bearish! Look To Sell it towards 98.56!Welcome back to the Weekly Forex Forecast for the week of Dec 8-15th.
In this video, we will analyze the following FX market: USD Dollar
The USD is currently bearish, sitting in a Daily -FVG. If the FVG holds, the sell off will continue from last week. Should the -FVG fail, then hold off on sells! A close above the -FVG will be a bullish indication.
Wed's FOMC will likely weaken the currency further, as institutions have seemingly baked in their bearish bets.
Enjoy!
May profits be upon you.
Leave any questions or comments in the comment section.
I appreciate any feedback from my viewers!
Disclaimer:
I do not provide personal investment advice and I am not a qualified licensed investment advisor.
All information found here, including any ideas, opinions, views, predictions, forecasts, commentaries, suggestions, expressed or implied herein, are for informational, entertainment or educational purposes only and should not be construed as personal investment advice. While the information provided is believed to be accurate, it may include errors or inaccuracies.
I will not and cannot be held liable for any actions you take as a result of anything you read here.
Conduct your own due diligence, or consult a licensed financial advisor or broker before making any and all investment decisions. Any investments, trades, speculations, or decisions made on the basis of any information found on this channel, expressed or implied herein, are committed at your own risk, financial or otherwise.

Are U.S. Dollar Bears getting exhausted?Still holding on to my EUR/USD short positions since late June/early July and it’s been quite a game of patience at this point but as I have been analyzing the U.S. Dollar for the past few months, from a purely technical analysis perspective, I’m currently still seeing the U.S. Dollar potentially carving out a bottom here and make a run to re-visit the 100 - 102 price zone.
I know markets are highly anticipating a Federal Reserve rate cute in September but with inflation still sticking around, it may not be such a sure thing just yet.
All eyeballs and ears will be on tap for Powell’s speech on Friday.
Technical analysis signals:
• Descending Broadening/Expanding Wedge (Bullish Pattern)
• MACD Histogram showing a sign of potential bearish exhaustion

AUDUSD on its most important week of the past 5 years.The AUDUSD pair has been trading on a strong bearish trend under the heavy Resistance pressure of the 5-year Lower Highs trend-line, which just broke above it this week.
This is the most critical multi-year test for the pair as a weekly closing above the Lower Highs trend-line, thus the 1W MA200 (orange trend-line) also which has been intact since Jan 2023, will place the market on a new potentially long-term bullish trend.
If it closes below the Lowe Highs trend-line though, that would be the most optimal sell signal to target the 0.786 Fibonacci level at 0.60700.
---
** Please LIKE 👍, FOLLOW ✅, SHARE 🙌 and COMMENT ✍ if you enjoy this idea! Also share your ideas and charts in the comments section below! This is best way to keep it relevant, support us, keep the content here free and allow the idea to reach as many people as possible. **
---
💸💸💸💸💸💸
👇 👇 👇 👇 👇 👇

USDJPY is forming an M pattern with strong bearish momentum.
After the impulsive move to the downside, price may retrace toward the 50% Fibonacci level, where there is a clear imbalance zone. From that area, a continuation to the downside is expected.
However, since we have high-impact Forex news later today, it is best to remain patient and wait for confirmation. As long as the price does not break above 157, the bearish scenario remains valid.
This setup offers a solid sell swing opportunity if the rejection is confirmed.

AUD USD long: live trade with explanation It took a little while for the market to make up its mind. But the ultimate takeaway from the FOMC has been that the message wasn't 'too hawkish', putting the USD under pressure against the rest of the currencies.
You could even make a case for long JPY or CHF.
I'm sticking with AUD long because I feel the chart has room to the upside, although 'soft employment data' has taken the wind out of the AUD a little and is a risk to the trade. The other risk being the markets reaction at the US open. But I'm heading out and I'm 'anticipating' USD weakness. Particularly given US jobless claims data.
This is a trade I will leave on through market close until completion, for better or worse.

HOW TO TRADE FUNDAMENTALS: A simple 3 point plan When I first started trading, I went heavily down the technical indicator route (as I imagine most people do). RSI, SLOW STOCHASTIC, BOLLINGER BANDS, MACD, FIBONACCI. ICHIMOKU CLOUD. Devising strategies, testing, back testing, and for periods of time they all worked. But, over a long period of time my account was stuck in a rut, ultimately breaking even at best. A big part of my lack of consistency was down to my own psychology, but it was only when I came to the realisation that indicators alone don't move an instrument. In fact, most indicators are backward looking. I stripped my charts of indicators, only keeping BILL WILLIAMS FRACTALS and started my quest to understand the underlying fundamentals behind market moves.
My results and consistency improved almost instantly. I'm sure there are many successful ‘technical only’ traders. But I just feel an awful lot more confident and relaxed placing trades with an understanding of the fundamentals behind my idea. And the beauty of it is, fundamental trading doesn't have to be complicated, in fact, the simpler you can make it the better.
Here is my interpretation of the basic knowledge required to trade Forex using fundamentals:
A quick look at a currency's reaction to RED FLAG data (particularly USD data), leaves you with no doubt how important economic fundamentals are to a currency's movement. CPI / EMPLOYMENT / RETAIL SALES and GDP all play a part in the economic wellbeing of a country. The simple correlation being: positive data = positive currency.
The other RED FLAG event (and perhaps most important) is interest rate decisions. The simple correlation being: higher interest rate = strong currency. And the market focuses on, not just the actual current interest rate but also, the perceived direction of interest rates over the coming months.
Finally, arguably the biggest driver of a currency's movement, is the ‘overall market risk environment’. In simple terms: if the mood is positive, it's classed as ‘risk on’. If the mood is negative, it's classed as ‘risk off’. A multitude of catalysts can alter the market's mood. Geopolitical events, company earnings, political statements, the list is endless. And the currencies react in accordance to correlations with other instruments, such as the S&P 500 and the US bond market.
(Note the recent correlation between DXY and USD JPY above)
In simple terms:
Risk on = strong AUD, NZD, GBP, CAD
Risk off = strong JPY, CHF, USD, EUR
There are nuances, such as the USD and EUR often also strengthen in a ‘risk on environment’. But the above is a good rule of thumb to start with.
By doing a little bit of reading every day, you quickly pick up on whichever ‘event’ the market is currently focused on and form an underlying bias for each currency.
And you can implement a very straightforward 3 point plan:
1: Gather knowledge to form an underlying opinion.
2: Identify a catalyst that lines up with your opinion.
3: Use support and resistance points according to BILL WILLIAMS FRACTALS to identify enter and exit points.
You'll soon find you can identify ‘high confidence set ups’ and by using a higher risk reward ratio per trade, a gradually rising profit curve becomes a reality.

UASDCAD: Bearish! A Little Pullback, Then Down!The USD has been weakened over the past couple of weeks. Markets are at a 90% pchance the Fed cut rates by .25 bp, and that Trump will be installing Hasset, a loyalist, as Fed Chair. Couple that with the positive job numbers that Canada announced last week, and you see the downward trajectory of the USDCAD heading down.
It seems very likely that we will see more movement downtown this week.
I am expecting an OHLC candle for the week ahead.
The Draw on liquidity (DOL) would likely be the relative equal lows to the left.
May profits be upon you.
Disclaimer:
I do not provide personal investment advice and I am not a qualified licensed investment advisor.
All information found here, including any ideas, opinions, views, predictions, forecasts, commentaries, suggestions, expressed or implied herein, are for informational, entertainment or educational purposes only and should not be construed as personal investment advice. While the information provided is believed to be accurate, it may include errors or inaccuracies.
I will not and cannot be held liable for any actions you take as a result of anything you read here.
Conduct your own due diligence, or consult a licensed financial advisor or broker before making any and all investment decisions. Any investments, trades, speculations, or decisions made on the basis of any information found on this channel, expressed or implied herein, are committed at your own risk, financial or otherwise.

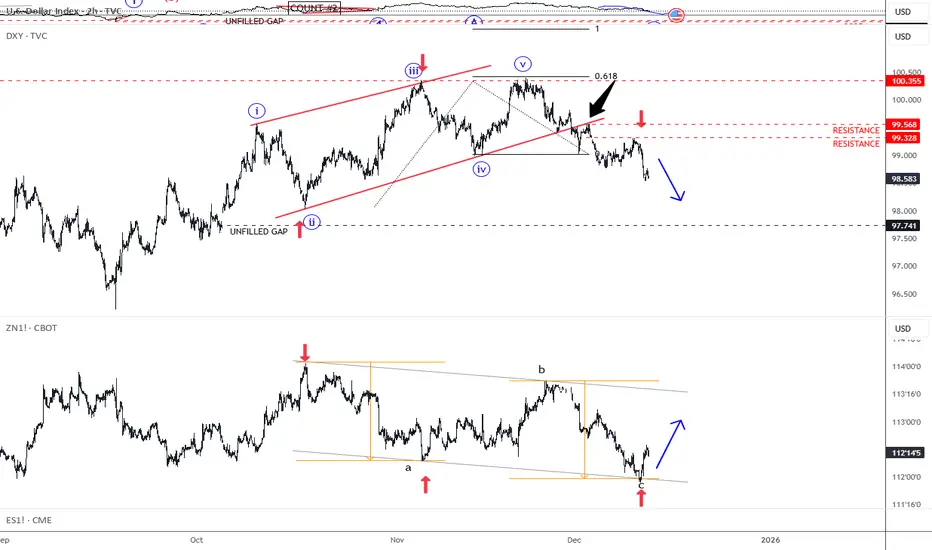
Fed Cuts, Treasuries Bounce, Dollar Slips FurtherGood morning traders! The Fed cut interest rates by 0.25% yesterday, marking the third straight cut. A few members dissented, showing the committee isn’t fully aligned. They proceeded with the cut as the job market continues to cool, even though inflation is still sticking around. The Fed also hinted this could be the last cut for a while and announced plans to start buying short-term Treasuries to keep liquidity stable. The US dollar remains under bearish pressure, while stocks hold steady, keeping the risk-on sentiment intact. This momentum could carry into year-end, we should just be aware of potential short-term pullbacks. USDollar Index - DXY remains nicely bearish, supported by 10Y US Treasury chart, as anticipated. If we consider that 10Y US Notes chart is now turning back to bullish mode, then DXY could easily see more weakness at least towards the open/unfilled GAP at 97.74 area.
XAGUSD – 4H OutlookBias: Short-term corrective move after hitting major supply zone.
XAGUSD just tapped a strong 4H supply zone around 62.70 – 63.00, and price immediately rejected with a clear wick. This confirms sellers are active at this level.
Structure-wise, silver has been moving in a parabolic impulse, and now the chart is showing the first signs of exhaustion. If the rejection holds, market likely forms a lower high before shifting into a deeper correction.
Key Levels
62.70–63.00 (Supply Zone – Strong Rejection)
61.98 (First support / retest area)
60.62 (Major 4H structure support)
59.31 (Bigger correction target)
What I Expect Next
Price retests the supply zone → forms a lower high
Pullback continuation toward 61.98
Break below opens the door to 60.62
Full correction target sits near 59.30
Momentum indicators also show bearish divergence + Stoch RSI cooling off, supporting a temporary downturn before any bigger trend continuation.
Summary
XAGUSD likely enters a short-term correction phase after rejecting a key supply area. I expect price to form a lower high and continue down toward the 60–59 zone unless buyers reclaim and hold above 63.

Look for REJECTION with AUDUSDAUD/USD Daily Analysis
Pair: Australian Dollar / U.S. Dollar (AUD/USD)
Timeframe: 1 Day (1D)
Data Source: FXCM
Key Levels:
Open: 0.66406
High: 0.66859
Low: 0.66288
Close: 0.66763
Change: +0.00357 (+0.54%)
Analysis:
The AUD/USD closed higher today, up 0.54% to 0.66763. The pair demonstrated a bullish momentum, with price action climbing from a low of 0.66288 to a session high of 0.66859. This uptick could signal renewed buying interest in the pair, with the daily close above the opening suggesting a positive sentiment among traders.
What to Watch:
Resistance may be found near the recent high at 0.66859. A break above this level could push the AUD/USD towards further gains.
Support is situated near 0.66288. If the price reverses, this may be a key area to watch for a bounce.
Outlook:
Traders should look for confirmation of continuation or a reversal near today's high and low. Keep an eye on macroeconomic developments and U.S. dollar trends for further directional clues.
Disclaimer: This analysis is for informational purposes only and is not financial advice.

USD/CAD: Will the Great Divergence Break the Greenback?The financial world stands on the precipice of a defining moment for North American currency markets. The USD/CAD pair hovers near 1.3855, ticking nervously as traders count down to a rare double-header of central bank decisions. December 10, 2025, marks a pivotal divergence point where economic pathways between the United States and Canada split sharply. This is not merely a technical adjustment; it is a fundamental collision of monetary policy, geopolitical strategy, and industrial resilience. The outcome will likely dictate the Loonie’s trajectory for the coming year.
Macroeconomics: A Tale of Two Trajectories
The macroeconomic landscape reveals a stark contrast between the two nations. The Federal Reserve prepares to slash interest rates for the third consecutive time, targeting a range of 3.50%-3.75%. Markets price this move at nearly 88% probability. The US labor market displays clear signs of cooling, necessitating easier financing conditions to prevent a recession. Conversely, the Bank of Canada (BoC) stands firm. Canada’s economy defied expectations with a robust 2.6% annualized GDP growth in Q3, crushing earlier forecasts. This resilience compels the BoC to hold rates at 2.25% to prevent reigniting inflation, which remains sticky at 2.2%.
Geostrategy: The Fertilizer Chess Game
Beyond interest rates, a high-stakes geopolitical trade war complicates currency valuation. The US administration’s threat of severe tariffs on Canadian fertilizer imports paradoxically jeopardizes US food security. American farmers rely heavily on Canadian potash, importing over half of Canada’s production. Tariffs here act as a double-edged sword: they aim to punish Canada but simultaneously drive up input costs for the US agricultural sector. This strategic misstep weakens the US Dollar’s purchasing power domestically while forcing the administration to print subsidies, further diluting the currency.
Industry Trends: Agriculture Under Siege
The agricultural industry sits at the epicenter of this financial storm. The promise of $12 billion in aid to US farmers highlights the structural damage already inflicted by trade barriers. This subsidy model creates a vicious cycle of dependency rather than innovation. While Canadian fertilizer producers face tariff headwinds, their product remains essential, granting them significant pricing power. US farmers face a "margin squeeze" that ripples through the broader economy, softening the US economic outlook and diminishing the appeal of the Greenback relative to the resource-backed Loonie.
Management & Leadership: Powell vs. Macklem
Leadership styles at the central banks further amplify market volatility. Fed Chair Jerome Powell operates under intense political pressure and conflicting data, forcing a reactionary "data-dependent" approach. His leadership currently signals caution and retreat. In contrast, BoC Governor Tiff Macklem displays a steady hand, anchoring policy to tangible growth metrics like the recent 180.6K job surge. This stability in Canadian monetary leadership attracts foreign capital seeking predictable returns, creating a natural demand for the Canadian Dollar over the politically volatile USD.
Business Models: Supply Chain Resilience
The trade dispute forces companies to rethink business models. Canadian exporters are diversifying markets beyond the US, strengthening long-term resilience. Meanwhile, US importers face a supply chain crisis, unable to quickly source alternative fertilizer at competitive rates. This rigidity in the US supply chain exposes a critical weakness in the American business model for agriculture. Investors recognize this structural flaw, leading to capital flows that favor the adaptability of the Canadian export sector, thereby supporting the CAD against the USD.
Conclusion: The Loonie’s Rebellion
The confluence of diverging interest rates and self-inflicted US trade wounds creates a perfect storm for USD/CAD bears. The Federal Reserve’s dovish pivot contrasts sharply with the Bank of Canada’s confident hold, widening the yield spread in favor of Canadian assets. Combined with the strategic failure of fertilizer tariffs, fundamental drivers point toward a weaker US Dollar. Traders must watch the 1.3850 level closely; a break below likely signals the start of a prolonged downtrend for the pair. The divergence is real, and the Loonie is ready to rebel.

USDJPY FRGNT DAILY FORECAST - Q4 | W50 | D9 | Y25 |📅 Q4 | W50 | D9 | Y25 |
📊 USDJPY FRGNT DAILY FORECAST
🔍 Analysis Approach:
I’m applying Smart Money Concepts, focusing on:
Identifying Points of Interest on the Higher Time Frames (HTFs) 🕰️
Using those POIs to define a clear trading range 📐
Refining those zones on Lower Time Frames (LTFs) 🔎
Waiting for a Break of Structure (BoS) for confirmation ✅
This method allows me to stay precise, disciplined, and aligned with the market narrative, rather than chasing price.
💡 My Motto:
"Capital management, discipline, and consistency in your trading edge."
A positive risk-to-reward ratio, paired with a high win rate, is the backbone of any solid trading plan 📈🔐
⚠️ Losses?
They’re part of the mathematical game of trading 🎲
They don’t define you — they’re necessary, they happen, and we move forward 📊➡️
🙏 I appreciate you taking the time to review my Daily Forecast.
Stay sharp, stay consistent, and protect your capital
— FRNGT 🚀
FX:USDJPY
FX:USDJPY

USD/JPY - Interest Rate Ahead! (08.12.2025) 📝 Description FX:USDJPY
USD/JPY continues to respect the Bearish Channel Pattern, with price rejecting the upper boundary and failing to break the resistance zone. Combined with strong fundamentals—expected Fed rate cut and potential BoJ tightening—the setup favors downside movement.
A break and retest of intraday support confirms continuation toward lower channel targets.
📌 Trading Plan📉 Bearish Continuation
Entry Idea: Look for sells below 155.00 after confirmation
Target 1: 154.28 (1st Support)
Target 2: 153.94 (2nd Support / Channel Bottom)
Bearish Confirmation: Clean rejection from resistance zone + break below small retracement support
⚠️ Fundamental Updates (Today)
1️⃣ Federal Reserve Meeting
→ Markets widely expect a rate cut, weakening the USD.
2️⃣ Bank of Japan Rate Outlook
→ BoJ may increase interest rates, a JPY-strengthening factor.
Combined effect:
🔻 USD weak + 🔺 JPY strong → Bearish USD/JPY bias
⚠️ Disclaimer
This idea is for educational analysis only.
Not financial advice. Always trade with proper risk management.
👍 Support the Analysis❤️ LIKE the post💬 COMMENT your view🔁 SHARE to help others
Your support motivates more high-quality analysis! 🙌
#USDJPY #ForexTrading #BearishSetup #ChannelPattern #TechnicalAnalysis #FundamentalAnalysis #JPY #USD #FXMarket #TradingView #PriceAction #Kabhi_TA_Trading

GBPUSD Bullish Setup: Waiting for the Perfect PullbackGBPUSD has broken above the daily resistance and has established a clear uptrend on the 1-hour timeframe. The market structure is currently bullish, supported by a clean upward trendline.
On the 1H chart, price has created a Fair Value Gap (FVG) and is now expected to make a pullback after forming a swing high. The ideal retracement zone is around the 50%–61.8% Fibonacci levels, which aligns perfectly with:
- A strong support level
- The 1H FVG zone
- The Fibonacci retracement levels
- The uptrend trendline
This area forms a high-probability confluence zone for a potential long entry.
Once price reaches this zone, we must wait for a 5-minute Change of Character (CHOCH) to the upside.
If the market prints a clear bullish CHOCH with a strong candlestick confirmation, a long position may be justified.
However, if the price reaches the trendline and breaks below it without giving a bullish CHOCH on 5M, the setup becomes invalid and no long trade should be taken.

EURUSD Channel Up starting its new Bearish Leg.The EURUSD pair has been trading within a 1-month Channel Up and has already completed two straight red 1D candles. Last time this happened, the pattern had technically started its previous Bearish Leg.
Since there is a high degree of symmetry between the structural Legs of this pattern, we expect the current one to repeat the former -1.40% decline and target 1.15250.
---
** Please LIKE 👍, FOLLOW ✅, SHARE 🙌 and COMMENT ✍ if you enjoy this idea! Also share your ideas and charts in the comments section below! This is best way to keep it relevant, support us, keep the content here free and allow the idea to reach as many people as possible. **
---
💸💸💸💸💸💸
👇 👇 👇 👇 👇 👇

WEEKLY WARMAP: DOLLAR MARKETThe week begins with a balanced dollar, firm U.S. yields, and suppressed volatility.
DXY remains inside its 97.672–99.985 range, reflecting equilibrium rather than trend.
No directional signal is valid until structure breaks.
Short-end yields moved ~2.8% higher last week and extended another ~0.76% into Monday’s session.
The 10-year yield advanced ~2.88% last week with further upside today.
The curve is repricing risk while volatility remains suppressed following a ~16.6% decline.
This week’s macro catalysts:
FOMC decision + Powell press conference
JOLTS labor demand data
PPI
Weekly jobless claims
Federal budget and projections
All influence: credibility, yield expectations, liquidity conditions.
Cross-asset behavior remains neutral.
ES stays inside its 6540.25–6953.75 bracket — strong order flow but extended location near the monthly upper boundary and roughly +2 deviations above the mean.
Gold remains inside its 3996.2–4380.7 weekly range.
Key DXY levels:
98.175 — downside liquidity
98.917 — upside structural trigger
Inside this band = non-directional behavior.
Outside = actionable change.
The overall environment reflects structural tension, not directional conviction.
TECHNICAL CONTEXT (CORE5 STRUCTURE)
DXY trades only 0.11% from monthly balance, creating conditions for algorithmic defense at key price boundaries.
The current question:
rotation or continuation?
Price remains inside its daily range (97.672–99.985).
Structure is balanced, but location matters:
DXY sits within the dynamic discount zone on the DGM model
This typically supports accumulation
But there is a bullish volume cap beneath price — an unfinished orderflow pocket resembling a bookkeeping discrepancy
This imbalance often requires a downward corrective spike before any sustained upward movement.
If bearish flow develops:
Liquidity sits cleanly below 98.175 and may be targeted before stabilization.
If bullish flow emerges:
A daily close above 98.917 is required to confirm shift.
Anything below this level is intra-range noise.
Current read:
Structure: balanced
Geometry: supportive zone
Volume: incomplete
Order flow: neutral, awaiting data
Execution: conditional environment, not trend environment
This week’s direction depends on how DXY responds to the incoming data sequence.
WEEKLY TAKEAWAY
Two levels govern the week:
98.175 → downside liquidity
98.917 → upside structural trigger
Inside the band: neutral.
Outside the band: decisive.
— CORE5DAN
Institutional Logic. Modern Technology. Real Freedom.

GBPUSD POSSIBLE SELL & BUY SETUP✅ BUY Scenario (Bullish)
Bias: Bullish as long as price stays above the demand zone at 1.32150–1.32124.
✔️ Conditions for a Buy
Price pulls down into the green demand zone
We see a reaction or CHoCH on lower timeframes
Price begins to push upward from demand
✔️ Long Entry
Inside 1.32150–1.32124
(This is your best discounted “buy” area)
✔️ Stop-Loss
Below 1.31770 (the liquidity sweep low)
✔️ Take Profit
The red supply zones above:
First target: 1.33500
Main target: 1.34775
✔️ Simple Logic
Demand → Sweep → Shift → Buy pullback → Target supply.
✅ SELL Scenario (Bearish)
Bias: Bearish only if price breaks below demand and fails to rebound.
✔️ Conditions for a Sell
Price breaks below 1.31770
Retests that level as new supply
Fails to reclaim demand (lower highs form)
✔️ Short Entry
After a pullback into the broken demand turned supply
(A retest of 1.32124–1.32150 from the underside)
✔️ Stop-Loss
Above the retest wick
✔️ Take Profit
Lower liquidity zones around:
1.31000
1.30500 (major downside target)
✔️ Simple Logic
Breakdown → Retest → Sell → Target lower liquidity.
🎯 Clean Summary
BUY:
Wait for price to dip into 1.32150–1.32124 → Look for reaction → Buy → Target 1.34775.
SELL:
Wait for price to break below 1.31770 → Retest → Sell → Target 1.30500.

Forex: Weekly Review Overall sentiment has been positive ever since the market jumped on 'relatively dovish' comments from FED member WILLIAMS. And the positivity remained throughout the week starting Monday 1 December, backed up by another string of 'softish' US data and the (likely) incoming appointment of HASSETT to replace FED chair POWELL. (The theory being Hassett will push a dovish agenda).
The potential spanners in the works could be the upcoming FOMC meeting, is the market over exuberant expecting a rate cut? Will chair POWELL have one more hawkish twist in him?. And although subsided for now, AI bubble concerns still simmer in the background.
For now, I'll begin the new week looking for 'risk on' trades, the risk to any trade could be 'lackluster movement' ahead of Wednesday's decision.
The week didn't pass without the odd hiccup, namely negative UKRAINE war comments keeping geopolitical concerns on the markets mind. And 'hawkish' BOJ comments combined with president TAKACHI walking back some stimulus comments (in an attempt the calm the Japanese bond market) gave the JPY bouts of strength. I reiterate that the sooner the BOJ hike and declare the end of the hiking cycle, the better, we will likely get bouts of choppy JPY movement until then.
Following on from the previous week's positive CAD data, Friday's 'hot' Canadian jobs data keeps sentiment for the CAD bouyed, as ever, the risk to any CAD long trades would be its penchant for tracking the USD and oil.
On a personal note, it was a week of two trades, CAD JPY long which stopped out very quickly, aside from 'only' using a 15min stop loss, I could only surmise sentiment took a brief hit from Putin's negative comments. Wednesday's NZD USD long took an age and was eventually closed for a small profit, the fact I was still in the trade during Fridays 'hot' CAD data meant I had to sit that one out. Missing out on a trade due to already being in one does occasionally happen and is just something we have to accept.
I being the new week with a tentative 'risk on bias'. But with four central bank decisions, it could be a week of twists and turns ahead.

EUR/USD Still Struggling to Trend but Bulls Take Step ForwardThat 1.1500 level in EUR/USD has proven to be a tough spot to crack and the higher-low from two weeks ago has now pushed into a higher-high.
But with that said, buyers seemingly refused to drive this week even with a higher-high to go along with that higher-low, and this sets the stage for next week's FOMC meeting as a breakdown in the USD will likely need EUR/USD bulls to make a push.
For next week, it's the 1.1593 level that looms large in EUR/USD and if that level gives way, it's going to look like a failed breakout and it'll expose the 1.1500 level for another re-test.
For USD-weakness, GBP/USD has shown more attractive bullish structure and for USD-strength, USD/JPY makes for a stronger argument, at least until some semblance of trend shows itself in EUR/USD. - js

Trade closed manually It was a slow burner and almost hit the profit target but I've eventually closed my NZD USD trade for a small +0.7 profit (to avoid weekend risk).
All in all, the positive narrative remains, meaning until something changes, I'll continue looking for 'risk on trades' short USD, JPY (BOJ rate hike chatter being a risk) and also, short CHF appears viable again. (It's now all eyes on next week's fed meeting).
Side note that positive data boosted the CAD today and would have made a nice trade for anyone at the charts at the time and not already in a trade.
Wishing you a lovely weekend

GBPUSD on a multi-year decline that's far from being over.The GBPUSD pair is currently on a 5-week rebound following the November 03 Low just below its 1W MA50 (blue trend-line). Despite this short-term reaction, the general long-term trend remains bearish following the June 30 2025 High.
That High started a Double Top sequence that is similar to both previous Cycle Tops since January 22 2018. Even though this latest one didn't take place exactly on the Lower Highs trend-line, it was priced on the closest level to the 1M MA200 (red trend-line) since September 2014.
At the same time, the 1W RSI printed the exact same 8-year Resistance Zone rejection pattern as the previous 4 times. Based on the previous 2 Cycles, we expect the 1st Leg of this long-term correction to approach the 1W MA200 (orange trend-line) on a -7.64% (minimum) drop, targeting 1.2750. Then after a bounce to retest and get rejected on the 1W MA50, we expect it to aim then 9-year Symmetrical Support Zone at 1.2100.
---
** Please LIKE 👍, FOLLOW ✅, SHARE 🙌 and COMMENT ✍ if you enjoy this idea! Also share your ideas and charts in the comments section below! This is best way to keep it relevant, support us, keep the content here free and allow the idea to reach as many people as possible. **
---
💸💸💸💸💸💸
👇 👇 👇 👇 👇 👇

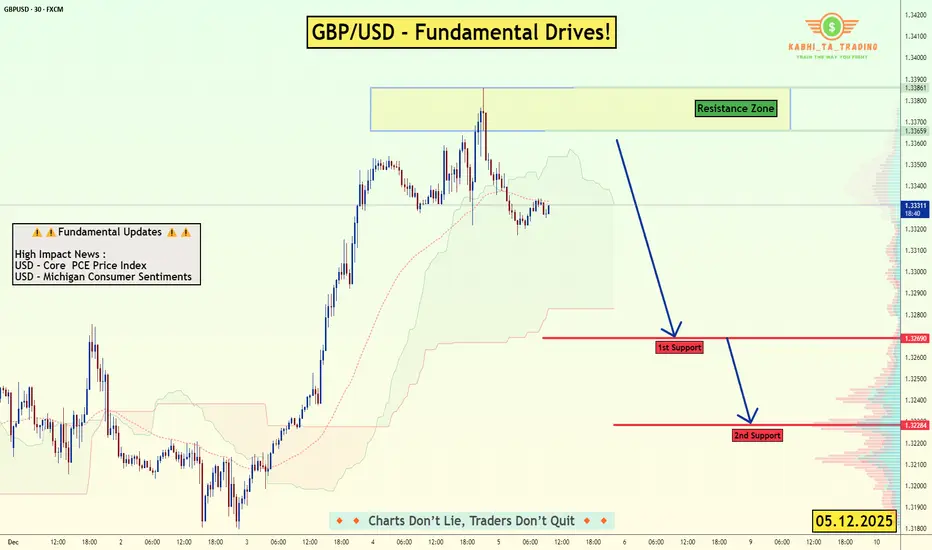
GBP/USD – Fundamentals Drive the Move! (05.12.2025)📝 Description FX:GBPUSD
GBP/USD is currently trading below the resistance zone after failing to hold recent bullish momentum. With USD Core PCE Price Index and Michigan Consumer Sentiment releasing today, the pair may see increased volatility, potentially pushing the price lower if USD strengthens.
A rejection from the resistance zone combined with weakening intraday structure suggests a possible bearish continuation toward support levels.
📌 Key Support & Resistance Levels
🔺 Resistance Zone: 1.3359 – 1.3386
🟥 1st Support: 1.3269
🟥 2nd Support: 1.3228
⚠️ Fundamentals Today
1️⃣ USD – Core PCE Price Index (High Impact)
2️⃣ USD – Michigan Consumer Sentiment (High Impact)
#GBPUSD #ForexAnalysis #PriceAction #Fundamentals #USDNews #TechnicalAnalysis #TradingPlan #ChartAnalysis #FXTrading #TradingView #Kabhi_TA_Trading
⚠️ Disclaimer
This chart is for educational purposes only, not financial advice.
Always use stop-loss and manage position size according to your risk tolerance.
👍 Support the Analysis❤️ Please LIKE💬 Drop a COMMENT
🔁 SHARE if you found this helpful!