US Dollar: Bullish! Look For Buys Opportunities!Welcome back to the Weekly Forex Forecast for the week of Jan 19-24th.
In this video, we will analyze the following FX market: USD Dollar
The USD is showing some strength, with a strong bullish close to the W candle. I am looking for continuation of that momentum going into next week.
Mindful that there may be a short term pullback before the next push higher. Be patient for the market to confirm directional bias before looking for entries.
Enjoy!
May profits be upon you.
Leave any questions or comments in the comment section.
I appreciate any feedback from my viewers!
Disclaimer:
I do not provide personal investment advice and I am not a qualified licensed investment advisor.
All information found here, including any ideas, opinions, views, predictions, forecasts, commentaries, suggestions, expressed or implied herein, are for informational, entertainment or educational purposes only and should not be construed as personal investment advice. While the information provided is believed to be accurate, it may include errors or inaccuracies.
I will not and cannot be held liable for any actions you take as a result of anything you read here.
Conduct your own due diligence, or consult a licensed financial advisor or broker before making any and all investment decisions. Any investments, trades, speculations, or decisions made on the basis of any information found on this channel, expressed or implied herein, are committed at your own risk, financial or otherwise.
Usdollaranalysis

US Dollar: Potentially Higher Prices In The Near TermWelcome back to the Weekly Forex Forecast for the week of Dec 22 - 26th.
In this video, we will analyze the following FX market: USD Dollar
The USD closed bullish last week. I expected price to move a bit higher in the near term.
towards the bearish OB, and into a -FVG. When the pullback indicates it is ending, that would be a good time to look for valid sells.
The move higher should happen between now and Tuesday. Short term .
Enjoy!
May profits be upon you.
Leave any questions or comments in the comment section.
I appreciate any feedback from my viewers!
Disclaimer:
I do not provide personal investment advice and I am not a qualified licensed investment advisor.
All information found here, including any ideas, opinions, views, predictions, forecasts, commentaries, suggestions, expressed or implied herein, are for informational, entertainment or educational purposes only and should not be construed as personal investment advice. While the information provided is believed to be accurate, it may include errors or inaccuracies.
I will not and cannot be held liable for any actions you take as a result of anything you read here.
Conduct your own due diligence, or consult a licensed financial advisor or broker before making any and all investment decisions. Any investments, trades, speculations, or decisions made on the basis of any information found on this channel, expressed or implied herein, are committed at your own risk, financial or otherwise.

US Dollar: Wait For The Breakout!Welcome back to the Weekly Forex Forecast for the week of Dec 1 - 5th.
In this video, we will analyze the following FX market: USD Dollar
The USD is bearish-neutral. It had a bearish close to last week, but did not close below the low of the previous week. This could indicate more consolidation coming.
Wait for price to trade above or below Friday's candle, and let that be your guide for the week.
Enjoy!
May profits be upon you.
Leave any questions or comments in the comment section.
I appreciate any feedback from my viewers!
Disclaimer:
I do not provide personal investment advice and I am not a qualified licensed investment advisor.
All information found here, including any ideas, opinions, views, predictions, forecasts, commentaries, suggestions, expressed or implied herein, are for informational, entertainment or educational purposes only and should not be construed as personal investment advice. While the information provided is believed to be accurate, it may include errors or inaccuracies.
I will not and cannot be held liable for any actions you take as a result of anything you read here.
Conduct your own due diligence, or consult a licensed financial advisor or broker before making any and all investment decisions. Any investments, trades, speculations, or decisions made on the basis of any information found on this channel, expressed or implied herein, are committed at your own risk, financial or otherwise.

US Dollar: Buy The Rally!Welcome back to the Weekly Forex Forecast for the week of Nov. 10-14th
In this video, we will analyze the following FX market: USD Dollar
The USD is in a pullback... that I believe is ending. Buying is the best bet! Once price gives the signature of a market shift from bearish to bullish, buys are valid!
Enjoy!
May profits be upon you.
Leave any questions or comments in the comment section.
I appreciate any feedback from my viewers!
Disclaimer:
I do not provide personal investment advice and I am not a qualified licensed investment advisor.
All information found here, including any ideas, opinions, views, predictions, forecasts, commentaries, suggestions, expressed or implied herein, are for informational, entertainment or educational purposes only and should not be construed as personal investment advice. While the information provided is believed to be accurate, it may include errors or inaccuracies.
I will not and cannot be held liable for any actions you take as a result of anything you read here.
Conduct your own due diligence, or consult a licensed financial advisor or broker before making any and all investment decisions. Any investments, trades, speculations, or decisions made on the basis of any information found on this channel, expressed or implied herein, are committed at your own risk, financial or otherwise.

US Dollar: Bullish-Neutral. Buys Are Valid As +FVG Holds!Welcome back to the Weekly Forex Forecast for the week of Oct 27 - 31st.
In this video, we will analyze the following FX market: USD Dollar
The USD didn't move a lot last week, but it did move higher with Monday and Tuesday moves. The rest of the week was sideways, but it held above the +FVG. As long as the +FVG holds, prices should continue higher.
A candle body close below the +FVG will be a bearish indication.
Mindful that FOMC is Wednesday. That is decision day for the markets. Don't jump into long term moves until after the announcements for Wednesday.
Enjoy!
May profits be upon you.
Leave any questions or comments in the comment section.
I appreciate any feedback from my viewers!
Disclaimer:
I do not provide personal investment advice and I am not a qualified licensed investment advisor.
All information found here, including any ideas, opinions, views, predictions, forecasts, commentaries, suggestions, expressed or implied herein, are for informational, entertainment or educational purposes only and should not be construed as personal investment advice. While the information provided is believed to be accurate, it may include errors or inaccuracies.
I will not and cannot be held liable for any actions you take as a result of anything you read here.
Conduct your own due diligence, or consult a licensed financial advisor or broker before making any and all investment decisions. Any investments, trades, speculations, or decisions made on the basis of any information found on this channel, expressed or implied herein, are committed at your own risk, financial or otherwise.

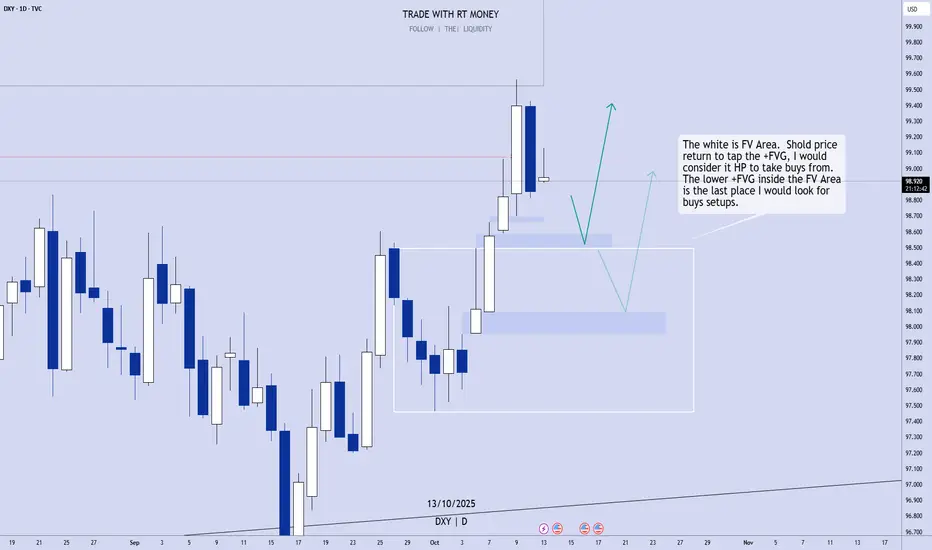
US Dollar: Still Bullish. Wait For Buy Setups!Friday's candle notwithstanding, the USD is strong, and still bullish. Taking sells into the bullish Fair Value Area is not a good option. Looking for buys at the _FVGs is!
Enjoy!
May profits be upon you.
Disclaimer:
I do not provide personal investment advice and I am not a qualified licensed investment advisor.
All information found here, including any ideas, opinions, views, predictions, forecasts, commentaries, suggestions, expressed or implied herein, are for informational, entertainment or educational purposes only and should not be construed as personal investment advice. While the information provided is believed to be accurate, it may include errors or inaccuracies.
I will not and cannot be held liable for any actions you take as a result of anything you read here.
Conduct your own due diligence, or consult a licensed financial advisor or broker before making any and all investment decisions. Any investments, trades, speculations, or decisions made on the basis of any information found on this channel, expressed or implied herein, are committed at your own risk, financial or otherwise.
US Dollar: Hold Off On Selling The USD! Higher Prices Ahead?Welcome back to the Weekly Forex Forecast for the week of Sept 22 - 26th.
In this video, we will analyze the following FX market: USD Dollar
The USD recovered last Friday after the FED cut the rate .25 basis points. The USD was also supported by higher T-note yields.
What's next?
Although price swept the Swing Low last week, it recovered, trading back up into the consolidation. There is a bullish tone to this movement, and a manipulative one as well. The sell side LQ was taken, followed by a quick recovery.
The highlighted bullish FVG indicates bullish order flow.
There is a potential iFVG just above the +FVG. Monitor it to see if price will respect it as support. Should it hold, look to long the USD.
Wait and react. Do not predict.
Enjoy!
May profits be upon you.
Leave any questions or comments in the comment section.
I appreciate any feedback from my viewers!
Disclaimer:
I do not provide personal investment advice and I am not a qualified licensed investment advisor.
All information found here, including any ideas, opinions, views, predictions, forecasts, commentaries, suggestions, expressed or implied herein, are for informational, entertainment or educational purposes only and should not be construed as personal investment advice. While the information provided is believed to be accurate, it may include errors or inaccuracies.
I will not and cannot be held liable for any actions you take as a result of anything you read here.
Conduct your own due diligence, or consult a licensed financial advisor or broker before making any and all investment decisions. Any investments, trades, speculations, or decisions made on the basis of any information found on this channel, expressed or implied herein, are committed at your own risk, financial or otherwise.

US Dollar Index (DXY) Rises Ahead of Fed Chair’s SpeechUS Dollar Index (DXY) Rises Ahead of Fed Chair’s Speech
On Monday, we:
→ noted that the US Dollar Index (DXY) was consolidating at the start of a week packed with key events;
→ outlined a descending channel (shown in red);
→ highlighted that the price was trading around the channel’s median line, signalling a balanced market;
→ suggested that a test of one of the quarter lines (QL or QH), which divide the channel into four parts, could take place.
As the DXY chart indicates, since then the balance has shifted in favour of buyers, with the price forming an upward trajectory (shown in purple lines) and breaking through short-term resistance R (which has now turned into support, as marked by the blue arrow). Support line S remains relevant.
Today brings the key event that may have the greatest impact on the US Dollar Index (DXY) this week – Jerome Powell’s speech at the annual Jackson Hole Symposium.
This appearance is particularly significant because:
→ it is likely to be Powell’s last speech after seven years as Fed Chair, with his term expiring in May amid ongoing tensions with President Trump;
→ market participants will closely monitor the tone of his remarks, as a rate cut is expected in September, while recent economic data – namely the rise in the Producer Price Index – suggest that the US economy could face renewed inflationary pressures due to Trump’s tariffs.
Technical analysis of the DXY chart
From a bullish perspective, in the short term the US dollar is advancing within the purple channel, supported by:
→ the lower boundary of this channel;
→ the demand imbalance zone in favour of buyers (shown in green), confirmed by yesterday’s sharp bullish candle.
From a bearish perspective:
→ the RSI has entered overbought territory;
→ bullish momentum may fade after a breakout above the QH line;
→ a key resistance at the 99 level lies nearby – a level that reclaimed its role as resistance at the beginning of August (indicated by black arrows).
A corrective pullback in the US Dollar Index (DXY) could happen after its rally to the highest level since 6 August. However, the further trajectory will largely depend on Powell’s words this evening. According to Forex Factory, the speech is scheduled for 17:00 GMT+3.
This article represents the opinion of the Companies operating under the FXOpen brand only. It is not to be construed as an offer, solicitation, or recommendation with respect to products and services provided by the Companies operating under the FXOpen brand, nor is it to be considered financial advice.

US Dollar: Bullish For The Near Term?Welcome back to the Weekly Forex Forecast for the week of Aug 11 - 15th.
In this video, we will analyze the following FX market:
USD Index
The US Dollar has been weakened by bad employment numbers, the expectation for interest rate cuts in the next FED meeting, and inflation sneaking higher. CPI Data is coming Tuesday, and a soft number will add to selling pressure.
However, price is at levels where a the bearish retracement could end, and the higher low could be established.
React and do not predict.
Enjoy!
May profits be upon you.
Leave any questions or comments in the comment section.
I appreciate any feedback from my viewers!
Disclaimer:
I do not provide personal investment advice and I am not a qualified licensed investment advisor.
All information found here, including any ideas, opinions, views, predictions, forecasts, commentaries, suggestions, expressed or implied herein, are for informational, entertainment or educational purposes only and should not be construed as personal investment advice. While the information provided is believed to be accurate, it may include errors or inaccuracies.
I will not and cannot be held liable for any actions you take as a result of anything you read here.
Conduct your own due diligence, or consult a licensed financial advisor or broker before making any and all investment decisions. Any investments, trades, speculations, or decisions made on the basis of any information found on this channel, expressed or implied herein, are committed at your own risk, financial or otherwise.

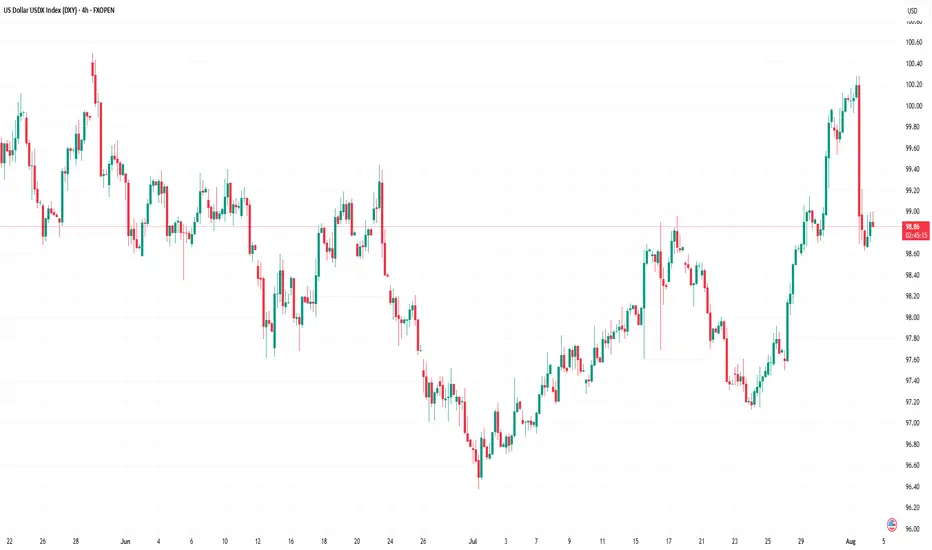
US Dollar Index (DXY) Plummets Following Labour Market DataUS Dollar Index (DXY) Plummets Following Labour Market Data
The US Dollar Index (DXY) fell by approximately 1.4% on Friday after the release of disappointing US labour market figures. According to Forex Factory:
→ The unemployment rate rose from 4.1% to 4.2%;
→ The Nonfarm Employment Change figure came in at 73K, well below the forecast of 103K. This is the lowest level of job creation in the nonfarm sector in 2025 and is roughly half the previous month’s reading (prior to revisions).
→ Furthermore, revisions for May and June were significantly more severe than usual. The May figure was revised downward by 125,000 — from +144,000 to +19,000. Similarly, the June figure was revised down by 133,000 — from +147,000 to +14,000.
These results point to a weakening labour market, which increases the likelihood of a rate cut aimed at supporting economic growth. In turn, expectations of a Fed rate cut are acting as a bearish driver for the US dollar.
Technical Analysis of the DXY Chart
Six days ago, we highlighted two U-shaped trajectories (A and B), which together formed a bullish сup and рandle pattern on the US Dollar Index chart.
Following this, price action generated a notable upward impulse (as indicated by the arrow), breaking through the upper boundary of the pattern.
However, Friday’s news triggered the following developments:
→ A new top (4) was formed on the chart, accompanied by a false bullish breakout above the psychological level of 100.00;
→ The price declined to the 98.80 area. The downward move slowed here, as this zone had previously seen strong bullish activity during the breakout from the pattern’s upper boundary — likely explaining why the market is finding support here on Monday morning.
Overall, the technical picture has shifted towards a bearish outlook. Friday’s peak continues the summer sequence of lower highs and lows: 1 → 2 → bottom of pattern (A) → 4. This structure is part of a broader downtrend that has defined the market in 2025.
Should bearish sentiment persist, fuelled by Friday’s data, we can assume a further decline in the US Dollar Index towards the median line of the descending channel (shown in red), which has been drawn through the aforementioned price extremes.
This article represents the opinion of the Companies operating under the FXOpen brand only. It is not to be construed as an offer, solicitation, or recommendation with respect to products and services provided by the Companies operating under the FXOpen brand, nor is it to be considered financial advice.
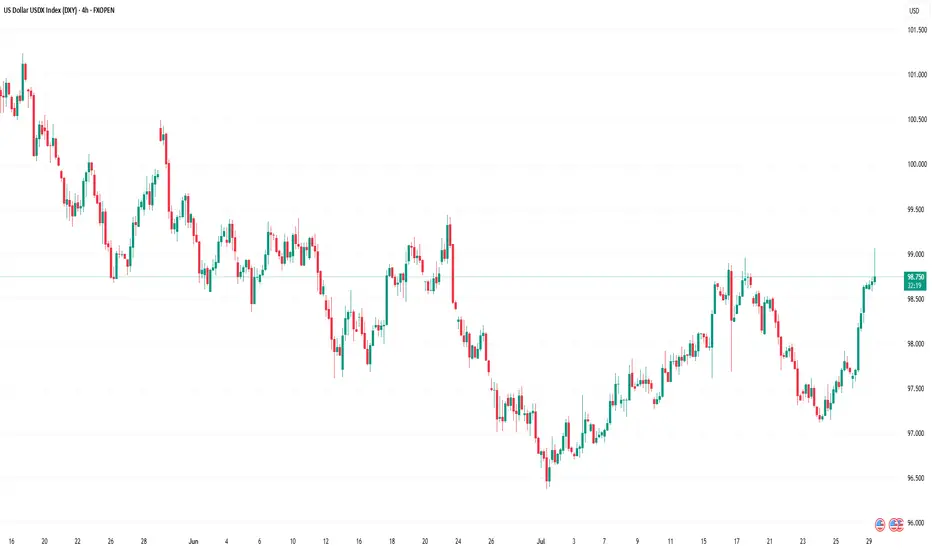
US Dollar Index (DXY) Reaches One-Month HighUS Dollar Index (DXY) Reaches One-Month High
The US Dollar Index (DXY) has risen to its highest level since early July. According to media reports, the bullish sentiment in the market is driven by the following factors:
→ Optimism around US trade agreements. A new trade deal with the EU — which includes a 15% tariff on European goods — is being perceived by the market as favourable for the United States.
→ Confidence in the resilience of the US economy. Strong Q2 corporate earnings have acted as an additional bullish catalyst. Investors may have started covering short positions against the dollar, viewing concerns over a US slowdown as overstated.
→ Expectations that the Federal Reserve will keep interest rates on hold.
From a technical standpoint, today’s DXY chart reflects strengthening bullish momentum.
Technical Analysis of the DXY Chart
Two U-shaped formations (A and B) that developed over the summer have created a bullish сup and рandle pattern — a formation that suggests waning bearish pressure, as evidenced by the shallower second dip.
This setup points to the potential for a bullish breakout above the trendline (marked in red) that has defined the downward movement in the DXY throughout the first half of 2025.
As previously analysed, there are signs that the dollar index may have found a base following a period of decline. This could indicate a shift in market sentiment and the possible end of the recent bearish phase.
This article represents the opinion of the Companies operating under the FXOpen brand only. It is not to be construed as an offer, solicitation, or recommendation with respect to products and services provided by the Companies operating under the FXOpen brand, nor is it to be considered financial advice.
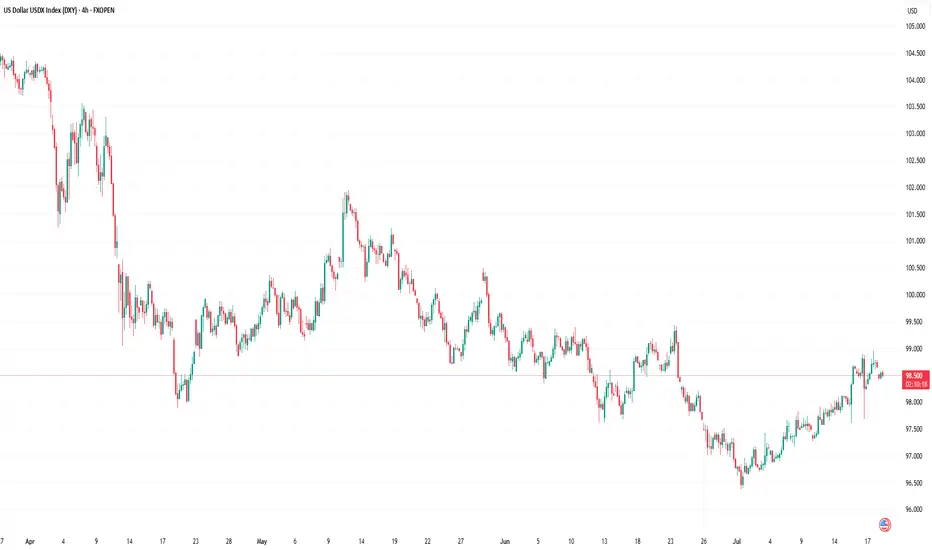
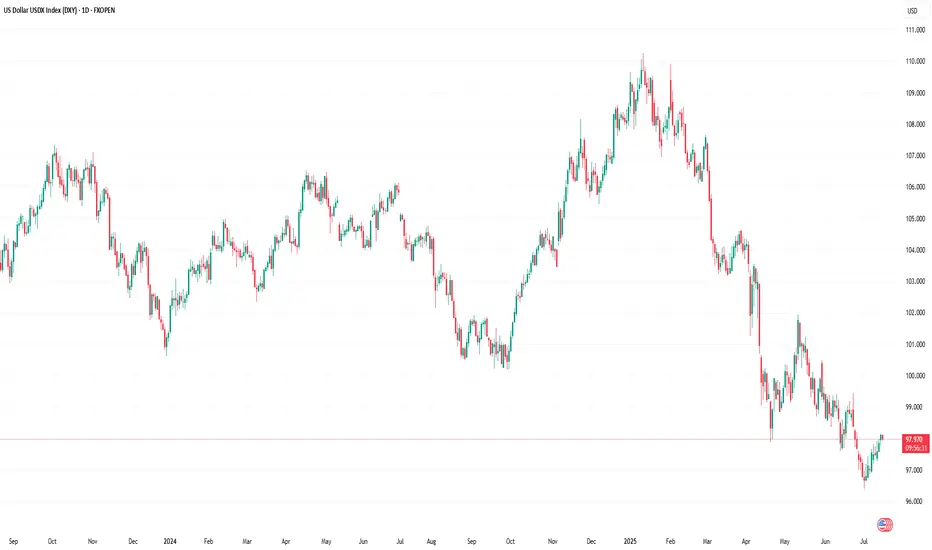
US Dollar Index (DXY) Chart AnalysisUS Dollar Index (DXY) Chart Analysis
The addition of the US Dollar Index (DXY) to FXOpen’s suite of instruments offers traders potential opportunities. This financial instrument:
→ serves as a measure of the overall strength of the US dollar;
→ is not tied to a single currency pair but reflects the value of the USD against a basket of six major global currencies, including the EUR, JPY, and GBP;
→ allows traders to capitalise on price fluctuations in the currency market;
→ is used in more advanced strategies for hedging risks in portfolios sensitive to sharp movements in the US dollar.
In today’s environment of heightened volatility, this instrument becomes particularly valuable. The active stance of US President Donald Trump — through the implementation of trade tariffs, sanctions, and unpredictable geopolitical rhetoric — gives traders even more reason to closely monitor the DXY chart.
Technical Analysis of the DXY Chart
Moving averages show that the US Dollar Index displayed a predominantly bearish trend during the first half of 2025.
However, the picture shifted in July: the index began rising steadily (already up approximately +1.9% since the beginning of the month), highlighted by the blue ascending trend channel.
This suggests that the DXY may have found support following a prolonged decline, and a shift in market sentiment could be underway: after a bearish phase, a period of consolidation may follow. If this scenario plays out, we could see DXY oscillating between the 97.65 and 99.30 levels – both of which show signs of acting as support and resistance (as indicated by the arrows).
This article represents the opinion of the Companies operating under the FXOpen brand only. It is not to be construed as an offer, solicitation, or recommendation with respect to products and services provided by the Companies operating under the FXOpen brand, nor is it to be considered financial advice.
A Closer Look at the Role and Recent Volatility of the (DXY)A Closer Look at the Role and Recent Volatility of the US Dollar Index (DXY)
We don’t even need to say that the US Dollar Index (DXY) is one of the most influential benchmarks in global currency markets. The index, which measures the value of the US dollar against a basket of six major currencies, experiences heightened volatility and presents potential opportunities.
Understanding the DXY: A Macro Lens on the Dollar
The DXY tracks the relative strength of the US dollar versus a weighted currency basket including the euro, Japanese yen, British pound, Canadian dollar, Swedish krona, and Swiss franc. Although the euro comprises nearly 58% of the index, the DXY reflects broad USD strength or weakness across global markets, not just against a single currency.
Traders and analysts use the DXY as a key macro indicator—to track policy divergence between central banks, to hedge USD exposure, and to assess broader market sentiment. Rising DXY levels often signal tightening US policy or global risk aversion, while declines may reflect weakening growth expectations, dovish Fed policy, or geopolitical stress. In volatile environments like 2025, the DXY serves as a real-time barometer of global confidence in the US economy and dollar-based assets.
Recent Price Swings: Tariffs & Policy Uncertainty Shake the Dollar
Since April, the US Dollar Index has faced one of its most volatile stretches in years, driven by a convergence of Federal Reserve policy uncertainty and new trade tariffs announced by President Trump.
April: “Liberation Day” Tariffs Trigger Market Shock
On 2 April, the announcement of sweeping “Liberation Day” tariffs—10% on nearly all imports, with higher duties on selected countries—jolted currency markets. The DXY fell over 2% in a single day. In the following weeks, the index continued to decline as business confidence deteriorated and early signs of recession risk emerged.
May–June: Policy Headwinds Compound Dollar Weakness
As the tariff package took effect, the dollar extended its slide—marking a ~10% drop from its late‑2024 peak, the worst first-half performance in over 50 years. Investors reassessed US growth prospects amid the pressures of trade friction. The Fed responded with a hawkish pause, while President Trump publicly urged for rate cuts, further muddying the policy outlook and pressuring the dollar.
July: Uncertainty Builds
By early July, the DXY had fallen below 97, tallying an approximate 11% year-to-date decline. Analysts cite a “perfect storm” of expanding fiscal deficits, erratic trade decisions, and growing doubts over US policy credibility as key reasons for the dollar’s fall from favour.
Why DXY Matters Now More Than Ever
The DXY has become a real-time gauge of market confidence in US policy stability. The dollar’s sharp decline in 2025 underscores how fragile that confidence can be in the face of aggressive trade measures and uncertain monetary direction.
The introduction of Trump’s tariffs has raised structural concerns among investors:
- Growth expectations have been cut due to higher input costs and supply chain friction.
- The so-called safe-haven appeal of the USD has eroded, with flows shifting to the euro, Swiss franc, and gold.
- Foreign demand for dollar assets has softened, as fears of a prolonged trade conflict and fiscal indiscipline mount.
In this climate, the DXY has evolved into a barometer for geopolitical tension, inflation fears, and investor sentiment towards US leadership.
Bottom Line
The DXY is not just a tool for dollar specialists—it's a key reference for any trader dealing with macro-sensitive instruments. As the global rate environment continues to shift and the US economy shows mixed signals, the DXY may become one of the most revealing indicators to watch and trade in the second half of 2025.
This article represents the opinion of the Companies operating under the FXOpen brand only. It is not to be construed as an offer, solicitation, or recommendation with respect to products and services provided by the Companies operating under the FXOpen brand, nor is it to be considered financial advice.
Tariff Wars Pushing USD HigherThis is the Weekly FOREX Forecast for the week of July 14 - 18th.
In this video, we will analyze the following FX market: USD Index
The latest headlines tell the story. The tariffs are triggering a slow run to the USD safe haven, but the inflows from investors are moving the needle. The previous week closed strong, with buyers in control. There's a good chance we'll see more of the same this coming week.
Look for the strength in USD to continue to be supported by fundamental news, and outperform the other major currencies.
Buy USDxxx
Sell xxxUSD
Enjoy!
May profits be upon you.
Leave any questions or comments in the comment section.
I appreciate any feedback from my viewers!
Like and/or subscribe if you want more accurate analysis.
Thank you so much!
Disclaimer:
I do not provide personal investment advice and I am not a qualified licensed investment advisor.
All information found here, including any ideas, opinions, views, predictions, forecasts, commentaries, suggestions, expressed or implied herein, are for informational, entertainment or educational purposes only and should not be construed as personal investment advice. While the information provided is believed to be accurate, it may include errors or inaccuracies.
I will not and cannot be held liable for any actions you take as a result of anything you read here.
Conduct your own due diligence, or consult a licensed financial advisor or broker before making any and all investment decisions. Any investments, trades, speculations, or decisions made on the basis of any information found on this channel, expressed or implied herein, are committed at your own risk, financial or otherwise.

US DOLLAR Analysis: Bullish Momentum Building?TVC:DXY is finally showing signs of stabilization. The index has successfully rejected a key support level, an area where price has historically attracted strong buying interest. This level closely aligns with the psychological $100 mark, which has once again acted as a pivotal point for market participants, reinforcing its relevance as a key technical level.
The recent price action confirms bullish interest, as evidenced by a strong rejection pattern within the zone, with long lower wicks and bullish follow-through candles. The support zone held firm, and buyers have stepped in, initiating an upward move.
Now that price has bounced from this level, the probability of a continued rally increases. If the bullish momentum sustains, the price could move toward the 102.500 level, a logical near-term target based on previous structure and minor resistance.
However, a failure to maintain above the 100.00 handle or a sudden shift in sentiment could still pose downside risks. A confirmed breakdown below the green support zone would invalidate this bullish outlook and potentially open the door for further declines.
Remember, always confirm your setups and use proper risk management.

US DOLLAR Weekly Forex Forecast: Look For BUYS This Week!USD INDEX is bullish for the short term... but bearish in the longer term. This week will have
opportunities for short term long positions. Just be mindful not to swing for home runs! The larger pullback seems to have started, so the bears are coming!
Enjoy!
May profits be upon you.
Leave any questions or comments in the comment section.
I appreciate any feedback from my viewers!
Like and/or subscribe if you want more accurate analysis.
Thank you so much!
Disclaimer:
I do not provide personal investment advice and I am not a qualified licensed investment advisor.
All information found here, including any ideas, opinions, views, predictions, forecasts, commentaries, suggestions, expressed or implied herein, are for informational, entertainment or educational purposes only and should not be construed as personal investment advice. While the information provided is believed to be accurate, it may include errors or inaccuracies.
I will not and cannot be held liable for any actions you take as a result of anything you read here.
Conduct your own due diligence, or consult a licensed financial advisor or broker before making any and all investment decisions. Any investments, trades, speculations, or decisions made on the basis of any information found on this channel, expressed or implied herein, are committed at your own risk, financial or otherwise.

US INDEX (DXY) To 99 in 2025hello friends
DXY has reached or a strong daily resistance zone and creating a double TOP and rejection 2 test on trend line gold markets are show u why its dropping technically there is many other things showing weakness in $ from there are Fundamentally also something not going good for $ so we don't miss type of historical moves share Ur thoughts with us
Stay tuned

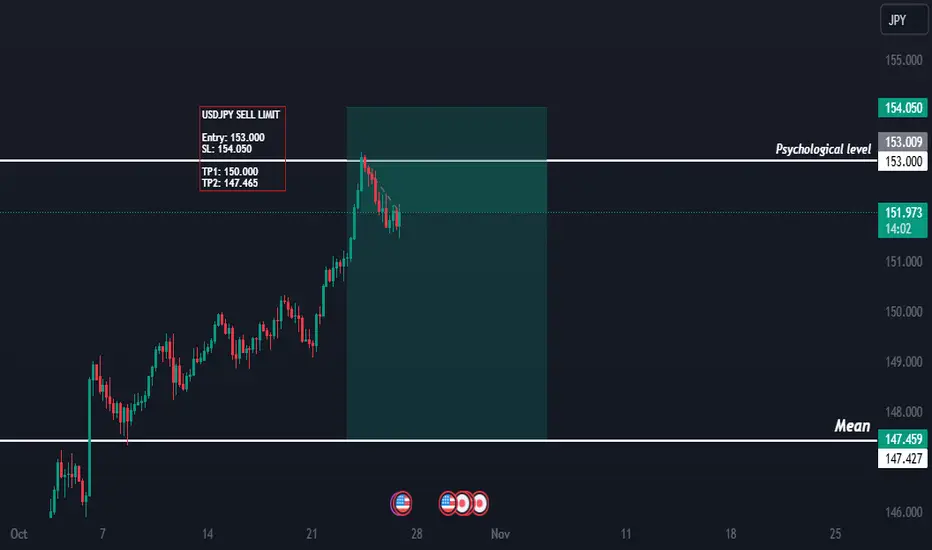
USDJPY: Potential for a Slight Bearish Bias Amid Key FundamentalUSDJPY: Potential for a Slight Bearish Bias Amid Key Fundamental Drivers (25/10/2024)
Today, the USDJPY currency pair could experience a slight bearish bias, driven by recent shifts in both the Japanese and U.S. economic landscape. Here’s a breakdown of the factors contributing to this potential trend, along with insights into what traders should watch as the day unfolds.
1. Bank of Japan’s Potential Shift in Policy
The Bank of Japan (BoJ) has maintained its ultra-loose monetary policy stance for years, but recent signals suggest a possible move towards tightening. Japanese inflation rates have gradually risen, and with core inflation holding steady above target levels, the BoJ may finally consider adjusting its dovish stance. Any indication of a shift toward a more hawkish BoJ, even if gradual, could support the JPY, creating downward pressure on the USDJPY pair.
2. US Dollar Weakness on Federal Reserve Pause Speculation
The US Dollar (USD) has softened recently as speculation grows that the Federal Reserve may pause rate hikes. U.S. economic data has shown signs of cooling inflation, and Fed officials have hinted that a pause could be on the horizon, given recent macroeconomic indicators. A dovish tone from the Fed typically weakens the USD, thus enhancing the relative strength of the JPY. This potential softening in the dollar is an essential factor in the slight bearish bias for USDJPY.
3. Market Sentiment Shifting Towards Safe-Haven Assets
Investor sentiment is currently tilted toward safe-haven assets, largely due to ongoing geopolitical tensions and uncertain global economic conditions. While the USD is also a safe-haven currency, the Japanese Yen (JPY) often gains favor when there’s heightened uncertainty in markets, especially in Asia. This risk-averse sentiment is driving investors to seek the JPY, which could contribute to additional downward momentum in the USDJPY pair today.
4. Technical Indicators Suggest Resistance for USDJPY
From a technical perspective, USDJPY is encountering resistance around the 150.00 level. This is a critical psychological threshold, and the pair’s failure to break above this level reinforces a potential bearish sentiment. With Relative Strength Index (RSI) levels approaching overbought territory, a bearish correction might be anticipated. Additionally, a dip below the 149.00 support level could confirm this outlook and signal further downside potential.
Summary: Slight Bearish Bias for USDJPY
Today’s fundamental factors suggest a slight bearish bias for USDJPY, largely due to potential changes in Bank of Japan policy, a softer US Dollar from Federal Reserve pause speculation, and increased demand for safe-haven assets. Technical resistance at key levels also reinforces the likelihood of a bearish tilt for the pair.
Traders should watch for real-time updates on BoJ announcements, Fed commentary, and any developments in geopolitical news that could impact USDJPY direction.
---
Keywords
1. USDJPY forecast
2. Bank of Japan policy
3. US Dollar analysis
4. Fed rate pause
5. USDJPY bearish trend
6. Forex trading insights
7. Safe-haven assets
8. Japanese Yen strength
9. USDJPY technical levels
Bearish reversal?US Dollar Index (DXY) is rising towards the pivot and could reverse to the 1st support.
Pivot: 104.54
1st Support: 104.05
1st Resistance: 104.81
Risk Warning:
Trading Forex and CFDs carries a high level of risk to your capital and you should only trade with money you can afford to lose. Trading Forex and CFDs may not be suitable for all investors, so please ensure that you fully understand the risks involved and seek independent advice if necessary.
Disclaimer:
The above opinions given constitute general market commentary, and do not constitute the opinion or advice of IC Markets or any form of personal or investment advice.
Any opinions, news, research, analyses, prices, other information, or links to third-party sites contained on this website are provided on an "as-is" basis, are intended only to be informative, is not an advice nor a recommendation, nor research, or a record of our trading prices, or an offer of, or solicitation for a transaction in any financial instrument and thus should not be treated as such. The information provided does not involve any specific investment objectives, financial situation and needs of any specific person who may receive it. Please be aware, that past performance is not a reliable indicator of future performance and/or results. Past Performance or Forward-looking scenarios based upon the reasonable beliefs of the third-party provider are not a guarantee of future performance. Actual results may differ materially from those anticipated in forward-looking or past performance statements. IC Markets makes no representation or warranty and assumes no liability as to the accuracy or completeness of the information provided, nor any loss arising from any investment based on a recommendation, forecast or any information supplied by any third-party.


Dollar Index (DXY): Important Key Levels to Watch 💵
Here is my latest structure analysis for Dollar Index.
Resistance 1: 105.00 - 105.10 area
Resistance 2: 105.68 - 105.88 area
Support 1: 104.28 - 104.7 area
Support 2: 102.60 - 103.10 area
Support 3: 101.75 - 102.00 area
Support 4: 100.55 - 100.68 area
Support 5: 99.57 - 99.75 area
Consider these structures for pullback/breakout trading.
❤️Please, support my work with like, thank you!❤️

Dollar Index (DXY): Detailed Technical Analysis 💸
Top-down analysis for Dollar Index.
Daily/4h outlook.
Price action.
Key levels.
Scenarios & thoughts.
❤️Please, support this video with like and comment!❤️

AW US Dollar\Euro Analysis - Uncovering More Supporting EvidenceThis right here is fresh new US Dollar analysis. It will form the basis for future ideas.
I have taken my bull and bear views of late and dissected them in order to find inaccuracies in the analysis.
To make assumptions based on incorrect long-term analysis is like shooting yourself in the foot.
The thing is that I have gotten used to doing this and going back and sifting and sorting through the potentials.
All whilst remembering the inaccuracies of all the previous ideas.
Taking the things that make the most sense and putting them at the top of the list.
Here I go about building a thesis that US Dollar strength may return sooner than originally thought.
Using a set of examples, I explain why I believe that this could be the likely outcome.
Remember to use Disciplined Money Management Principles to ensure longevity as a trader.
If you don't know the long term pattern shouldn't you be doing your research instead of just following the crowd?
Just remember: I am not a financial adviser; I suggest using this only as a guide. Always do your own research.
